Sample Category Title
USD Strengthens On High NFP Figure
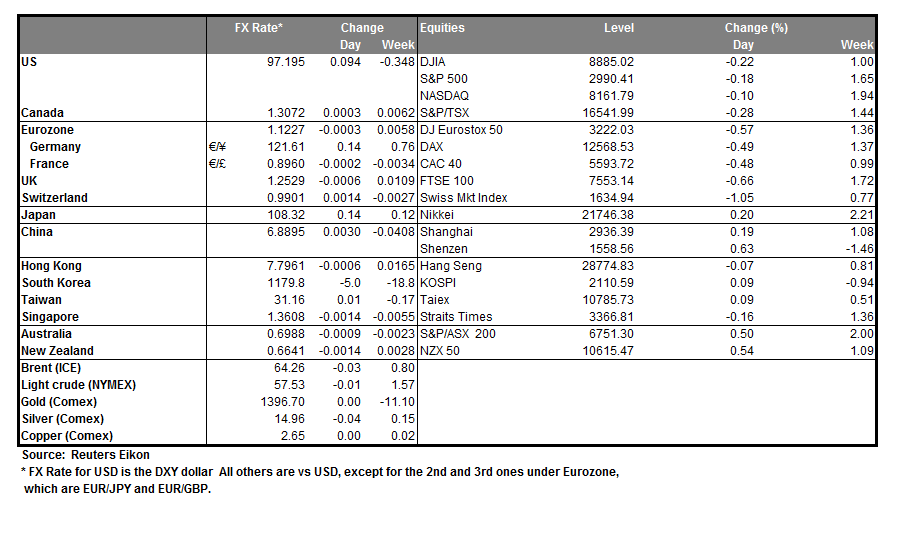
The greenback had substantial gains against many of its counterparts on Friday as the June Non Farm Payrolls exceeded consensus expectations. The NFP figure rose to 224k exceeding consensus of 160k, while on the flip side, Average earnings remained unchanged at +3.1% yoy, and unemployment ticked up reaching 3.7%. It was characteristic that the strong rise of the NFP figure overshadowed the tick up of the unemployment rate providing support for the USD. Despite analysts already discussing a possible shift of the Fed’s stance towards remaining on hold, instead the market’s priced in rate cut of 25 bp, we expect that such a discussion may be premature, as the Fed may be interested in the broader picture. We could see the USD gaining in the aftermath of the release and should there be Fed officials start showing more confidence we could see the USD strengthening even further. EUR/USD dropped on Friday breaking the 1.1260 (R1) support line (now turned to resistance), yet seems to be finding considerable support at the 1.1220 (S1) support line. We could see the pair dropping even further should the USD strengthen even further, yet it should be noted that in the 4 hour chart the RSI indicator is at the reading of 30, implying a rather overcrowded short position. Should the bears dictate the pair’s direction once again, we could see it breaking the 1.1220 (S1) support line and aim for the 1.1180 (S2) support level. Should the bulls take over, we could see the pair aiming if not breaking the 1.1260 (R1) resistance line.
WTI prices rise as OPEC output hits new low
OPEC output hit a new five-year low in June as media reported on Friday. Analysts seems to be sighting that Saudi supply was not able to offset losses in Iran and Venezuela due to US sanctions. A Reuters report suggested that the Saudis, despite raising production are still pumping less than he OPEC deal allows it. On the flip side, Iran’s Oil minister stated that he was very hopeful of an improvement in the country’s oil exports, despite tightening US sanctions. Should headlines about reduced production continue to reel in, we could see oil prices rising even further. WTI prices rose on Friday testing the 57.70 (R1) resistance line, however were unable to clearly break above it. We could see bullish pressures continuing to influence the commodity’s direction, especially should there be further headlines about tight production levels. Should the commodity find fresh buying orders along its path, we could see it breaking the 57.70 (R1) resistance line and aim for the 59.50 (R2) resistance hurdle. Should it come under the selling interest of the market, we could see it aiming if not breaking the 56.00 (S1) support line.
Other economic highlights, today and early tomorrow
Today during the European session, we get Germany’s Industrial output growth rate and trade balance, both for May.
As for the rest of the week:
On Tuesday, no major financial releases are expected. On Wednesday, we get China’s CPI and PPI rates for June, UK’s GDP for May, from Canada BoC’s interest rate decision, and from the US the FOMC meeting minutes. On Thursday, we get from Germany and France the final HICP rate for June, ECB’s account of the last monetary policy and from the US the core and headline CPI rates for June. On Friday, we get from China’s trade data for June, Eurozone’s industrial production for May and the US PPI rate for June.
EUR/USD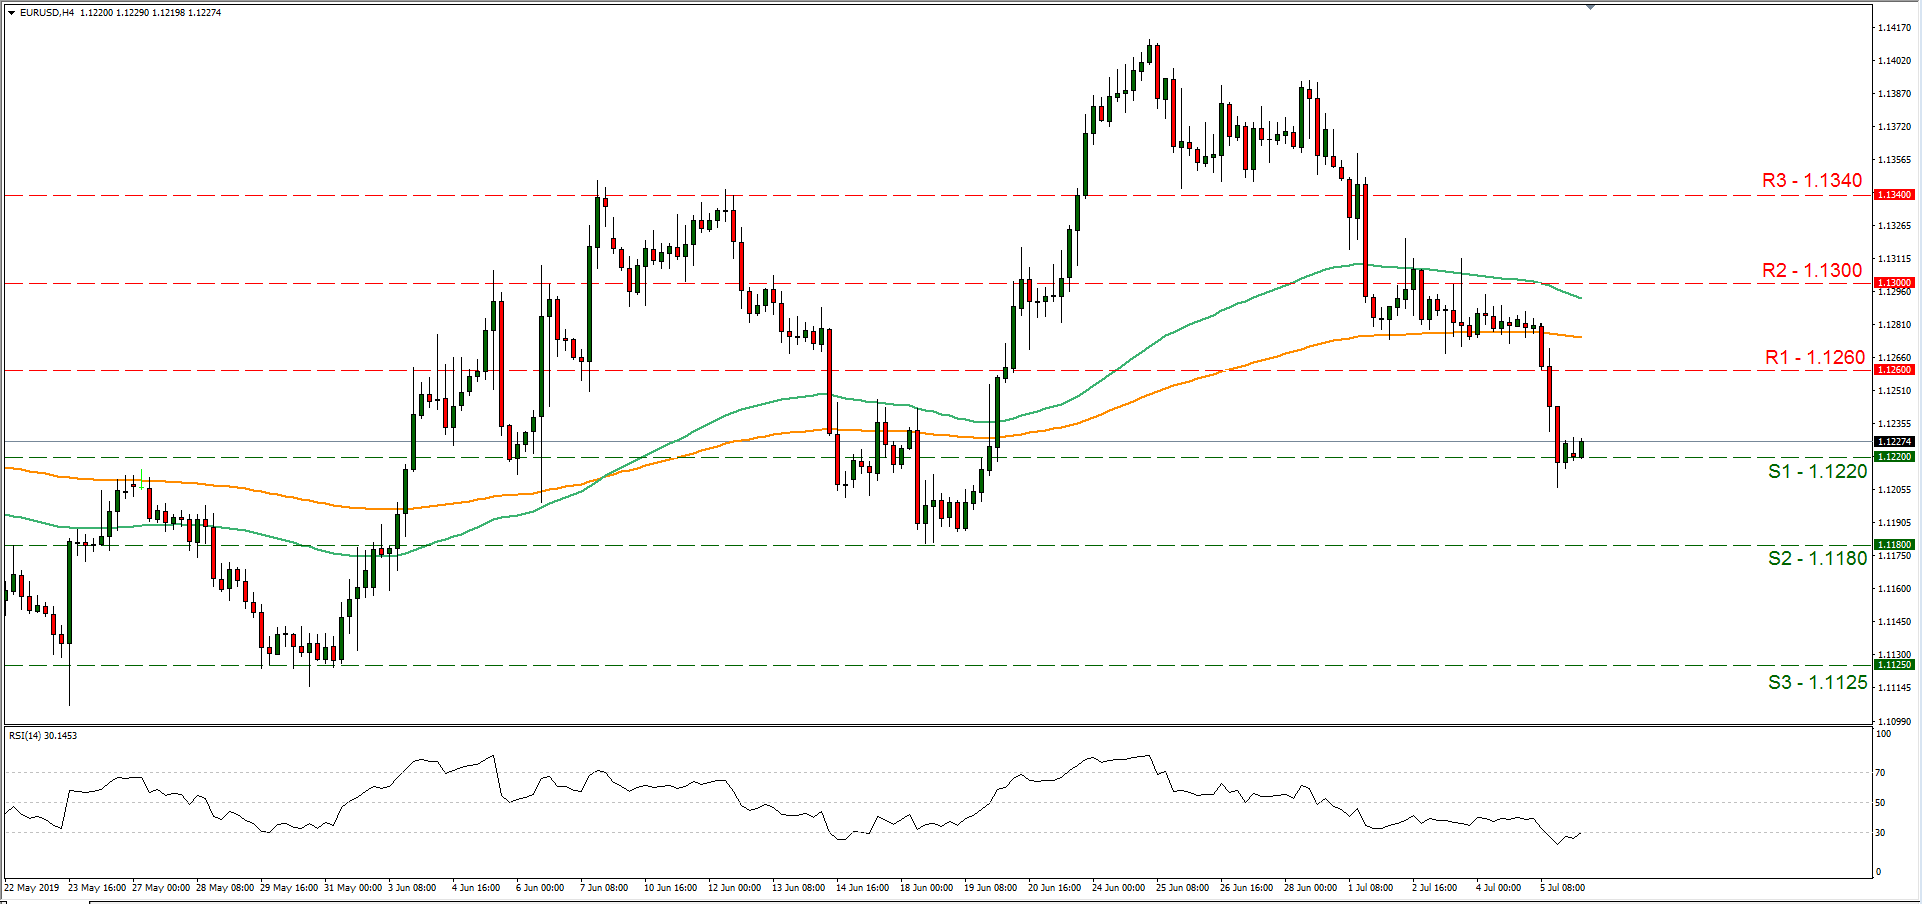
Support: 1.1220 (S1), 1.1180 (S2), 1.1125 (S3)
Resistance: 1.1260 (R1), 1.1300 (R2), 1.1340 (R3)
WTI H4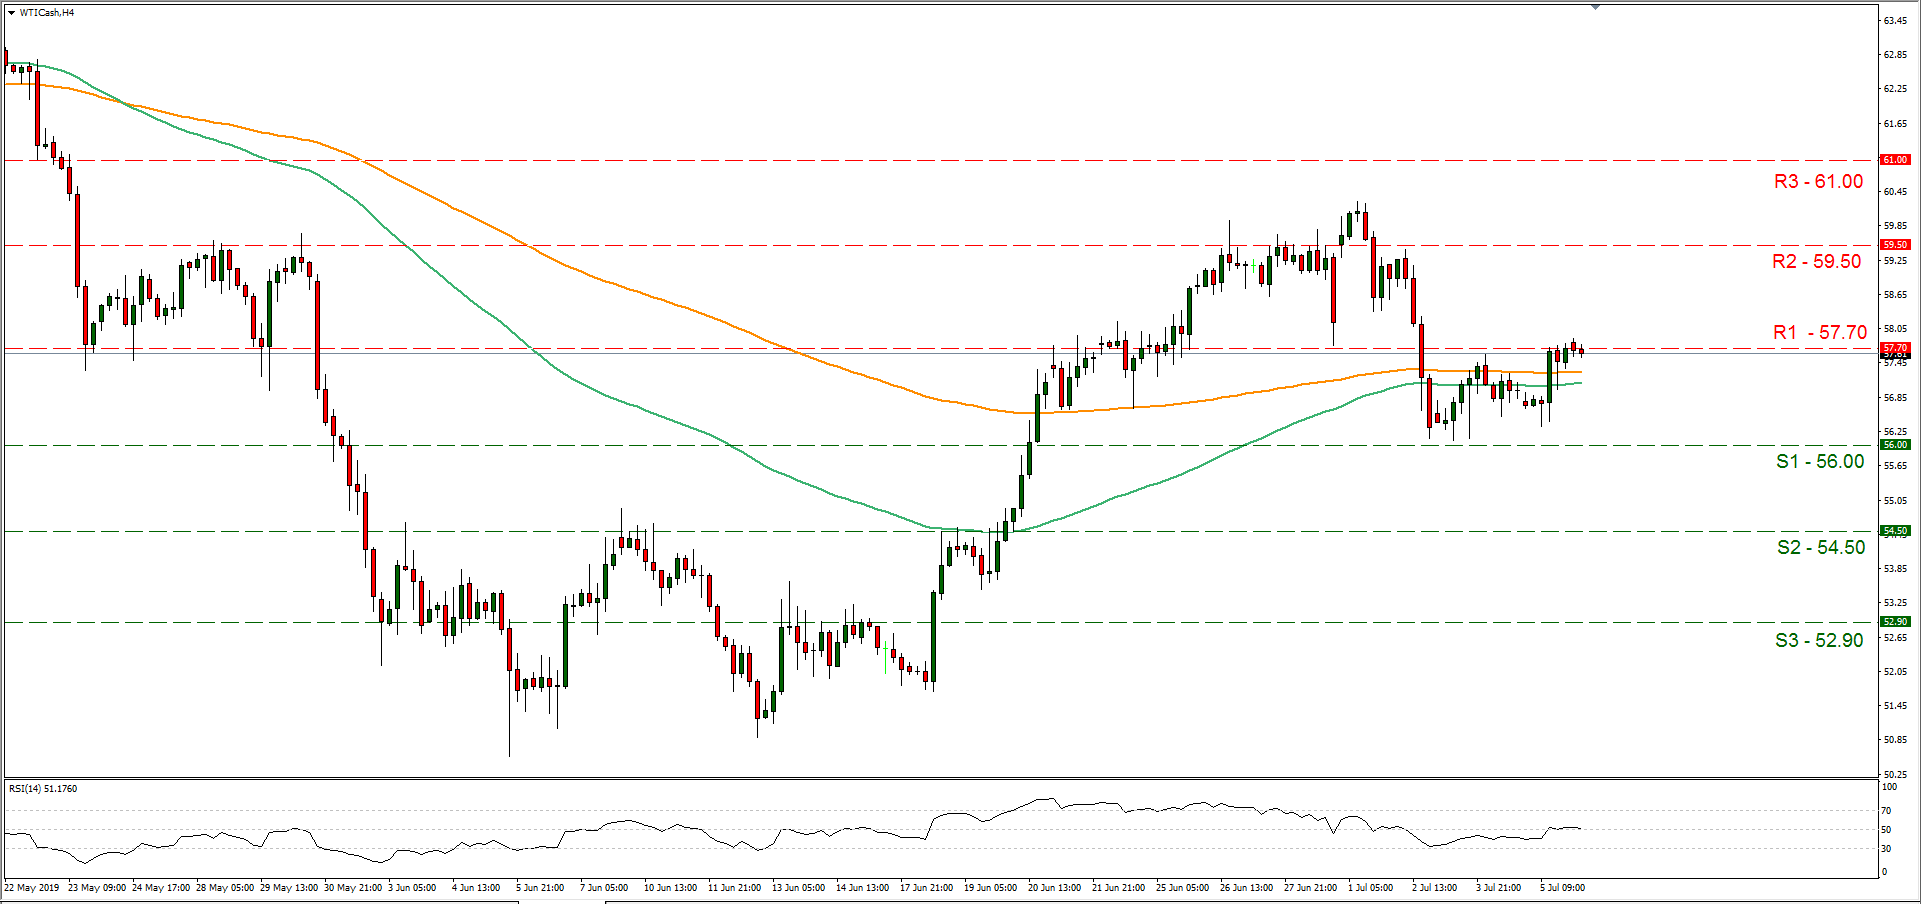
Support: 56.00 (S1), 54.50 (S2), 52.90 (S3)
Resistance: 57.70 (R1), 59.50 (R2), 61.00 (R3)
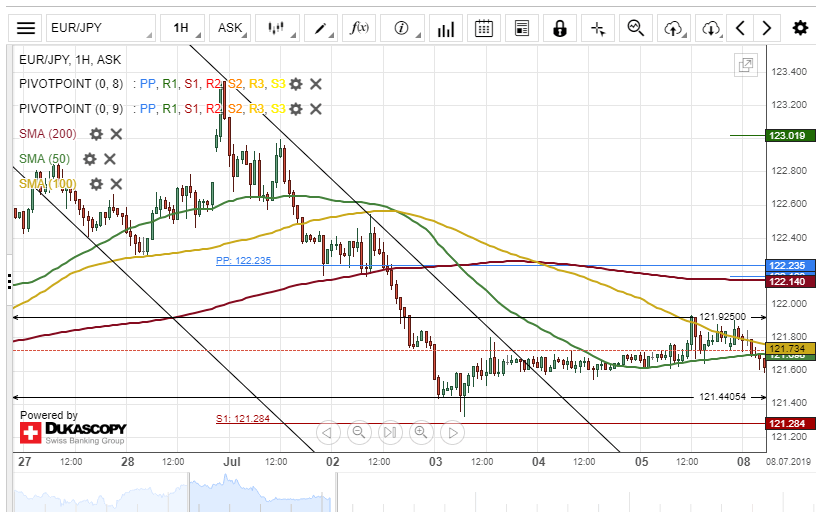
EUR/JPY Trading In Horizontal Channel
The single European currency has been trading in a horizontal channel against the Japanese Yen since July 3. The currency pair tested the upper border of the channel at 121.92 on Friday.
Everything being equal, it is likely that the EUR/JPY exchange rate will continue to trade along the channel during the following trading session.
Technical indicators demonstrate that the currency exchange rate could edge lower in the coming days. The potential downside target for bearish traders might be near the monthly S1 at 121.28.
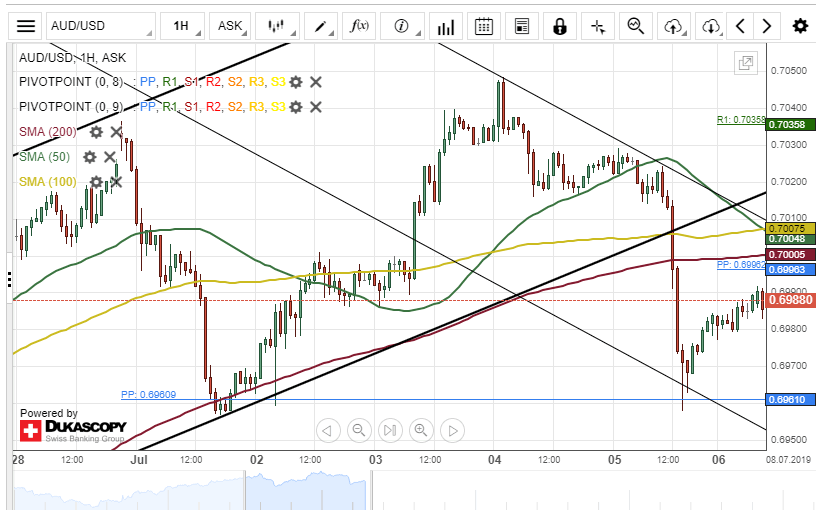
AUD/USD Might Edge Higher
The Australian Dollar depreciated about 70 base points against the US Dollar on Friday. The decline began after the US macroeconomic data releases. The pair tested the monthly pivot point at 0.6961.
The currency pair bounced off the support level at the end of Friday's trading session.
Most likely, the currency exchange rate could aim for the 0.7020 area within this session.
However, a resistance cluster formed by the 50-, 100– and 200-hour SMAs near 0.7007 could provide resistance for the pair today.
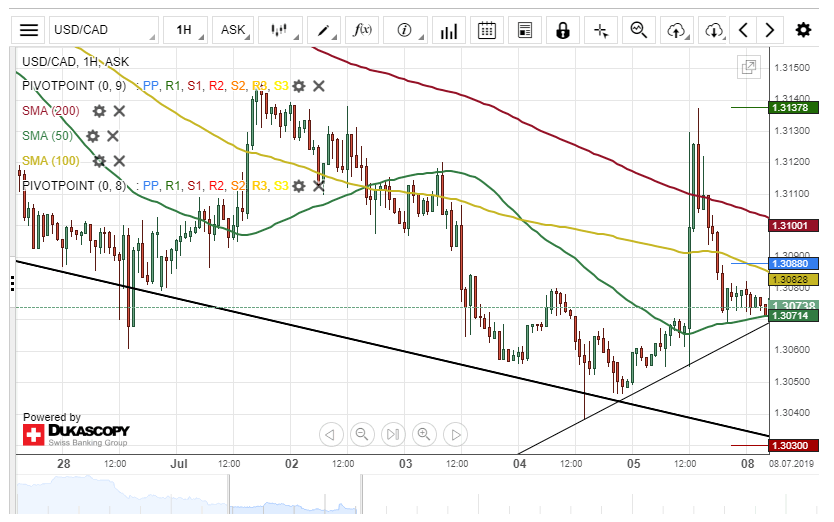
USD/CAD Target At 1.3120
The US Dollar skyrocketed by 81 base points against the Canadian Dollar on Friday. The surge occurred after the US employment rate data release during Friday's trading session.
However, after hitting the weekly R1 at 1.3137, the currency pair made a U-turn south.
By and large, it is likely that the USD/CAD exchange rate could make an upside movement today. The potential target will be at 1.3120.
Although, technical indicators suggest the currency exchange rate might continue its downward movement today.
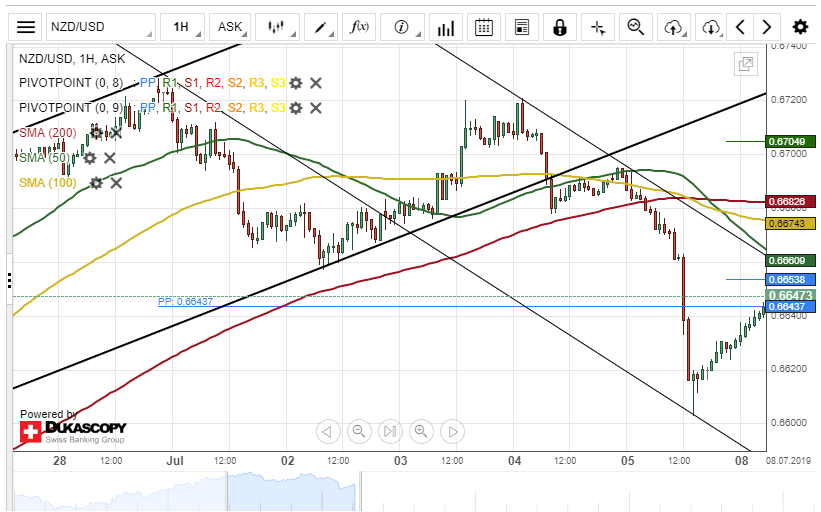
NZD/USD Bounces Off Support
The New Zealand Dollar fell by 91 base points against the US Dollar Friday. The decline began after the US Non-Farm Payroll data releases on Friday.
The currency pair bounced off from the lower boundary of a descending channel pattern at 0.6600 at the end of Friday's trading session.
Most likely, the currency exchange rate could aim for a resistance level at 0.6704 during the following trading session.
However, a resistance cluster formed by the 50-, 100– and 200-hour SMAs at 0.6674 within this session.
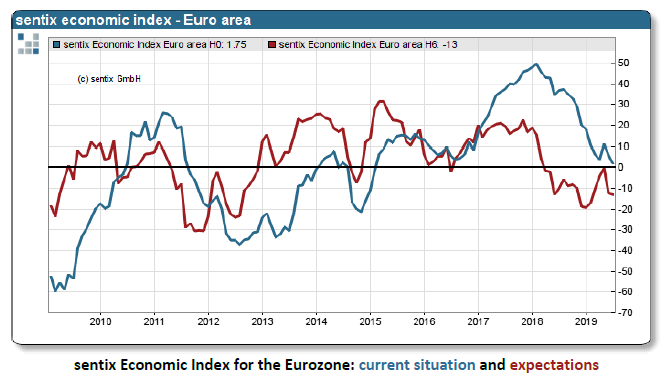
Eurozone Sentix investor confidence dropped to -5.8, lowest since 2014, Germany even worse
Eurozone Sentix Economic Index dropped to -5.8 in June, down from -3.3 and missed expectation of 0.2. It's also the lowest level since November 2014. Current Situation Index dropped from 6.0 to 1.8, lowest since February 2015. Expectations Index also dropped from -12.3 to -13.0, lowest since February 2019.
Sentix noted that after the supposed de-escalation signals in US-China trade war at G20, there was "great hope that the downward trend in the economy could be stopped". But, investors are "not blinded by the rising share prices" as expectations show no upward reaction to the news. It warned, "without resilient negotiation results, it will be difficult for investors worldwide to develop a different perspective."
For Germany, Overall Economic Index dropped from -0.7 to -4.8, lowest since November 2009. Current Situation Index dropped from 13.5 to 7.0, lowest since April 2010. Expectations Index dropped from -14.0 to -16.0, lowest since February 2019.
Sentix said "things are even worse for the German economy". "The high dependence on exports and the Chinese sales market is increasingly becoming a burden and the customs dispute hovers like a sword of Damocles over the former model boy of the Euro region." Also, the automotive industry is "simply not emerging from the crisis".
When Bad News Become Good News
Global stocks and bonds have been surging throughout the past week with all major US equity indices reaching new record highs. The rally in risk assets was not driven by a prosperous economic outlook, but rather a dim one. Investors have shifted into the mentality of “weaker the better,” suggesting that weaker economic data across the globe will force central banks to begin a synchronized easing in monetary policy. Lower interest rates will make valuations more attractive to investors and improve corporate financials by lowering borrowing costs. However, a lot of such optimism has already been priced in with markets' expectations of looser monetary policy being extremely high, leaving little room for further upside.
On Friday, the US non-farm payrolls headline number took many market participants by surprise. The US economy added 224,000 jobs last month versus expectations of 160,000. The strong figure was not enough to change market expectations of the Fed easing policy by the end of this month, but clearly ended speculations of an aggressive 50 basis-points rate cut. The scaled-back expectations triggered a sell signal in Asian markets today led by Chinese stocks; meanwhile, S&P 500 futures are also pointing towards a lower open after falling 0.2% on Friday.
Expectations of 25 basis-points rate cut seem reasonable as unemployment ticked slightly higher, and with wage growth no longer indicating an overheated labor market.
This week investors will be all ears to Fed's Chairman Jerome Powell when he delivers his twice-yearly monetary policy report to the Congress on Tuesday. His speech is likely to be the key event to equity, fixed income, and currency markets. With President Trump increasing his comments on the Fed and several economic indicators pointing south, it will be interesting to see if Powell lays a clear case of monetary easing in his testimony
On Wednesday the Federal Reserve will release minutes from its last meeting. Any clues of what policymakers were thinking of will also help shape expectations for the upcoming decision on July 31.
The Turkish Lira is back to the news headlines after President Recep Tayyib Erdogan's decision to dismiss the country's central bank governor. The Lira was down 2.5% at the time of writing as investors became more confident that interest rates will begin to decline at a fast pace. As traders go short on the Turkish currency, state banks are likely to begin selling foreign currencies to stabilize the Lira. Whether we're going to see a sharp rate cut of several 100-basis points in the next policy meeting on July 25 remains to be seen, however, expect the currency to remain volatile for the next several weeks.
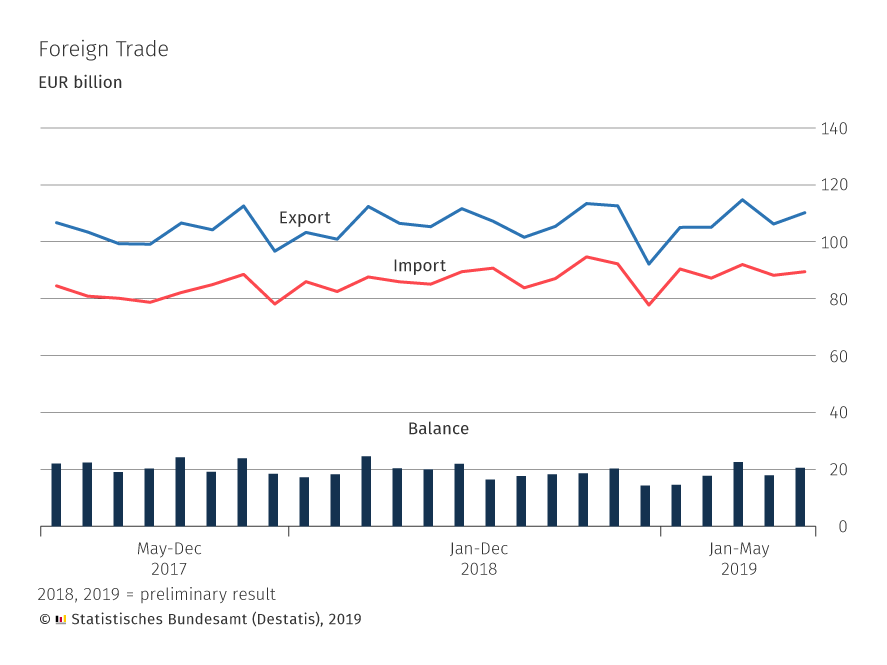
German trade surplus widened to EUR 20.6B, industrial production rose 0.3%
German foreign trade surplus widened to EUR 20.6B in May. On calendar and seasonally adjusted terms, trade surplus widened to EUR 18.7B. Exports rose 1.1% mom, 4.5% yoy to EUR 113.9B. Imports dropped -0.5% mom, 4.9% yoy to EUR 93.4B.
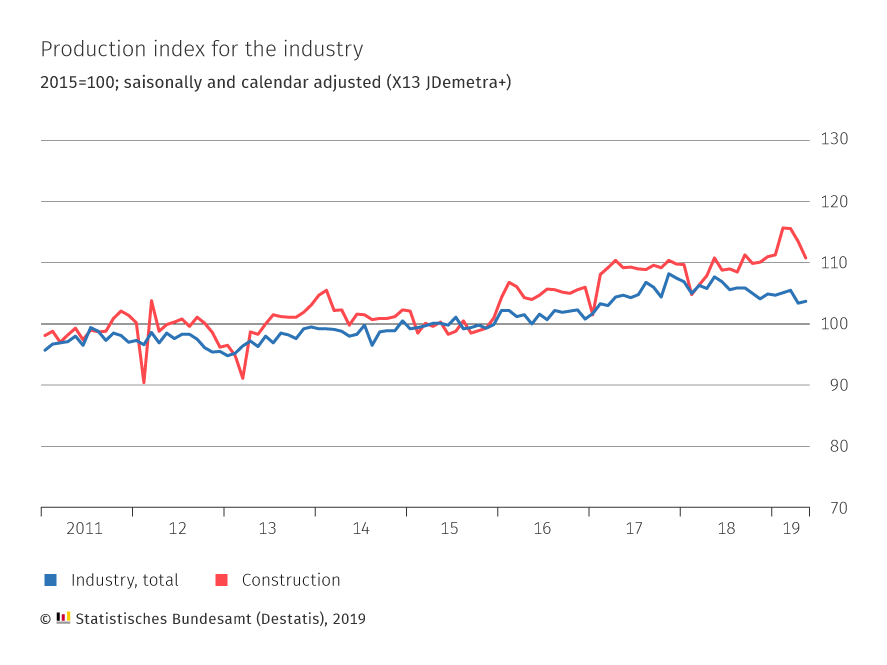
Industrial production rose 0.3% mom in May, matched expectations. Production in industry excluding energy and construction was up by 0.9%. Outside industry, energy production was down by -.2% in May 2019 and the production in construction decreased by -2.4%.
The Analytical Overview Of The Main Currency Pairs
The EUR/USD currency pair
Technical indicators of the currency pair:
Prev Open: 1.12833
Open: 1.12221
% chg. over the last day: -0.52
Day's range: 1.12197 – 1.12328
52 wk range: 1.1111 - 1.2009
On Friday, the US published a fairly optimistic report on the labor market in June, which caused an increase in demand for USD. The dollar index (#DX) set new monthly highs. In the non-agricultural sector of the country, 224,000 new jobs were created, which is significantly higher than the forecasted value of 160,000. The growth of the average hourly wage did not meet market expectations and amounted to 0.2%. At the same time, the previous figure was revised upwards to 0.3%. The unemployment rate rose from 3.6% to 3.7%. At the moment, EUR/USD quotes are consolidating in the range of 1.12100-1.12400. Trading instrument has the potential to further decline. We recommend to open positions from key levels.
The Economic News Feed for 08.07.2019 is calm.
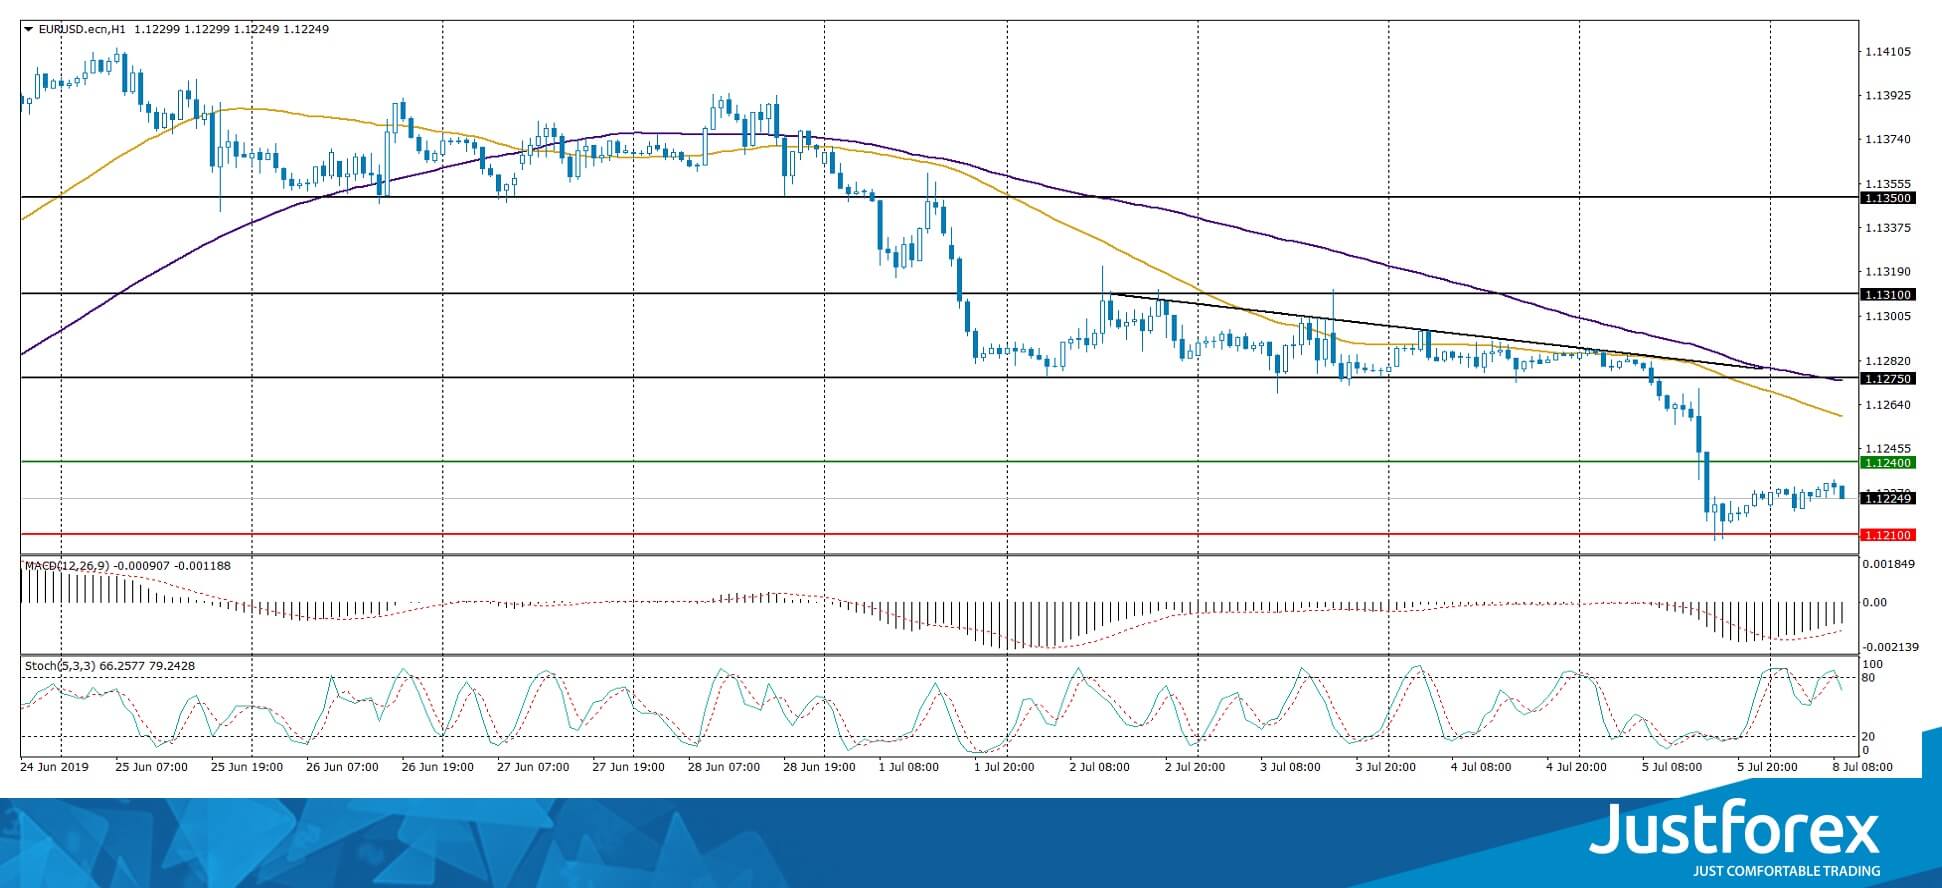
The price has fixed below 50 MA and 100 MA, which indicates the power of the sellers.
The MACD histogram is in the negative zone, but above the signal line, which gives a weak signal to sell EUR/USD.
The Stochastic Oscillator is located near the overbought zone, the %K line crossed the %D line. There are no signals at the moment.
Trading recommendations
Support levels: 1.12100, 1.11600
Resistance levels: 1.12400, 1.12750, 1.13100
If the price consolidates below the local support of 1.12100, the quotes will drop to 1.11700-1.11500.
Alternatively, quotes could recover to 1.12700-1.13000.
The GBP/USD currency pair
Technical indicators of the currency pair:
Prev Open: 1.25763
Open: 1.25248
% chg. over the last day: -0.43
Day's range: 1.25207 - 1.25334
52 wk range: 1.2438 - 1.3631
Currency pair GBP / USD once again moved to a decline. The demand for USD has grown after the release of positive reports from the labor market. Tje rading tool updated key extremums and is consolidating in a rather narrow range of 1.25150-1.25350. In the near future, we deem a technical correction possible. Keep an eye on Brexit and open positions must be opened from key levels.
The Economic News Feed for 08.07.2019 is calm.
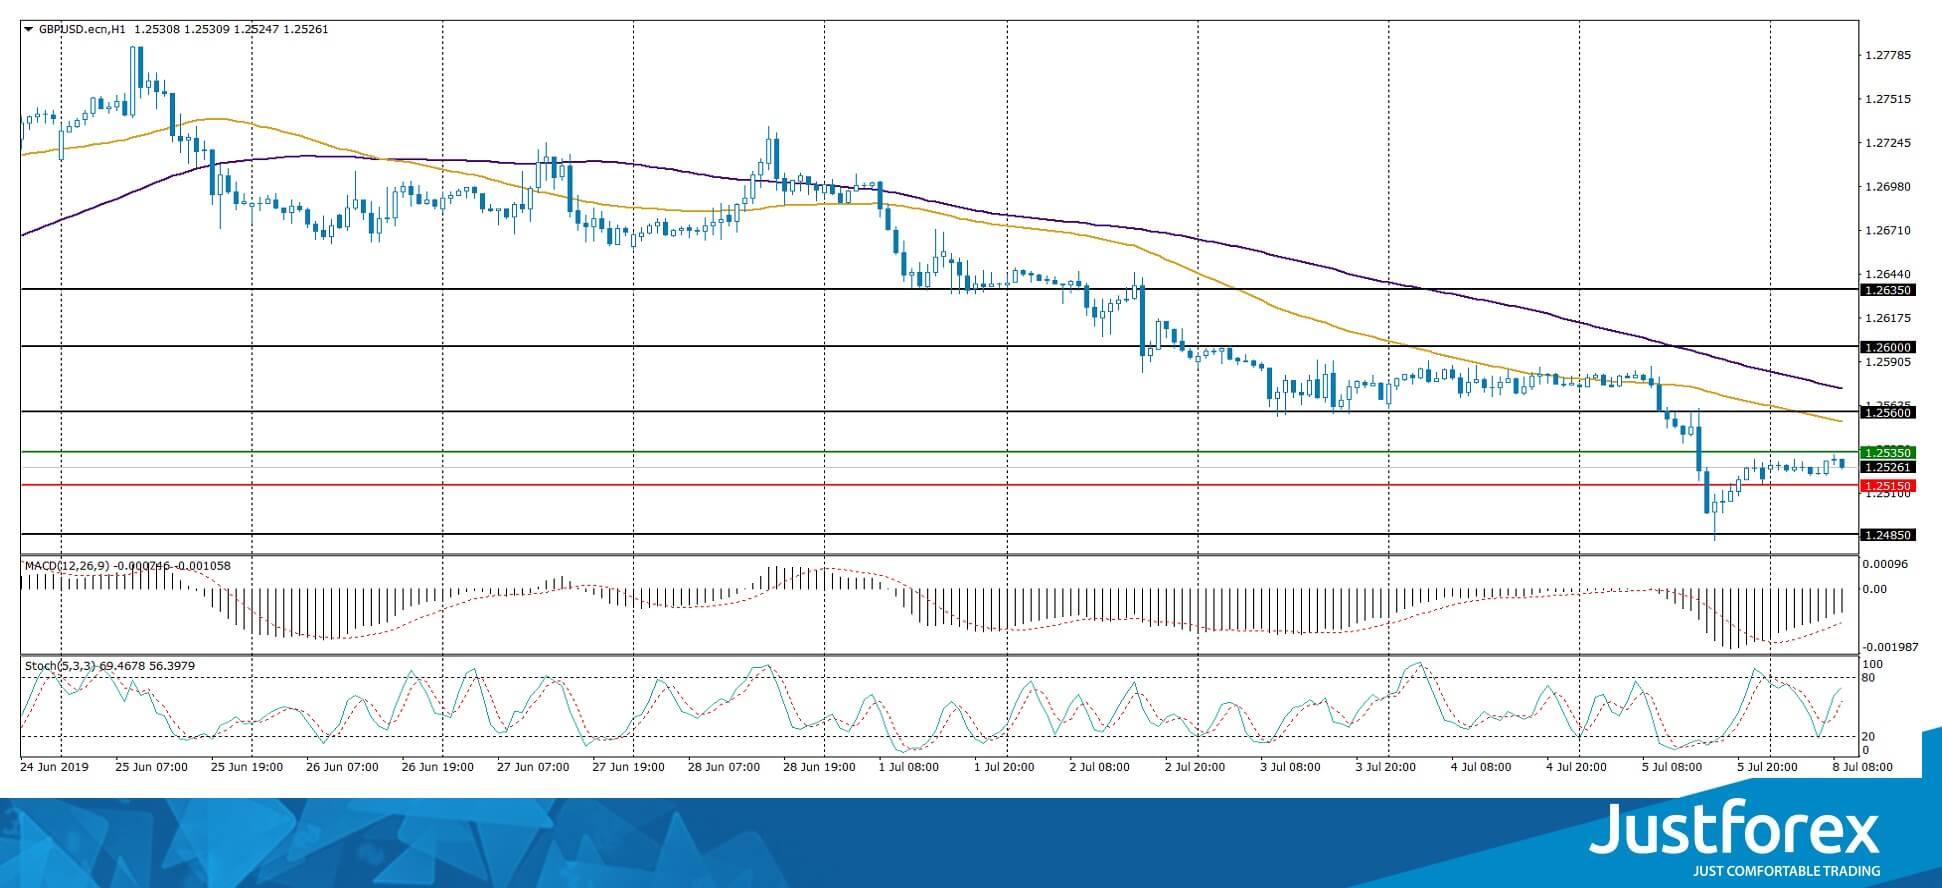
The price has fixed below 50 MA and 100 MA, which indicates the power of the sellers.
The MACD histogram is in the negative zone, but above the signal line, which gives a weak signal to sell GBP/USD.
The Stochastic Oscillator is in the neutral zone, the %K line is above the %D line, which indicates a bullish mood.
Trading recommendations
Support levels: 1.25150, 1.24850
Resistance levels: 1.25350, 1.25600, 1.26000
If the price consolidates below 1.25150, the quotes will move to 1.24850-1.24600.
Alternatively, the quotes may rise toward 1.25600-1.25800.
The USD/CAD currency pair
Technical indicators of the currency pair:
Prev Open: 1.30492
Open: 1.30660
% chg. over the last day: +0.19
Day's range: 1.30660 - 1.30834
52 wk range: 1.2727 - 1.3664
On Friday USD/CAD had rather high trading activity. CAD was under pressure after a weak report on the labor market in Canada. At the moment, USD/CAD quotes are consolidating. Local levels of support and resistance are 1.30600 and 1.30850. Trading instrument can grow further. Pay attention to the dynamics of oil prices and open positions from key levels.
The Economic News Feed for 08.07.2019 is calm.
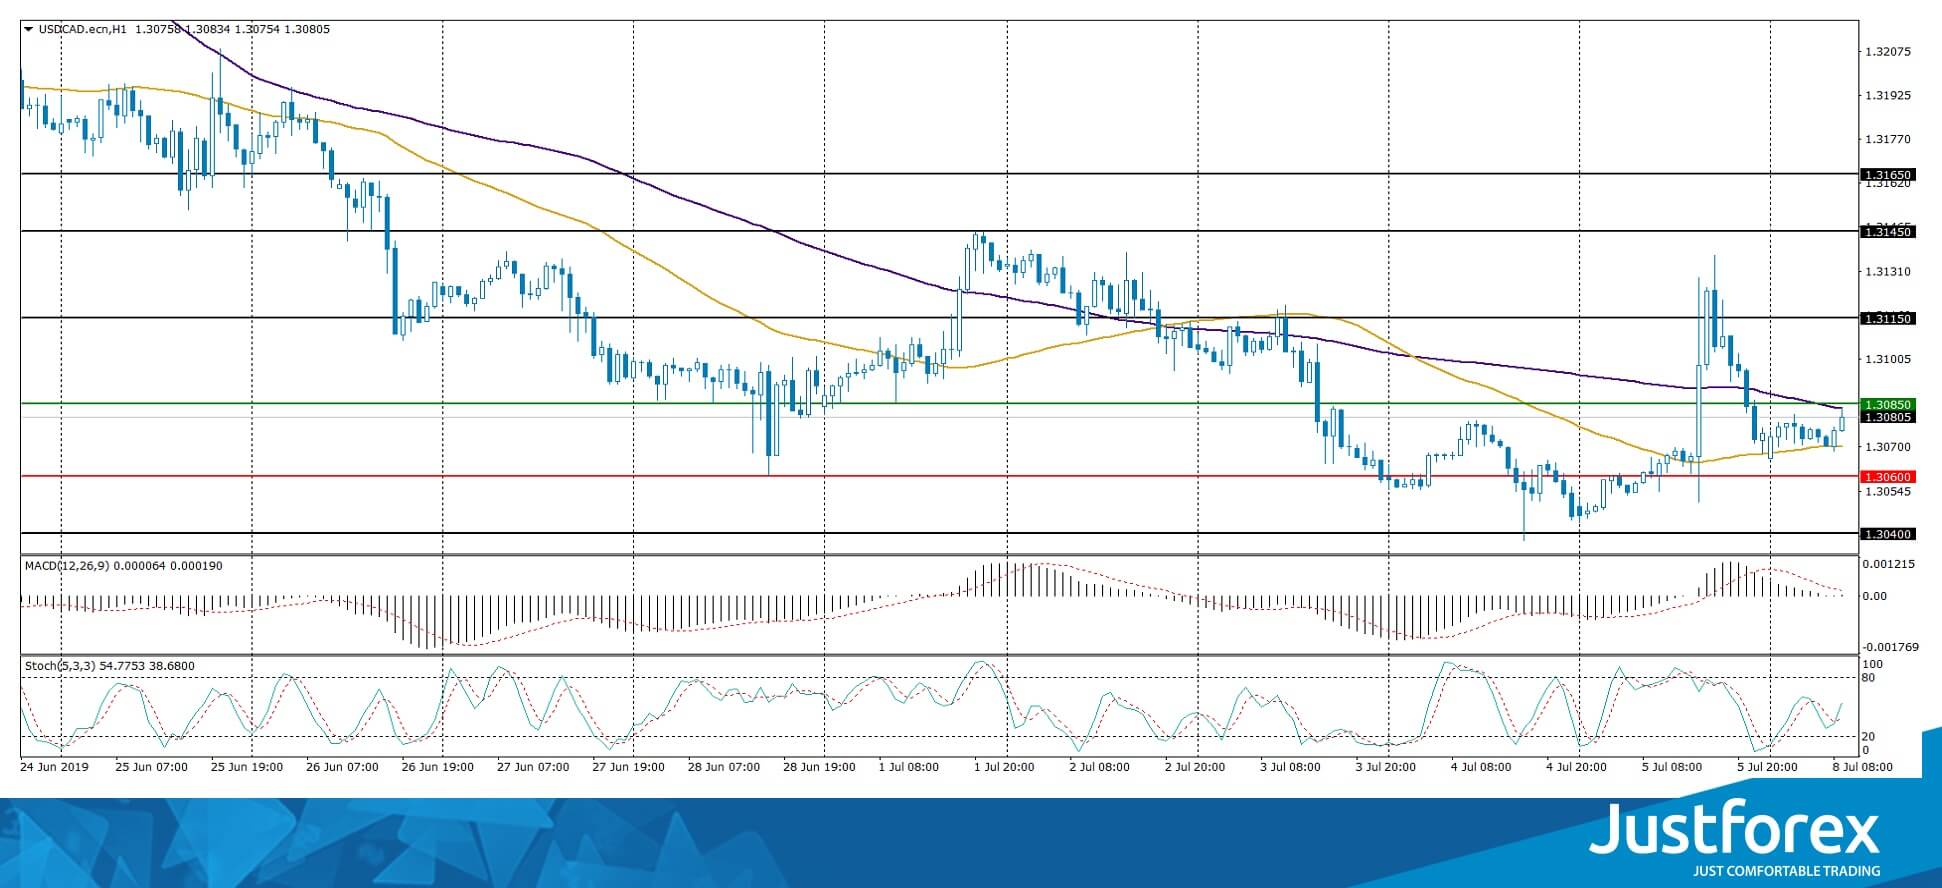
Indicators do not give accurate signals: the price crossed 50 MA and 100 MA.
The MACD histogram is located near the 0 mark.
The Stochastic Oscillator is in the neutral zone, the% K line crossed the% D line. There are no signals at the moment.
Trading recommendations
Support levels: 1.30600, 1.30400, 1.30000
Resistance levels: 1.30850, 1.31150, 1.31450
If the price consolidates above 1.30850, the quotes will grow to 1.31150-1.31400.
Alternatively, the quotes can descend to 1.30400-1.30200.
The USD/JPY currency pair
Technical indicators of the currency pair:
Prev Open: 107.811
Open: 108.435
% chg. over the last day: +0.61
Day's range: 108.280 - 108.585
52 wk range: 104.97 - 114.56
The USD/JPY currency pair has stabilized after a sharp rise during Friday's trading. At the moment, the trading instrument is consolidating. The key support and resistance levels are 108.250 and 108.600, respectively. USD/JPY quotes can grow further. Pay attention to the dynamics of the yield of US Treasury Bonds. Positions must be opened from key levels.
The Economic News Feed for 08.07.2019 is calm.
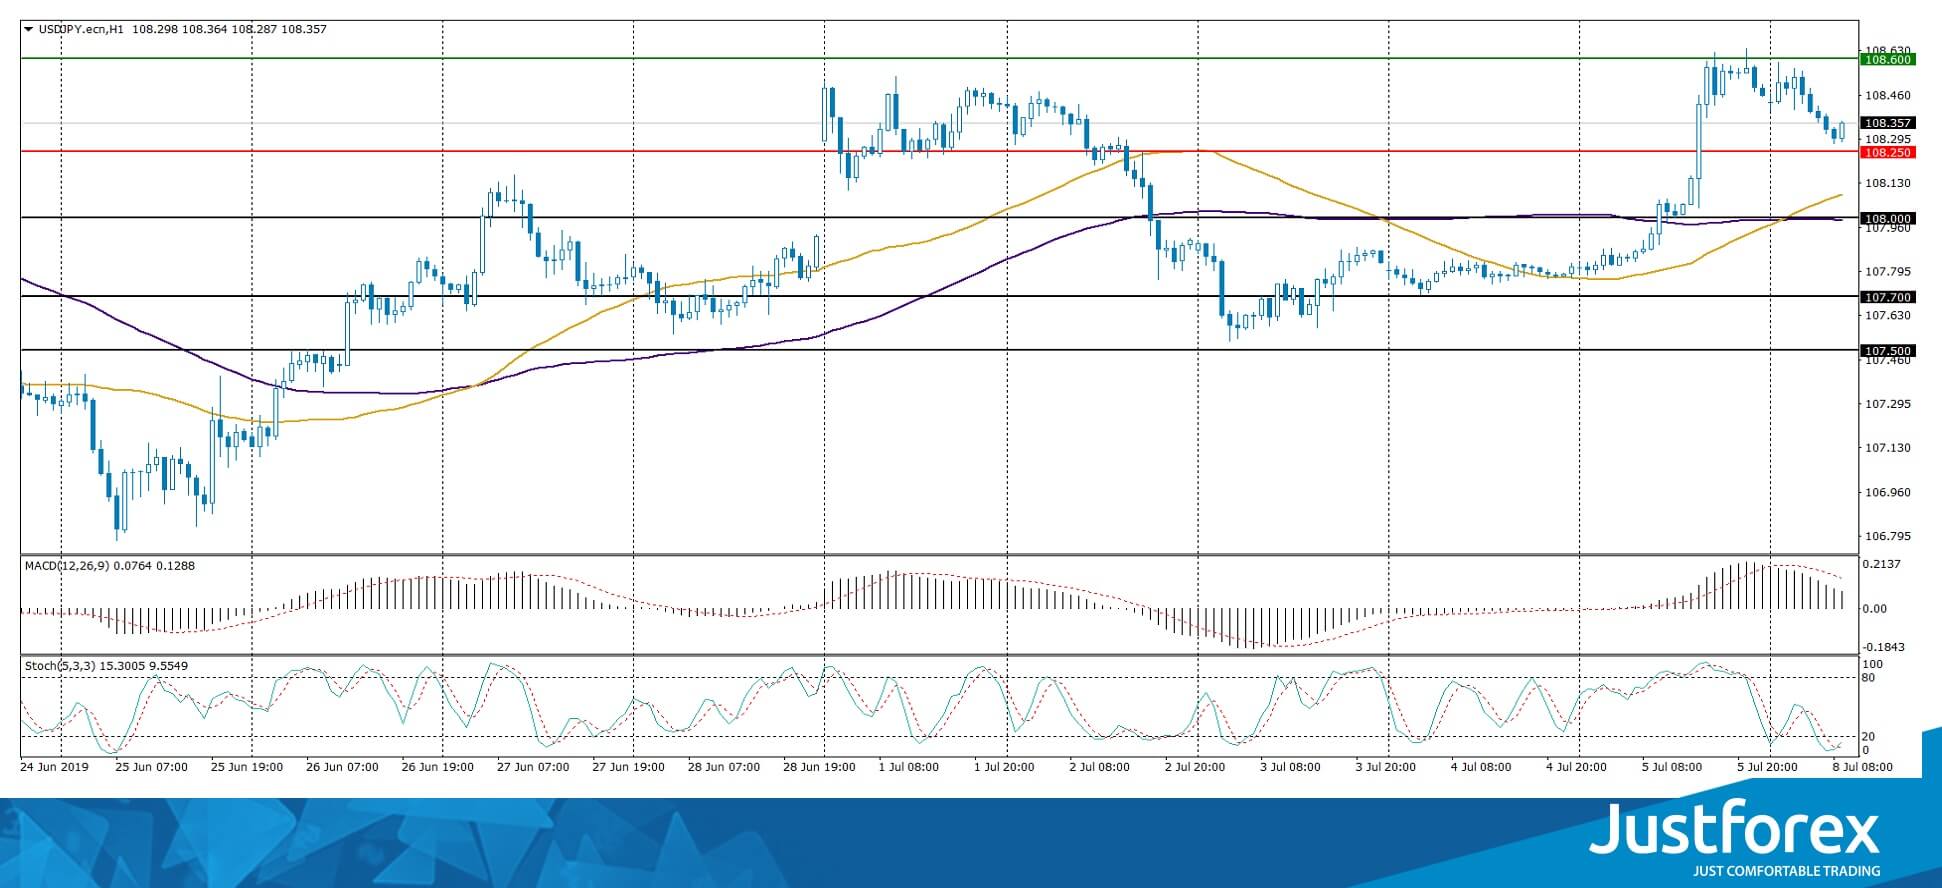
The price has fixed above 50 MA and 100 MA, which indicates the strength of buyers.
The MACD histogram is in the positive zone, but below the signal line, which gives a weak signal to buy USD/JPY.
The Stochastic Oscillator is in the oversold zone, the %K line crossed the %D line. There are no signals at the moment.
Trading recommendations
Support levels: 108.250, 108.000, 107.700
Resistance levels: 108.600, 109.000
If the price consolidates above the resistance level of 108.600, the quotes can grow to 109.000 round level.
Alternatively the quotes can fall to 108.000-107.800.
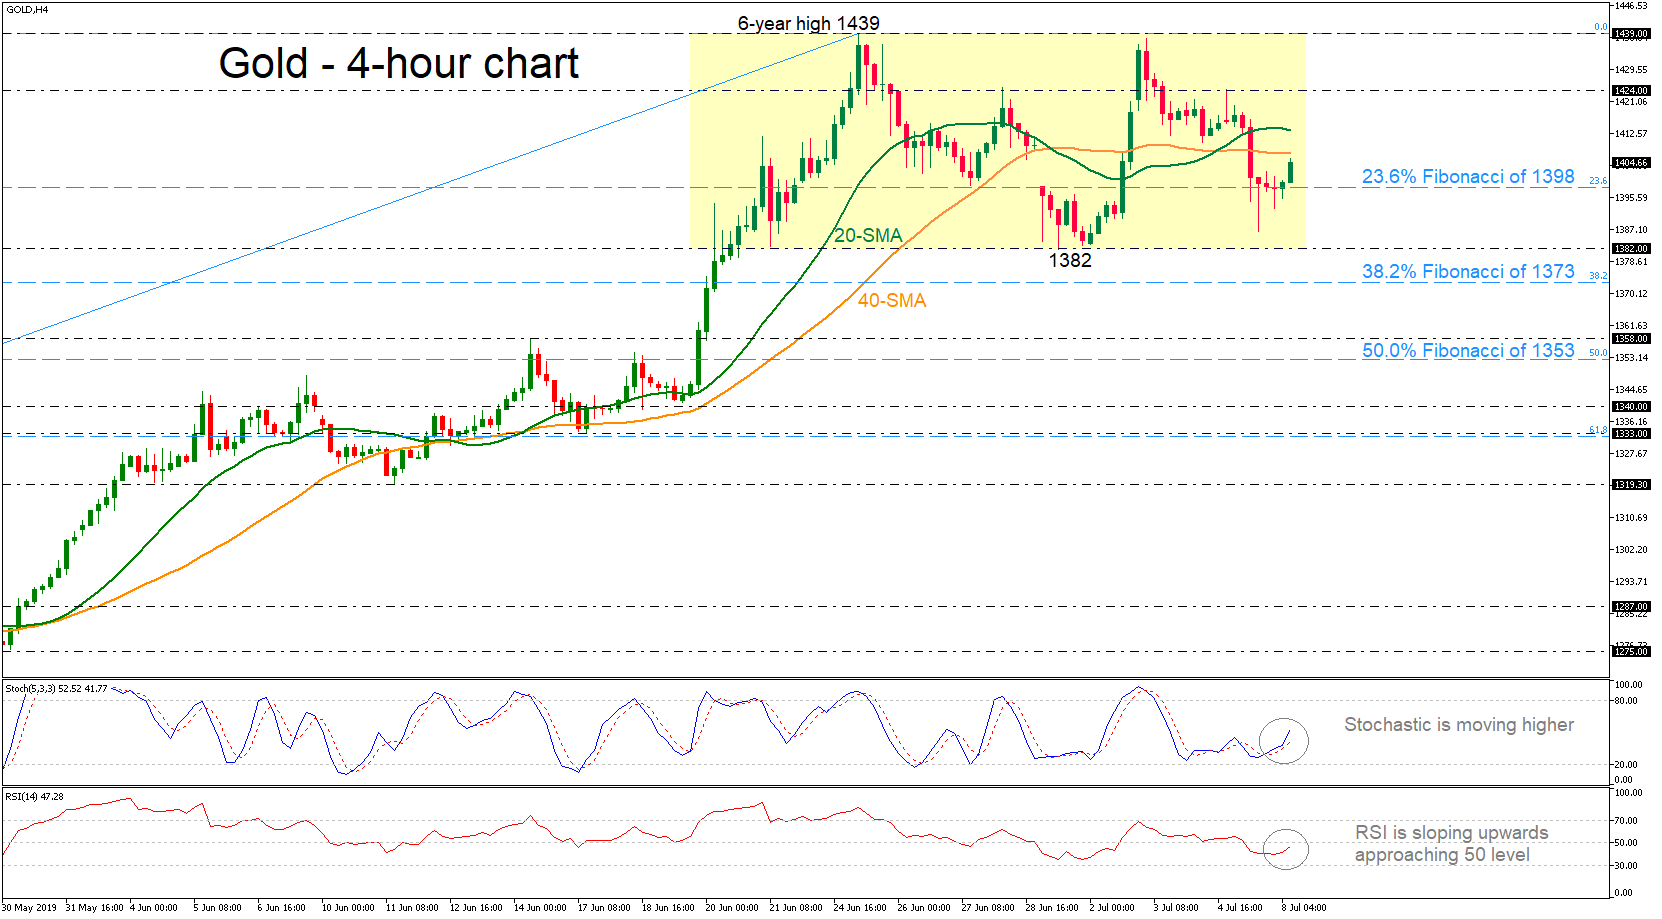
Gold Develops In Consolidation Area, Indicators Signal Bullish Move
Gold prices have been trading within a congestion area over the last two weeks with the 1,439 resistance as the upper boundary and the 1,382 support the lower boundary. Despite the sideways move, the technical indicators are suggesting an upside tendency in the 4-hour chart. The stochastic oscillator is moving higher and the RSI is sloping upwards approaching the 50 level.
In the event of an upside reversal, the 20- and 40-period simple moving averages (SMAs) could be significant obstacles for the yellow metal at 1,407 and 1,413 respectively. If there is a successful attempt to climb above these levels, the price could rest near the 1,424 resistance. A run above this level would push the yellow metal until the six-year high of 1,439.
In case of further losses below the immediate support of the 23.6% Fibonacci retracement level of the upward movement from 1,266 to 1,439, the way could open for the 1,382 area. A decrease below this significant barrier would shift the neutral bias to bearish and meet the 38.2% Fibonacci of 1,373.
Overall, for a resumption of last month’s bullish rally, gold prices would need to beat the six-year high. Alternatively, for a decline to take place, 1,382 would need to be penetrated.