Sample Category Title
USD/JPY Outlook: The Dollar Stands At The Front Foot Ahead Of US Jobs Data
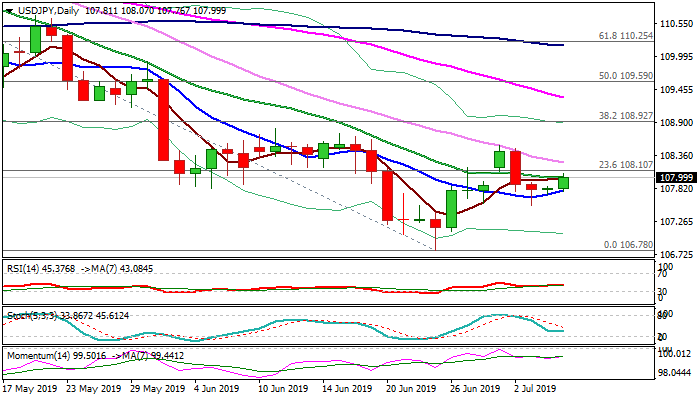
The pair regains traction and rises above 108 handle in European trading on Friday, after Wednesday's hammer and Thursday's tight Doji signaled that pullback from 108.53 is running out of steam. Studies on 4-hr chart support fresh upside, but dailies lack momentum for more significant advance that struggles to clear 20DMA (108.00) and stays away from pivotal falling 30SMA (108.24). All eyes are on US jobs data with several scenarios being on the table. Combination of strong NFP and earnings data (160K+ NFP and 0.3% AHE) is needed to lift dollar for probe above key barriers at 108.53 (1 July high) and 108.80/92 (11 June high/Fibo 38.2% of 112.40/106.78) that would generate strong bullish signal. Downbeat releases of both indicators would deflate dollar and risk extension towards key support at 106.78 (25 June low), with bearish signals also expected on weak NFP and strong earnings.
Res: 108.10, 108.24, 108.53, 108.80
Sup: 107.83, 107.53, 107.10, 106.78
US NFP, Gold And Oil
Gold
Today, all eyes are on the most important economic data, the US Non Farm. The dollar index has plunged since the Fed has changed its mind about the monetary policy. This bleeding in the dollar index has resulted in seven consecutive weeks of gain for the gold price.
The Fed pays close attention to the economic numbers, and from day one, their mantra has been dependent on this. It is in this essence that the US NFP number is really important.
As mentioned yesterday, the tone set by the US private payroll number (released on Wednesday) is negative and it is widely expected among traders that today’s number is going to provide some strong tail wind for the gold price. The word strong doesn’t mean a huge spike in the price, in fact, it means that the gold price may continue to stay above the critical level of 1400.
Market is expecting the headline number to come in at 162K, any number above 150K should send a positive message to the market. This could hurt the gold price a little but nothing major. This is because, the US NFP is just one of the reason that the Fed is determined to change the path of their monetary policy. External factors such as the on going trade war and the unrest in the Middle East are other powerful forces which are impacting the gold price. Th upward move in the gold is primarily due to this as everything is interconnected.
Remember Trump is also pushing for the dovish monetary policy for a while and he has set things in motion by electing the people in the federal Reserve who will help to shape that. So, I think the long term trend for the gold is skewed to the upside and any short term retracements in the price could provide an opportunity to join the trend.
Oil
Oil prices are down again today, the WTI price has fallen by 1.13% and Brent prices are down by 0.11%. The main reason that we have not seen any surge in the oil prices is mainly due to protectionism policies architect by President Trump. Protectionism has been the biggest denominator, in fact, this particular factor has been more dominant than the supply. This is the reason that why we have not seen any serious surge in the price despite the fact oil tankers are being attacked in the Middle East.
Any positive number out of the US, especially the US NFP number will strengthen the argument that the global growth isn’t falling off the cliff.
BoJ survey shows 83.4% of public expects prices to rise over five years
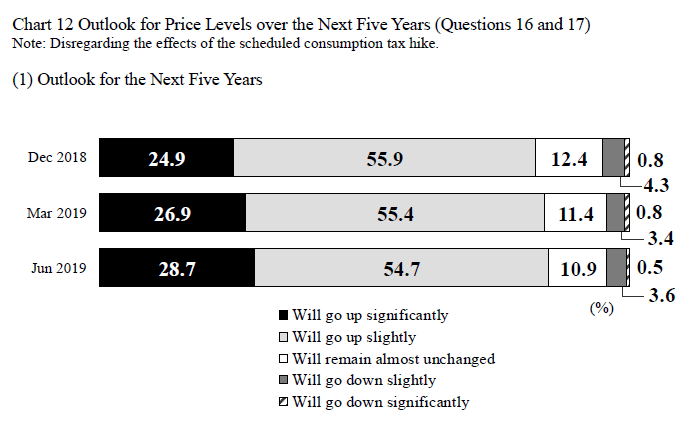
According to BoJ's Opinion Survey, 83.4% of public expects price level to go up over the next five years. That's up from 82.3% in March and was the highest since June 2016. Among them, 28.7% expects price level to go up significantly, up from 26.9%. 54.7% expects price to go up slightly, down from 54.7%.
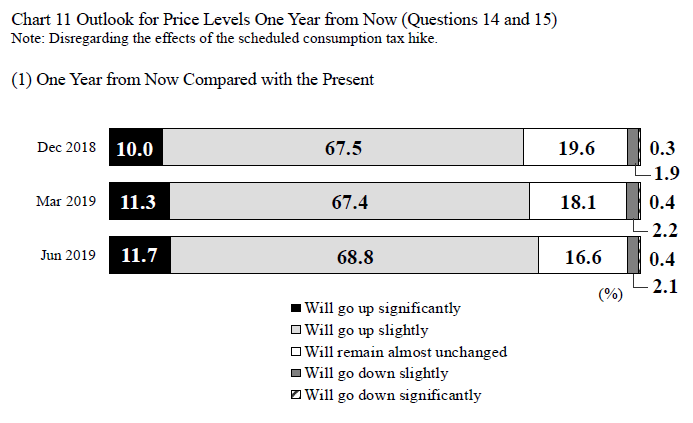
On price levels one year from now, 80.5% expects prices to go up. 11.7% expects prices to go up significantly, up from 11.3%. 68.8% expects prices to go up slightly, up fro 67.4%.
Separately, BoJ Deputy Governor Masayoshi Amamiya told a Reuters Newsmaker event today that the baseline scenario is that "economy will continue to expand moderately and gradually push up inflation to our target".
He added that "The output gap is still positive. More companies are raising prices. If this trend continues, people's perception of future price moves will change. At present, the momentum (for inflation to hit 2%) is sustained."
Though, he also warned of various downside risks. And he emphasized "if such risks hurt the economy's momentum to achieve our price target, we won't hesitate to consider easing more."
GBPJPY Is Overstretched As Indicators Suggest Bullish Bias
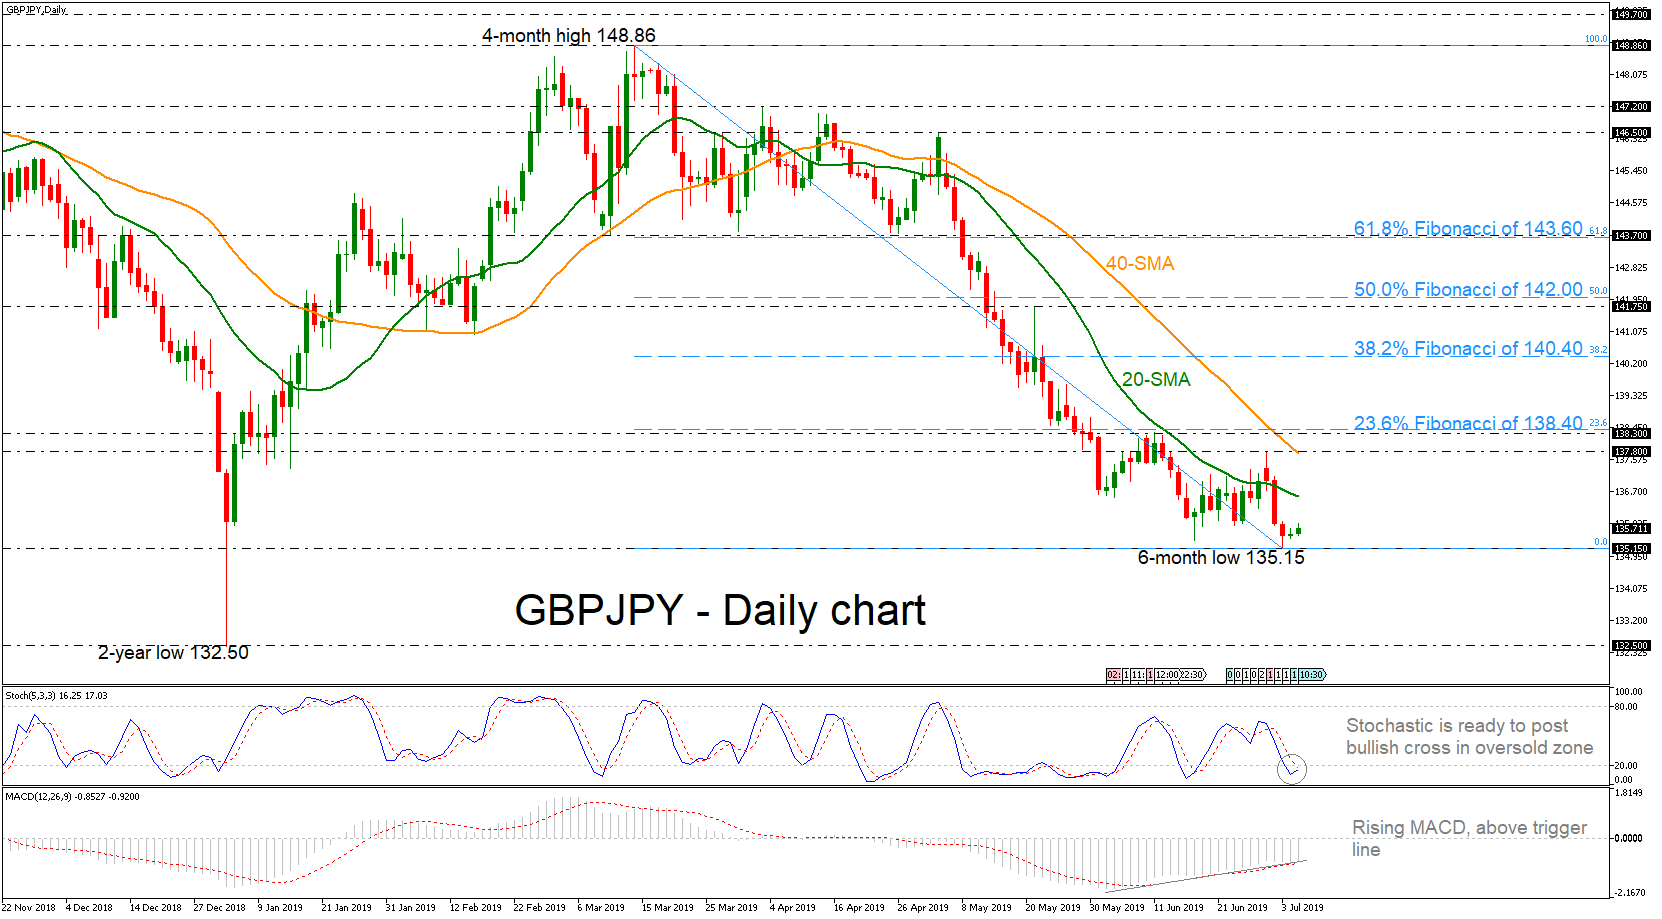
GBPJPY has been in a downward tendency over the last four months, recording a new six-month low of 135.15 in the previous days. However, the technical indicators are suggesting a potential upside movement as the %K line of the stochastic is ready to complete a bullish cross with its %D line in the oversold territory and the MACD is accelerating its positive momentum below the zero line.
If there is a successful downside penetration of the 135.15 key level, the price would flirt with the two-year low near 132.50, registered on January 3.
On the flipside, upside movements could find immediate resistance at the 20-day simple moving average (SMA) located near 136.60. More advances could lead the pair until the 40-day SMA, which coincides with the 137.80 barrier, before touching the 23.6% Fibonacci retracement level of the downfall from 148.86 to 135.15 near 138.40.
Summarizing, GBPJPY is still negative in the medium-term and traders should be waiting for a daily close below the 135.15 support for more losses. However, a climb above the short-term moving averages may switch the bias to neutral.
GBP/USD Looks To Follow Through Lower
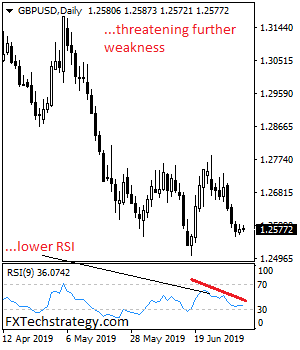
GBPUSD looks to follow through lower on further weakness in the days ahead. Support comes in at 1.2550 with a turn below that level shifting focus to the 1.2500 level. Further down, support resides at the 1.2450 level where a break will turn attention to the 1.2400 level. Further down, support lies at the 1.2350 level. Its daily RSI is bearish. On the upside, resistance stands at the 1.2650 with a turn above here allowing for additional strength to build up towards the 1.2700 level. Further out, resistance stands at the 1.2750 level followed by the 1.2800 level. On the whole, GBPUSD retains its downside pressure short term.
EUR/CAD Should Bounce While Above W L5 Camarilla
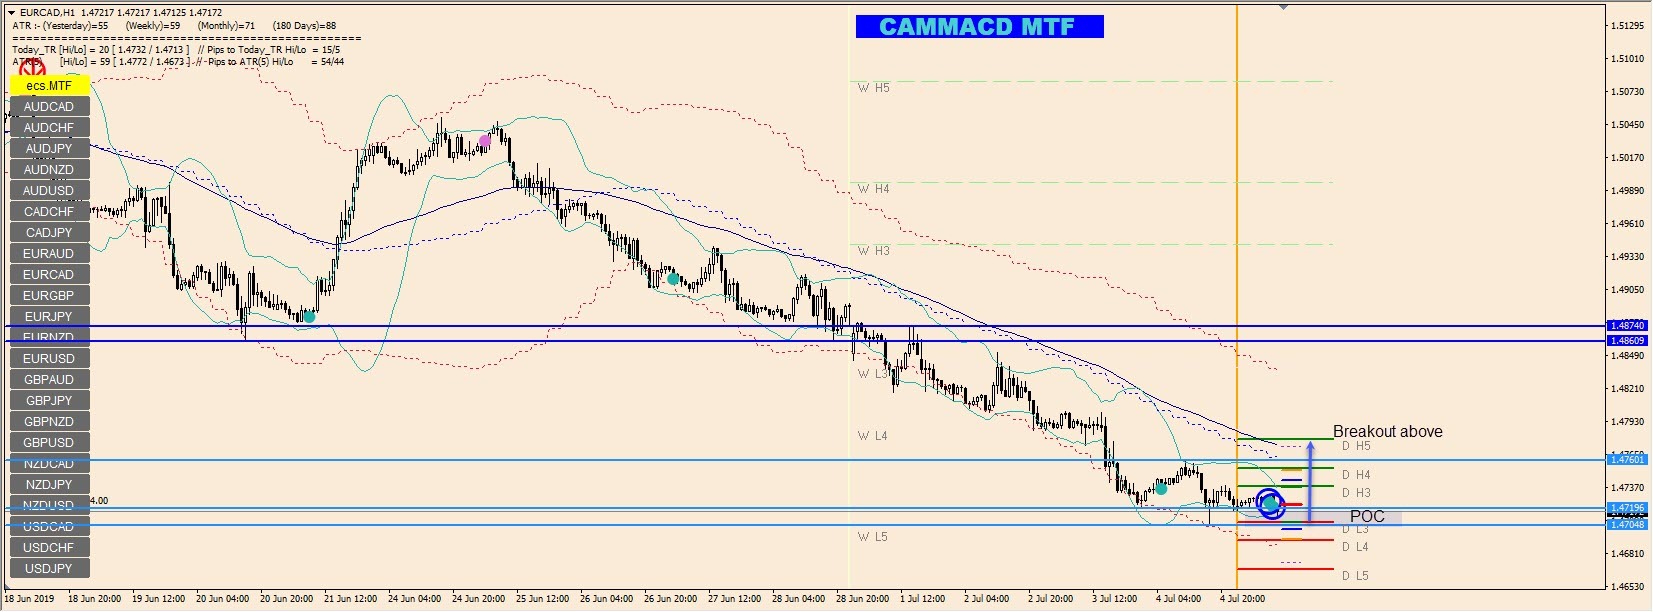
The EUR/CAD Might bounce from the POC zone as we see extremely oversold conditions and the W L5/Historical H4 zonal support.
Bullish rejection from 1.4705-15 targets upper levels, primarily 1.4760. Super-Dot ™ is a CAMMACD trademark signal where the indicator calculates overbought/oversold conditions based on different algorithms including the ATR. If bullish momentum persists, the target is 1.4760-70 zone. Breakout above should target 1.4860-74. However, we might need to wait for bigger volatility before the higher targets are achieved. However, the loss of 1.4670 will apply new bearish pressure.
The Analytical Overview Of The Main Currency Pairs
The EUR/USD currency pair
Technical indicators of the currency pair:
Prev Open: 1.12776
Open: 1.12833
% chg. over the last day: +0.07
Day's range: 1.12755– 1.12877
52 wk range: 1.1111 - 1.2009
Majors were calm yesterday and there is no defined trend yet. Trading activity and volatility were reduced due to the celebration of the US Independence Day. At the moment, EUR/USD quotes are consolidating. Financial market participants took a wait-and-see position before the publication of the report on the US labor market in June, which may affect the Fed's views on the further pace of monetary policy adjustment. The key trading range is 1.12750-1.13100. We recommend to open positions from these marks.
At 15:30 (GMT + 3: 00) we expect labor statistics in the United States.
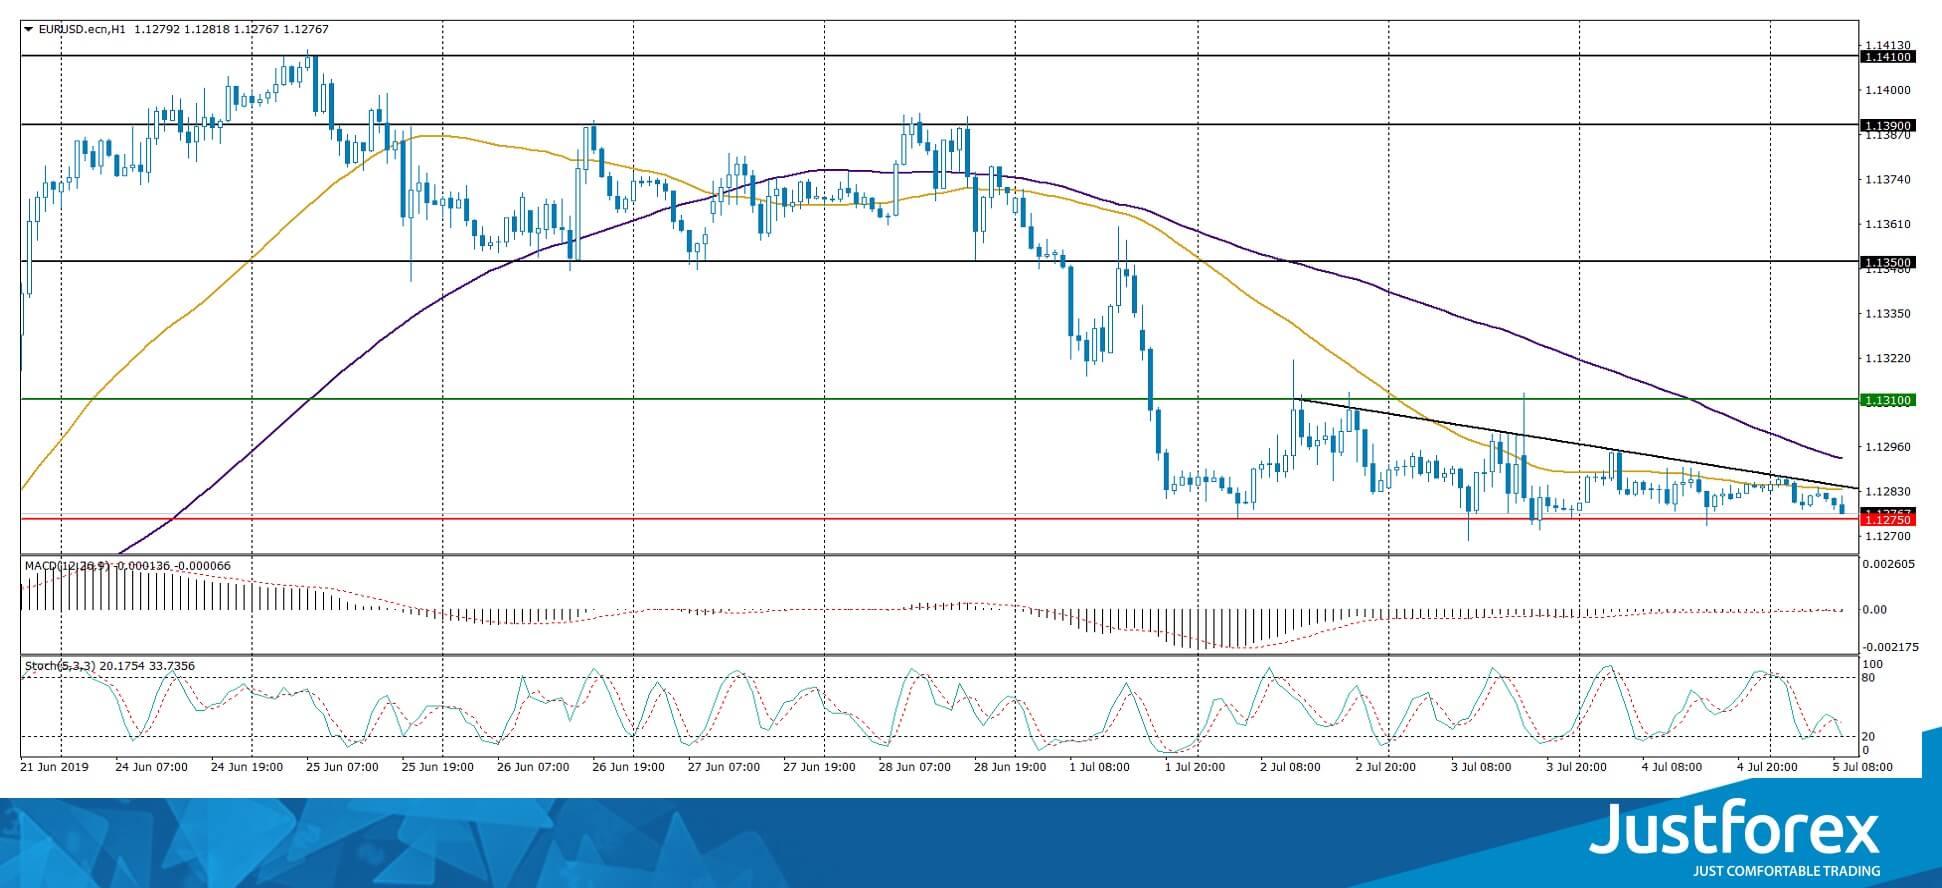
Indicators do not give accurate signals: the price crossed 50 MA.
The MACD histogram is located near the 0 mark.
Stochastic Oscillator is in the neutral zone, the %K line crossed the %D line. There are no signals at the moment.
Trading recommendations
Support levels: 1.12750, 1.12400, 1.12000
Resistance levels: 1.13100, 1.13500, 1.13900
If the price consolidates below 1.12750, the EUR/USD quotes are expected to fall to 1.12300-1.12000.
An alternative could be the growth of the EUR/USD currency pair to 1.13500-1.13800.
The GBP/USD currency pair
Technical indicators of the currency pair:
Prev Open: 1.25647
Open: 1.25763
% chg. over the last day: +0.08
Day's range: 1.25735 - 1.25848
52 wk range: 1.2438 - 1.3631
The technical picture on the GBP/USD currency pair is still ambiguous. Sterling is in lateral movement. The key support and resistance levels are: 1.25600 and 1.26000, respectively. Investors expect US labor statistics for June. We recommend to pay attention to the difference between the actual and predicted values of the indicators. Positions must be opened from key levels.
The Economic News Feed for 05.07.2019 is calm.
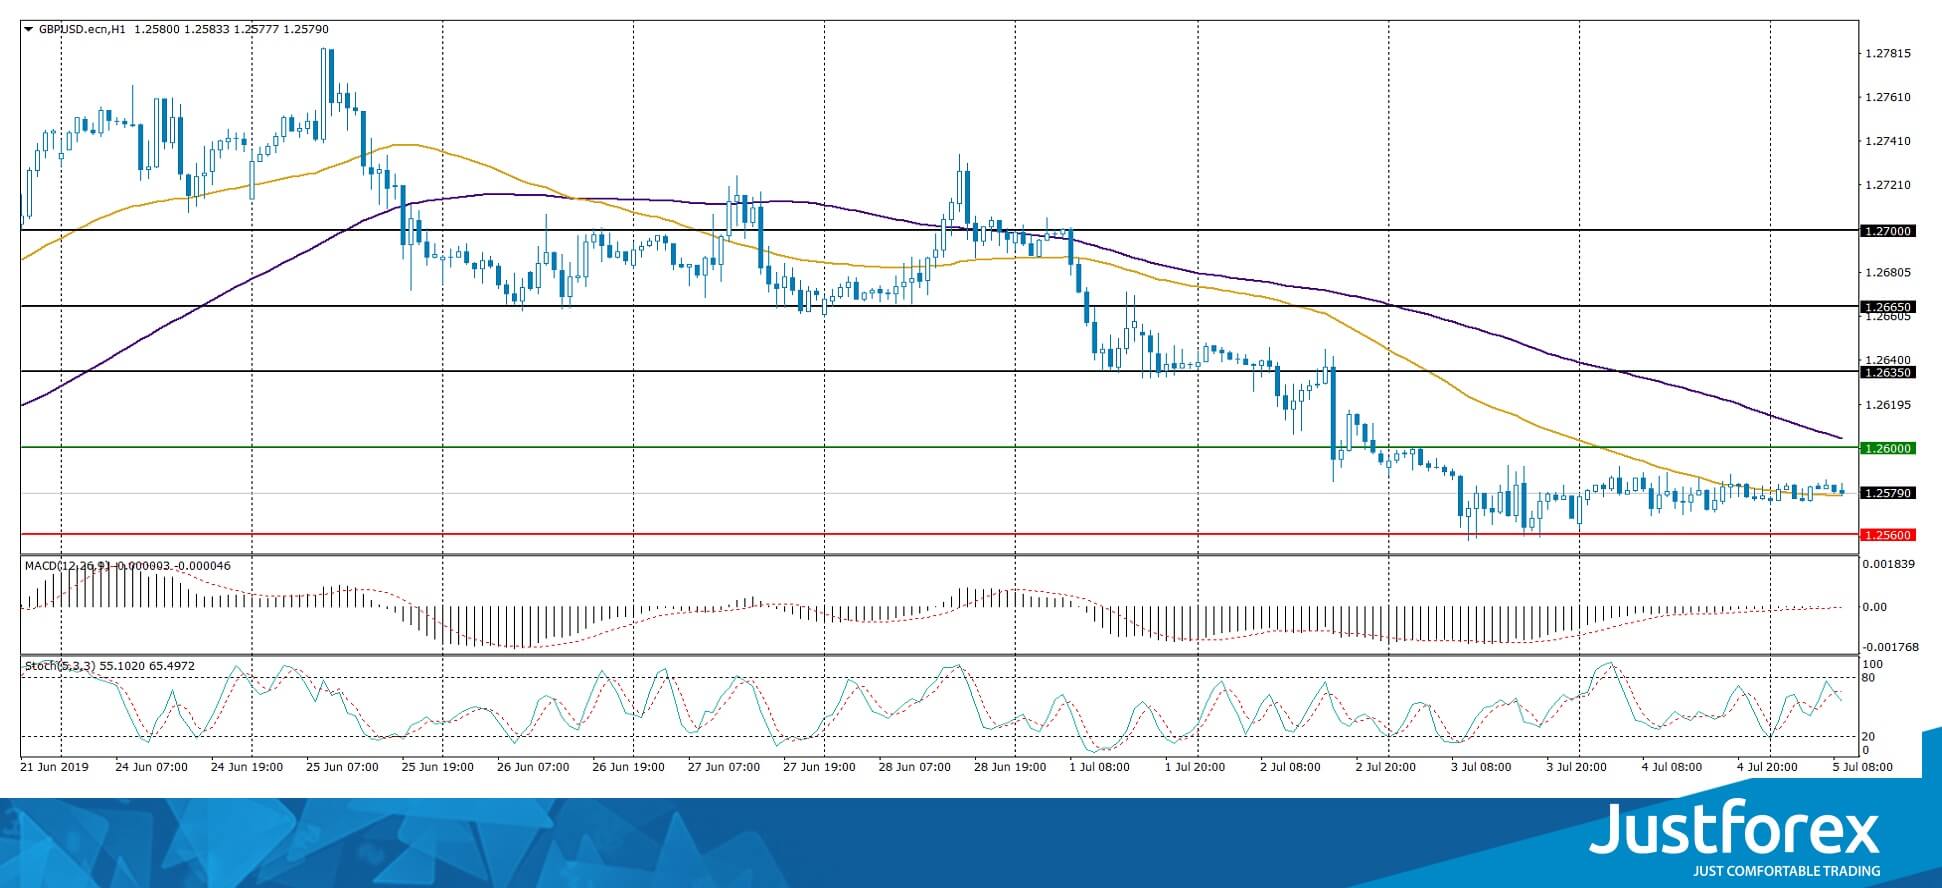
Indicators do not give accurate signals: the price crossed 50 MA.
The MACD histogram is near the 0 mark.
The Stochastic Oscillator is in the neutral zone, the% K line crossed the% D line. At the moment, there are no accurate signals.
Trading recommendations
Support levels: 1.25600, 1.25300, 1.25000
Resistance levels: 1.26000, 1.26350, 1.26650
If the price consolidates below 1.25600, the quotes can drop to 1.25300-1.25000.
Alternatively the quotes can grow toward 1.26400-1.26600.
The USD/CAD currency pair
Technical indicators of the currency pair:
Prev Open: 1.30595
Open: 1.30492
% chg. over the last day: -0.06
Day's range: 1.30438 - 1.30665
52 wk range: 1.2727 - 1.3664
The USD/CAD has stabilized after a long fall. CAD is trading in a flat, the following key support and resistance levels can be identified: 1.30400 and 1.30800, respectively. USD/CAD quotes are likely recover. Investors expect labor market reports in the US and Canada. We also recommend to pay attention to the dynamics of oil prices. Positions must be opened from key levels.
At 15:30 (GMT + 3: 00) statistics on the labor market of Canada will be published.
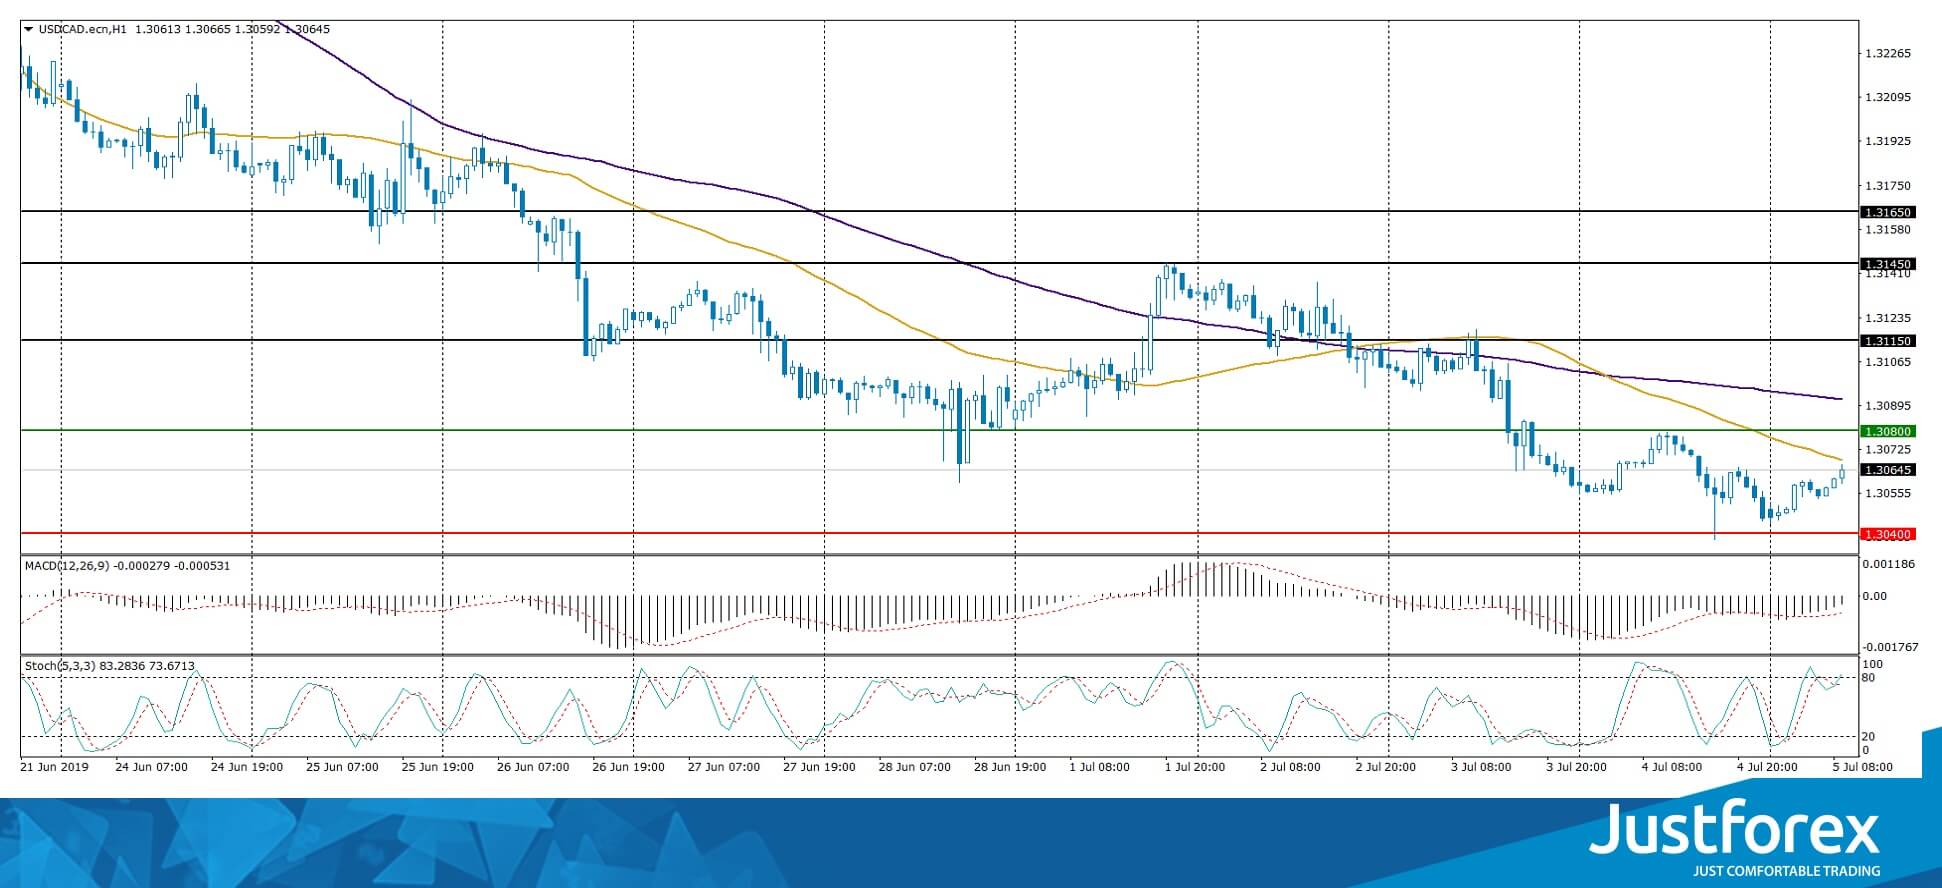
Indicators do not give accurate signals: the price is close to 50 MA, which at the moment is a strong dynamic resistance.
The MACD histogram is in the negative zone, but above the signal line, which gives a weak signal to sell USD/CAD.
The Stochastic Oscillator is near the overbought zone, the% K line crossed the% D line. There are no signals at the moment.
Trading recommendations
Support levels: 1.30400, 1.30000
Resistance levels: 1.30800, 1.31150, 1.31450
If the price consolidates above 1.30800, correction to 1.31150-1.31400 is expected.
An alternative could be a further fall to the round level of 1.30000.
The USD/JPY currency pair
Technical indicators of the currency pair:
Prev Open: 107.798
Open: 107.811
% chg. over the last day: +0.02
Day's range: 107.781 - 107.946
52 wk range: 104.97 - 114.56
The safe haven currency continues to consolidate. Unidirectional trend is not observed. The focus of the report on the US labor market in June. Currently, the local support and resistance levels are 107.700 and 108.000, respectively. We also recommend paying attention to the dynamics of the yield of US government securities. Positions must be opened from key levels.
The Economic News Feed for 05.07.2019 is calm.
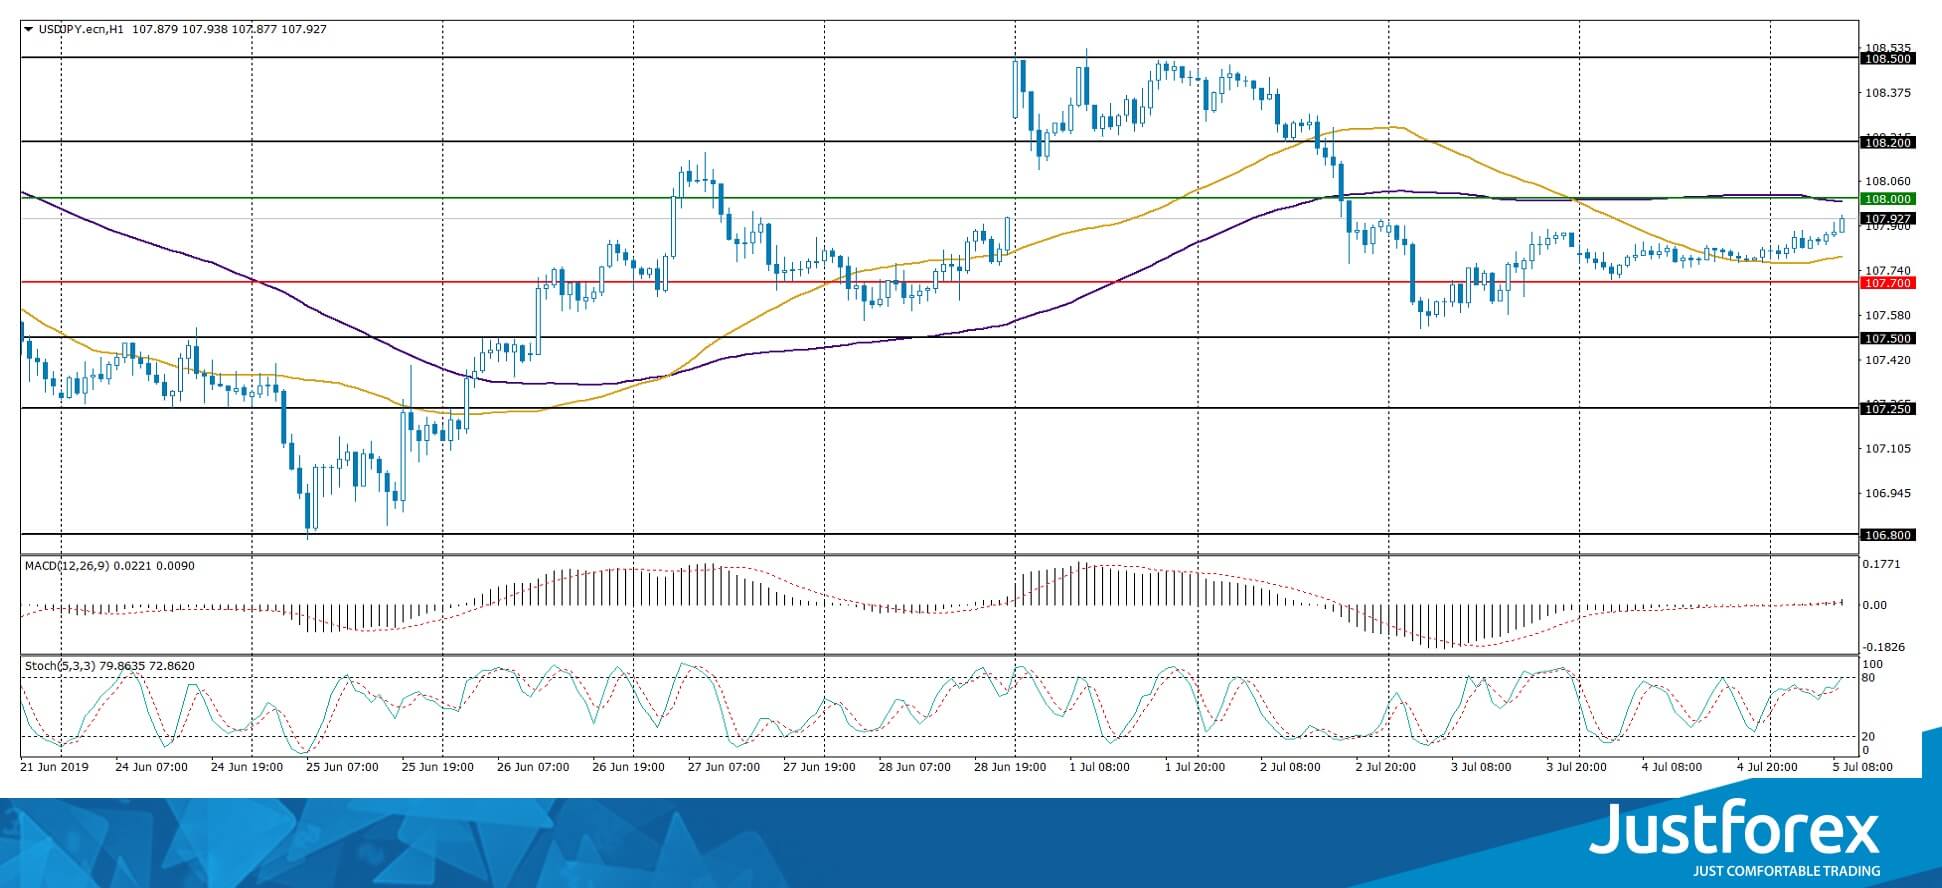
Indicators do not give accurate signals: the price is fixed between 50 MA and 100 MA.
The MACD histogram is near 0.
The Stochastic Oscillator is in the neutral zone, the %K line is above the %D line, which indicates bullish moods.
Trading recommendations
Support levels: 107.700, 107.500, 107.250
Resistance levels: 108.000, 108.200, 108.500
If the price consolidates below 107.700, the quotes are expected to fall to 107.400-107.200.
An alternative could be the growth of the USD / JPY currency pair to 108.400-108.600.
US Payrolls Could Decide How Deep Fed Cuts In July
- US employment data today will be crucial for Fed rate-cut expectations and the dollar
- Canadian jobs figures also due, as loonie touches new 2019 high
- In Europe, bond markets continue to price in QE, but euro snoozes
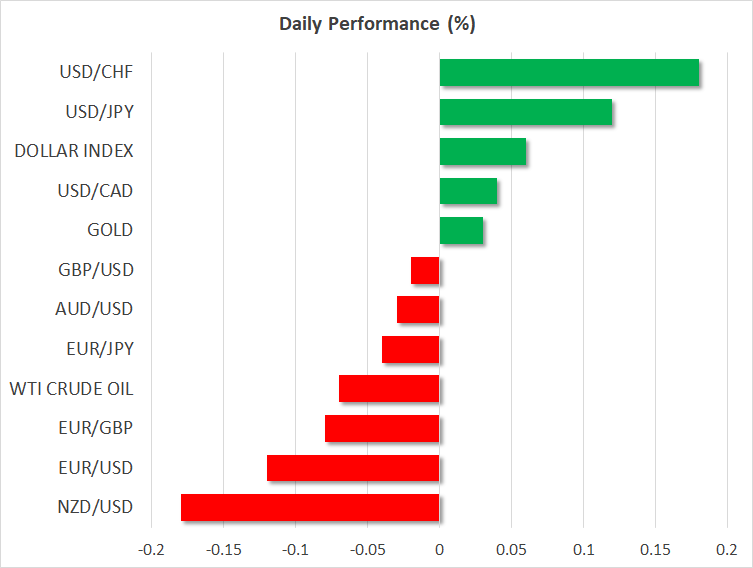
US payrolls may dictate how deep Fed cuts in July and dollar's path
After a relatively quiet session on Thursday, the spotlight will fall on the US employment data today. Markets are still pricing in a ~25% probability for a ‘double' rate cut of 50 basis points at the next Fed meeting, so any significant surprises in these data could be crucial in shaping expectations for that event, and by extension for the dollar.
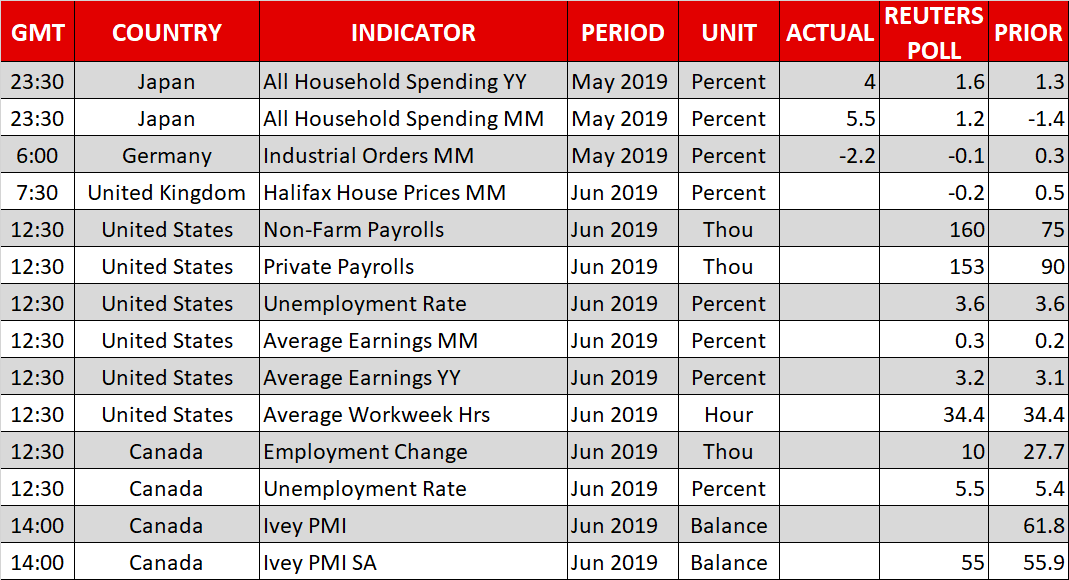
Forecasts point to a solid report overall, with nonfarm payrolls expected at 160k in June, the unemployment rate to hold steady at a 3.6%, and average hourly earnings to accelerate slightly to 3.2% in yearly terms from 3.1% earlier. If the actual prints meet expectations, that would likely calm some nerves about a weakening labor market and thereby prompt investors to trim some of their Fed easing bets, lifting the dollar but pushing stocks lower.
Even in this case though, any relief rally in the greenback – and any retreat in equities – may prove relatively short lived. The bigger picture remains that of a weakening dollar if central banks indeed start easing as aggressively as markets expect, by virtue of the Fed having much more room to cut rates than any of its peers. In this environment, an outperformer may be the yen, as the BoJ already has in place the most aggressive stimulus program globally, and therefore has almost no space to ease further.
Canadian jobs data also due, as loonie soars to year highs
Canada's jobs figures for June will hit the markets at the same time as the American prints. Expectations are for a relatively soft set of data, with the unemployment rate forecast to tick up to 5.5% from a four-decade low of 5.4%, and the net change in employment to decline, but remain in positive territory.
While a weak batch of data may hurt the loonie on the news, keep in mind that the jobs market has been on a tear, so one soft month after such a strong streak seems natural. Indeed, the Canadian economy has been an oasis of strength lately, which means the BoC may be among the few major central banks that won't cut rates soon – perhaps alongside the Bank of England. The bottom line is that as long as the Fed-BoC policy divergence narrative holds, the broader outlook for the loonie remains bright. The loonie has also been the best-performing G10 currency year-to-date; up by more than 4% versus the greenback.
Euro snoozes even as bond markets price in ferocious QE
The main story yesterday was that the yield on German 10-year bonds fell below the ECB's deposit rate of -0.40% for the first time. While the move didn't carry through into the FX arena, with the euro trading mostly flat, it still highlights that investors are snatching up all the European bonds they can find, confident that incoming ECB President Christine Lagarde will not hesitate to hit the QE button when the time comes.
The key reason the euro has not moved in the face of falling European interest rates, is that US rates have collapsed by even more lately, narrowing the spread in Europe's favor. In this sense, relative rate differentials argue for a higher euro/dollar in the longer-term, if both the Fed and ECB bring out the monetary ‘bazookas' again.
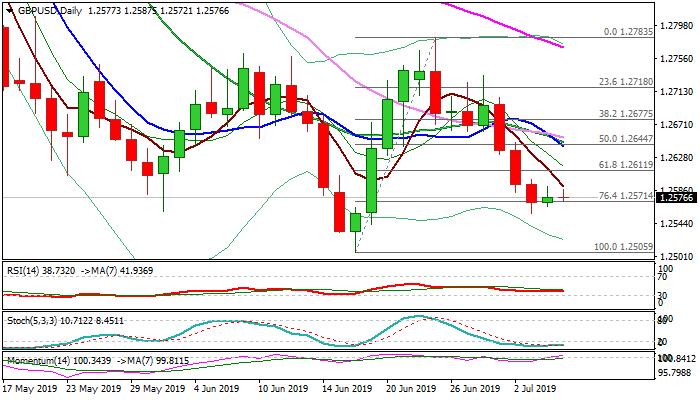
GBP/USD Outlook: Fall Through 1.2500 Or Rise Above 1.2650 Possible Scenarios After US NFP Data
Bears remain on hold, as Thursday’s Doji after three-day fall and early Friday’s action in narrow range, signal indecision, with mixed daily studies supporting scenario.
The pair is looking for fresh signal from US NFP data, which could inflate sterling towards 1.2650/1.2700 zone if today’s release falls well below expectations that would increase risk of Fed rate cut by 0.5% in July’s policy meeting.
On the other side, strong NFP beat would inflate dollar and risk test of cable’s key support at 1.2505 (18 June low).
Res: 1.2590, 1.2644, 1.2654, 1.2677
Sup: 1.2556, 1.2542, 1.2505, 1.2476
Gold Prices Hold Steady Near Highs
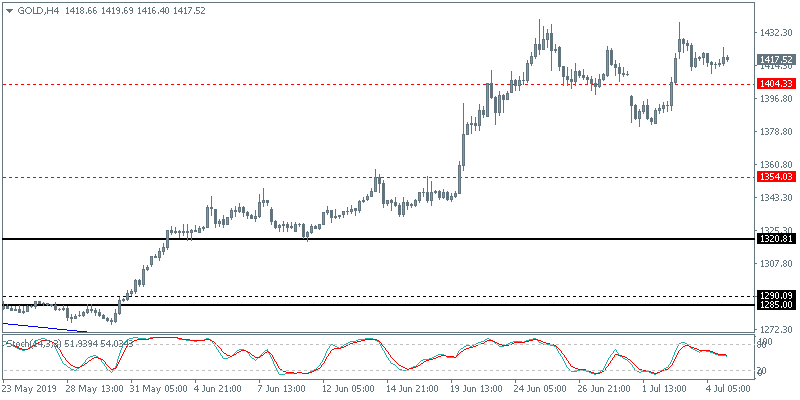
The precious metal was traded a bit volatile near the highs on Thursday. Price action was rather muted as gold traders await the payrolls report due later today. A weaker payrolls report could potentially cement expectations of a July rate cut. This comes following the ADP private payrolls once again falling short of expectations. The pace of hiring was also somewhat slower compared to the previous months.
Will Gold Breakout Higher?
Given the current set up, gold prices are likely to see a breakout in either direction. To the upside, price will need to breach past the recent highs of 1431 in order to confirm the upside bias. There is a cup and handle type of pattern forming near the current highs that validates this view. To the downside, if the 1404 level of support gives way, then gold could extend declines to1354.