Sample Category Title
EUR/CHF Daily Outlook
Daily Pivots: (S1) 1.1106; (P) 1.1122; (R1) 1.1134; More...
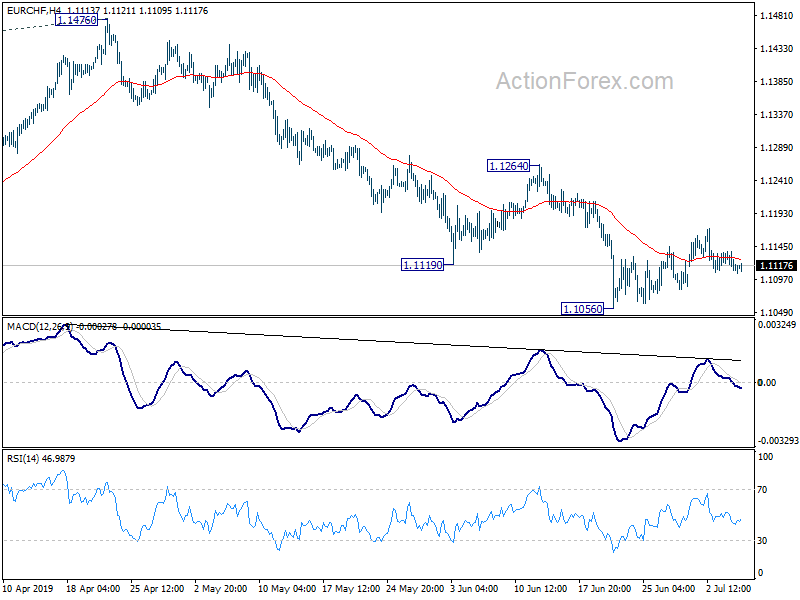
Intraday bias in EUR/CHF remains neutral as consolidation from 1.1056 is still in progress. Another recovery cannot be ruled out. But upside should be limited below 1.1264 resistance to bring fall resumption. On the downside, break of 1.1056 will extend the larger down trend for 61.8% projection of 1.2004 to 1.1173 from 1.1476 at 1.0962 next.
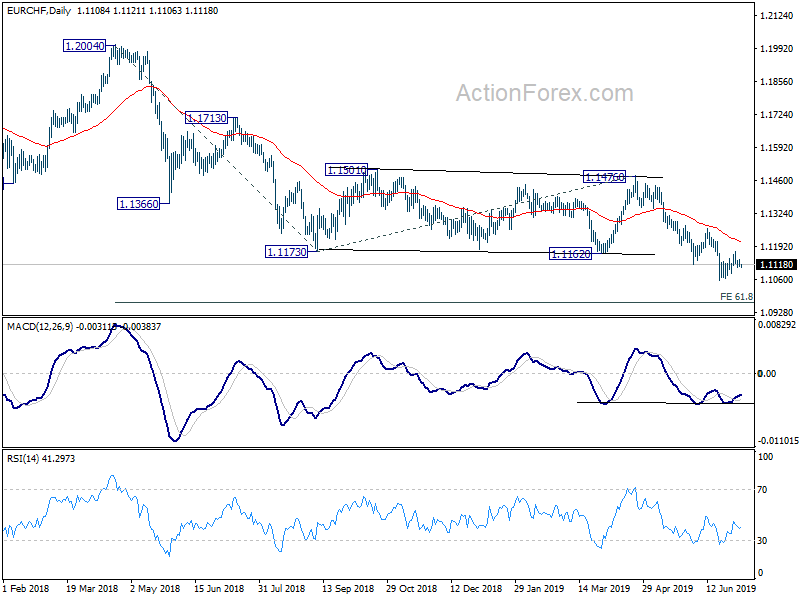
In the bigger picture, current development firstly suggests that down trend from 1.2004 is still in progress. More importantly, it's likely a long term down trend itself, rather than a correction. Outlook will remain bearish as long as 1.1476 resistance holds. EUR/CHF could target 1.0629 support and below.
GBP/USD Key Resistance At 1.2590
Pivot (invalidation): 1.2590
Our preference Short positions below 1.2590 with targets at 1.2570 & 1.2555 in extension.
Alternative scenario Above 1.2590 look for further upside with 1.2615 & 1.2640 as targets.
Comment A break below 1.2570 would trigger a drop towards 1.2555.

EUR/USD Watch 1.1255
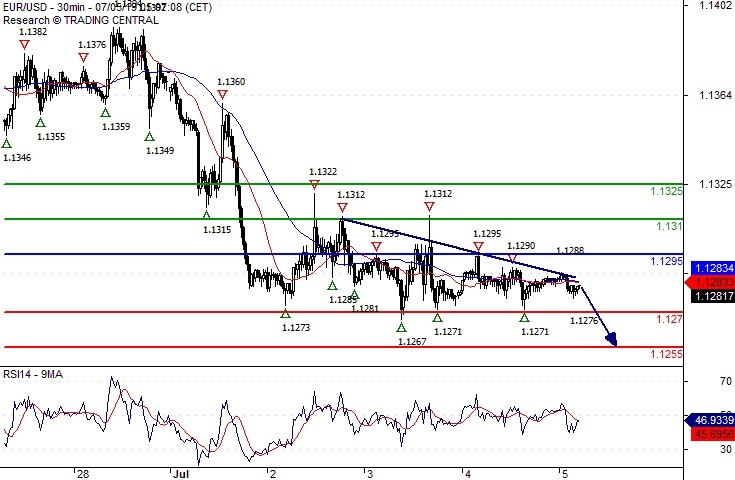
Pivot (invalidation): 1.1295
Our preference Short positions below 1.1295 with targets at 1.1270 & 1.1255 in extension.
Alternative scenario Above 1.1295 look for further upside with 1.1310 & 1.1325 as targets.
Comment The RSI calls for a drop.
USDCAD Creates Some Pullback Near 7-Month Low
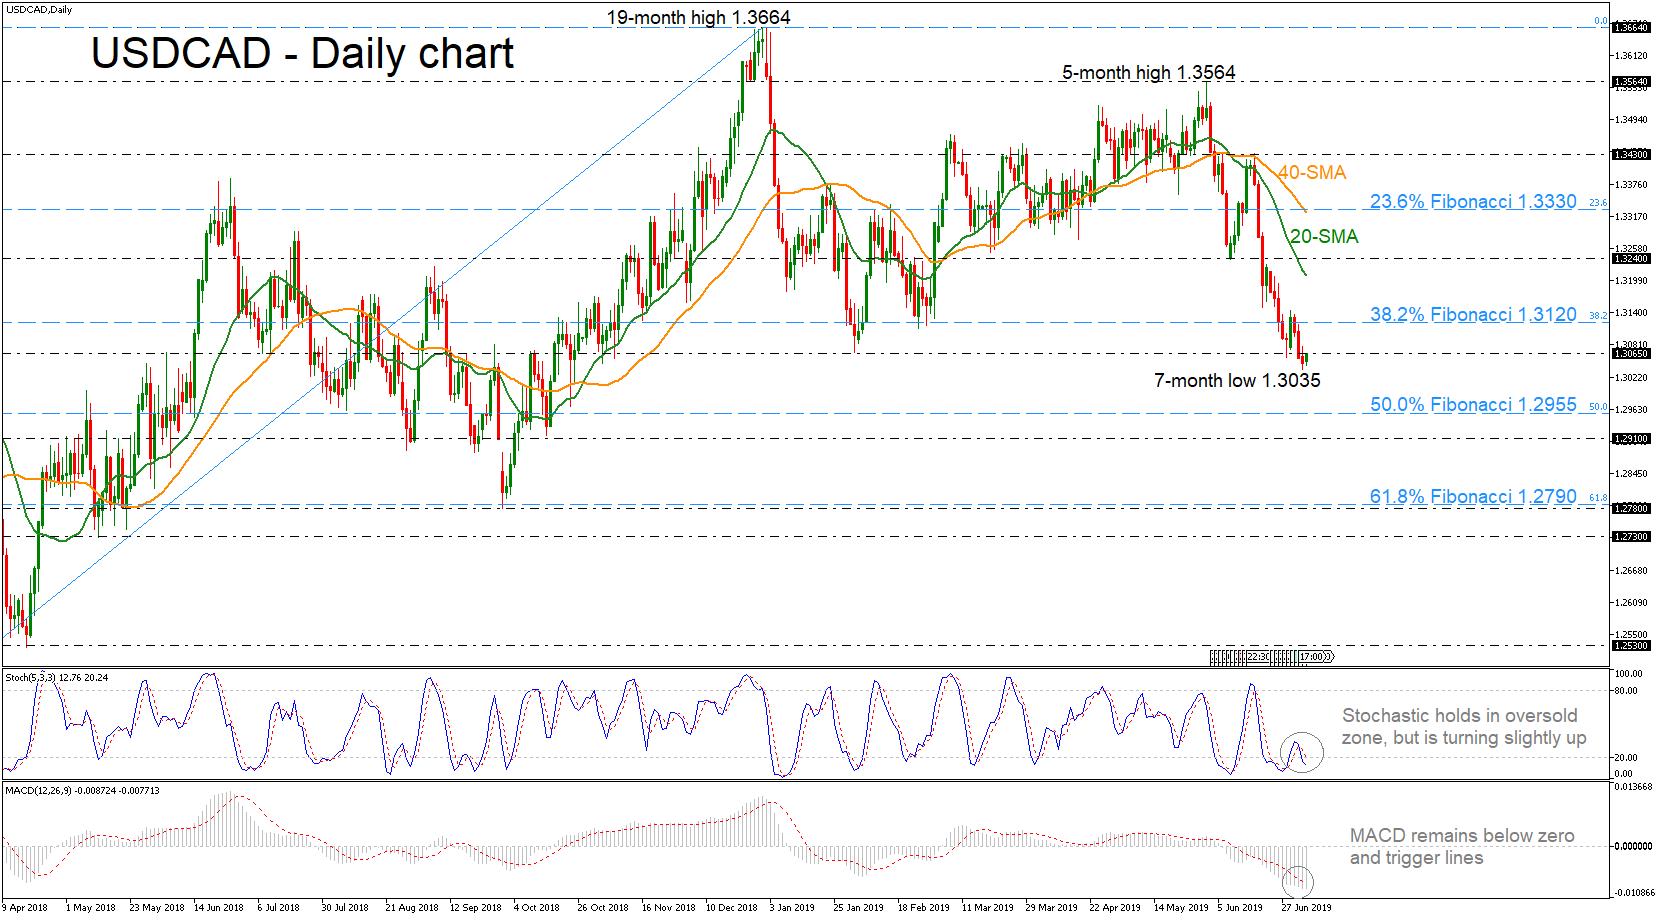
USDCAD has come under renewed selling pressure following the bounce off the 1.3430 resistance level and the 40-simple moving average (SMA). Despite the latest pullback though, the pair continues to post fresh lows, hitting a seven-month trough around 1.3035.
Looking at momentum oscillators on the daily chart though, they suggest further declines may be on the cards in the short-term. The stochastic is still developing in the oversold territory but it seems ready to turn higher, suggesting an overstretched market. The MACD remains in the negative zone below trigger and zero lines but it is weakening its momentum.
Should prices decline further, immediate support could be found around the 50.0% Fibonacci retracement level of the upleg from 1.2250 to 1.3664 near 1.2955. Then a leg below that level, the pair could meet the 1.2910 support, taken from the low on October 2018, before the focus shifts to the 61.8% Fibonacci of 1.2790.
However, if the market manages to pick up speed and surpass the 1.3065 immediate resistance, the 38.2% Fibo of 1.3120 could offer nearby obstacle ahead of the 20-SMA currently at 1.3207. A significant close above the latter would push the price until the 1.3240 barrier, identified by the inside swing bottom on June 10.
In the short-term, the bias remains negative since the price holds well below the moving averages, but in the bigger view USDCAD is still developing in an ascending movement. If there is a drop beneath the 61.8% Fibonacci, this would shift the outlook to bearish.
GBPUSD Make Or Break
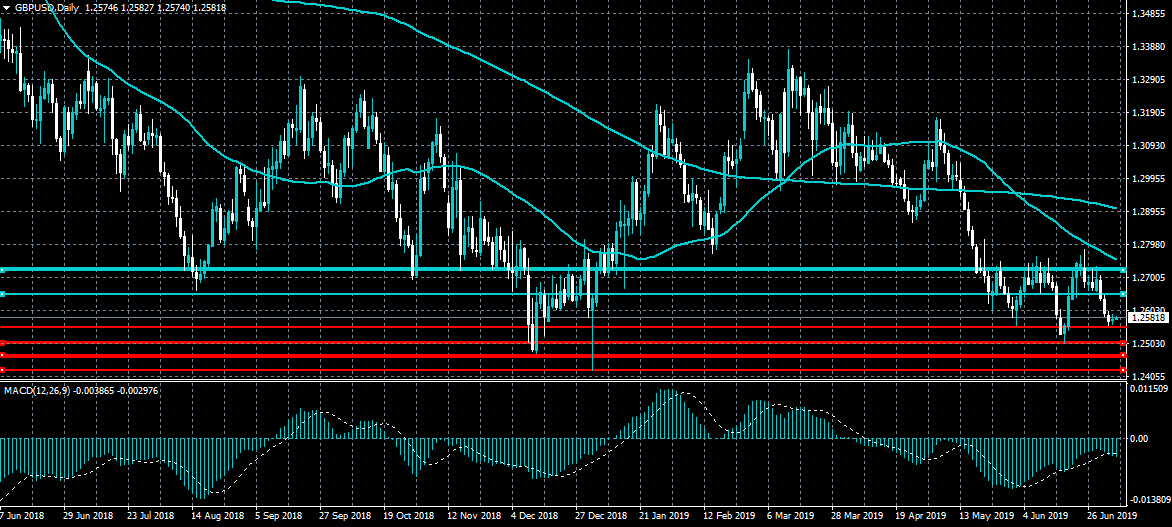
The British pound has an important trading day ahead against the US dollar, with the pair trading at a critical juncture over the medium-term. A better than expected jobs number today is likely to prompt a test of the current 2019 trading low, at 1.2505. Technically, the multi-year trading year at 1.2424 remains the most important level to watch if the 1.2505 level is breached.
The GBPUSD pair is bearish while trading below the 1.2610 level, key support is found at the 1.2505 and 1.2424 levels.
GBPUSD pair is only bullish while trading above the 1.2610 level, key resistance is found at the 1.2660 and 1.2710 levels.
AUD/USD Daily Outlook
Daily Pivots: (S1) 0.7010; (P) 0.7029; (R1) 0.7042; More...
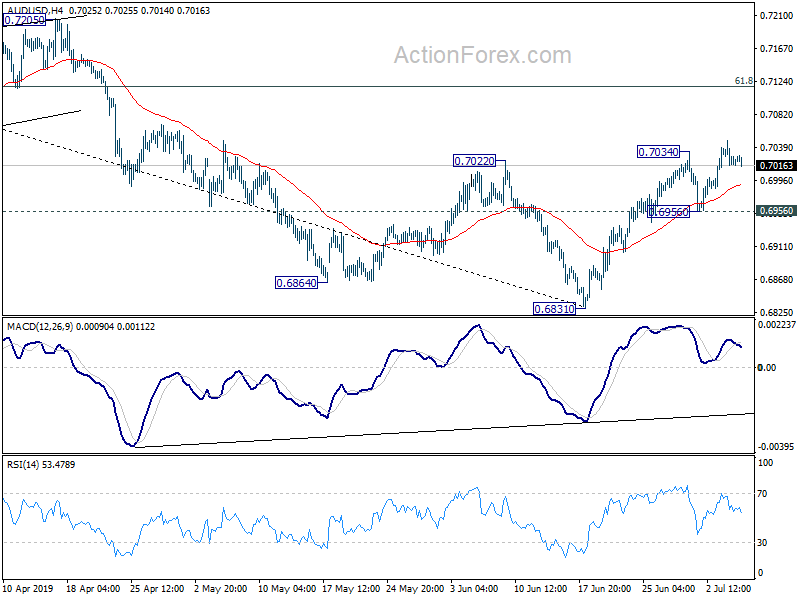
AUD/USD is losing upside momentum again as seen in 4 hour MACD. But further rise is expected as long as 0.6956 support holds. Rebound from 0.6831 could extend to 61.8% retracement of 0.7295 to 0.6831 at 0.7118 first. Sustained break till target 0.7295 resistance next. On the downside, break of 0.6956 support, however, will indicate completion of the rebound. Intraday bias will be turned back to the downside for retesting 0.6831 low.
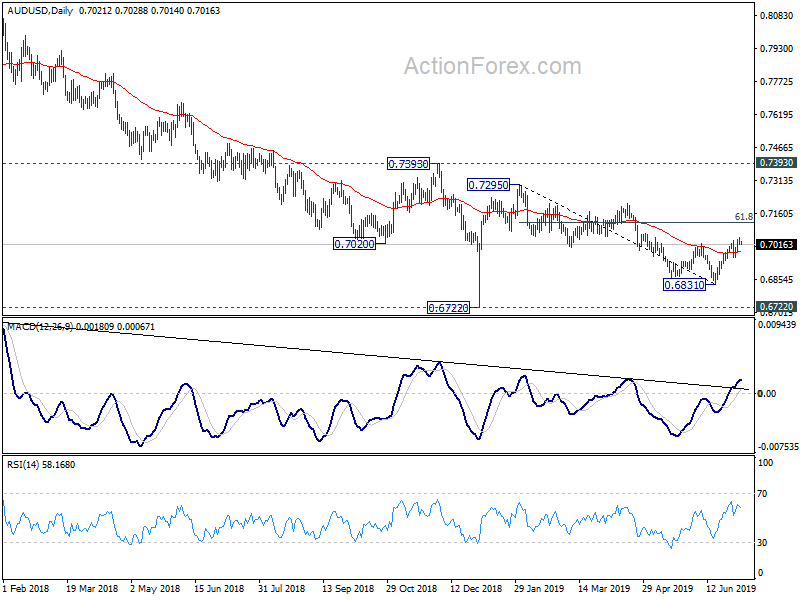
In the bigger picture, with 0.7393 key resistance intact, medium term outlook remains bearish. The decline from 0.8135 (2018 high) is seen as resuming long term down trend from 1.1079 (2011 high). Decisive break of 0.6826 (2016 low) will confirm this bearish view and resume the down trend to 0.6008 (2008 low). However, firm break of 0.7393 will argue that fall from 0.8135 has completed. And corrective pattern from 0.6826 has started the third leg, targeting 0.8135 again.
USD/CAD Daily Outlook
Daily Pivots: (S1) 1.3032; (P) 1.3056; (R1) 1.3073; More...
Focus remains on 1.3052/68 cluster support zone in USD/CAD. Sustained trading below this support zone will carry larger bearish implications. Deeper fall should then be seen to 1.2673 fibonacci level next. Nevertheless, rebound from current level, with break of 1.3145 minor resistance, will indicate short term bottoming and bring rebound back to 1.3239 support turned resistance.
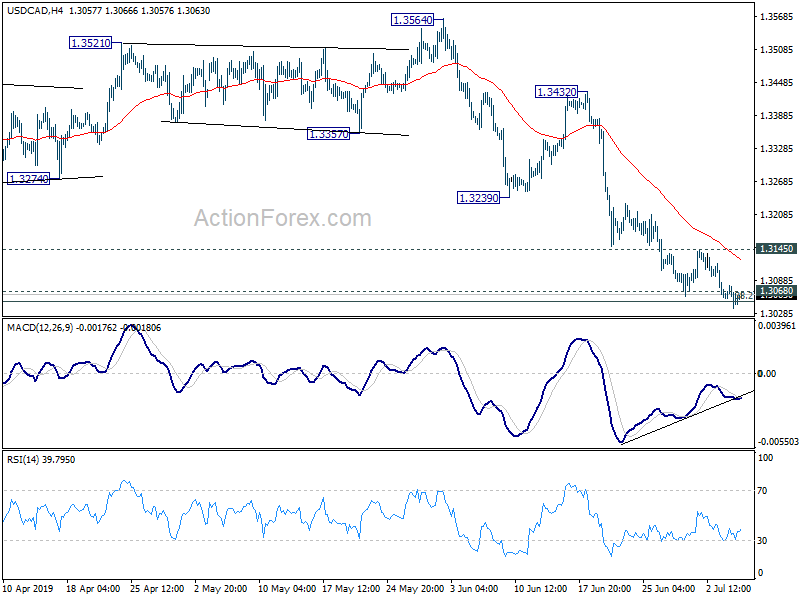
In the bigger picture, medium term outlook stays neutral for now even though the case of bearish reversal is building up. Decisive break of 1.3068 cluster support (38.2% retracement of 1.2061 to 1.3664 at 1.3052) will confirm completion of up trend from 1.2061 (2017 low). Further fall should be seen to 61.8% retracement at 1.2673 next. On the upside, sustained break of 61.8% retracement of 1.4689 (2016 high) to 1.2061 at 1.3685, is needed to confirm resumption of up trend from 1.2061 (2017 low). Otherwise, risk will stay on the downside.
EURUSD Dip Buying Preferred
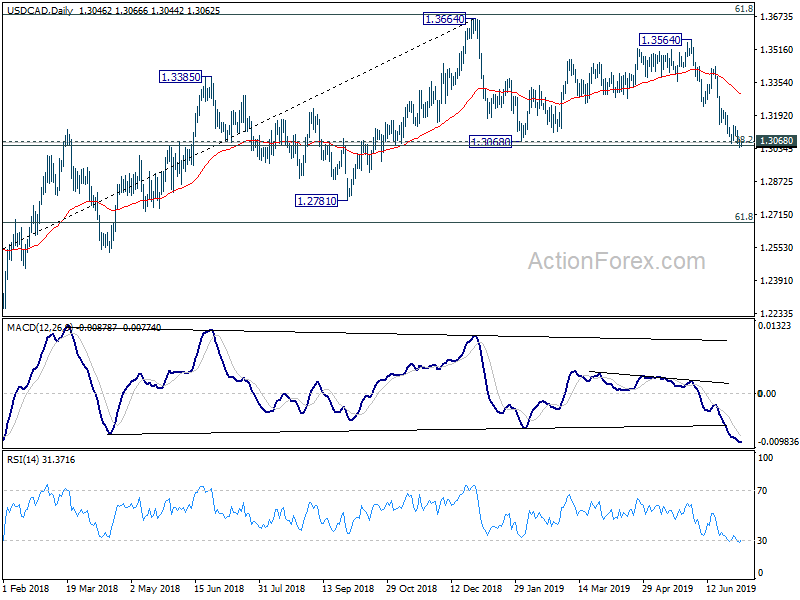
The euro continues to consolidate around the 1.1280 level against the US dollar as traders await the US Non-farm payrolls job report later today. Dip-buying is still a preferred strategy for the EURUSD until the 1.1190 support level is broken. Key areas that bulls may look to enter are located between the 1.1255 to 1.1222 region.
The EURUSD pair is only bullish while trading above the 1.1310 level, key technical resistance is found at the 1.1355 and 1.1400 levels.
If the EURUSD pair trades below the 1.1280 level, key support is found at the 1.1255 and 1.1222 levels
ETHUSD Awaiting Technical Confirmation
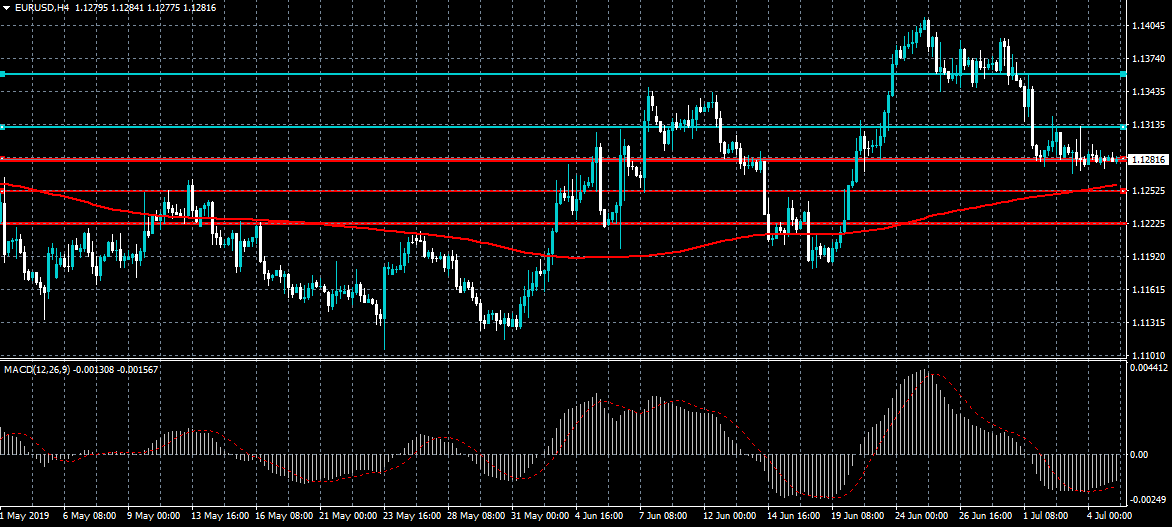
Ethereum is starting to appear fairly weak in the short-term, as bulls struggle to move price back above the $300.00 level. Impulsive technical moves back towards the $330.00 level remain possible to complete the bullish pattern on the four-hour time frame. A potential move higher may also be needed to confirm that a medium-term high is firmly in place for ETHUSD sellers.
If the ETHUSD pair trades above the $285.00 level, key resistance is found at the $320.00 and $330.00 levels.
If the ETHUSD pair trades below the 285.00 level, key support is found at the $255.00 and $235.00 levels.
EUR/USD Daily Outlook
Daily Pivots: (S1) 1.1274; (P) 1.1284; (R1) 1.1296; More...
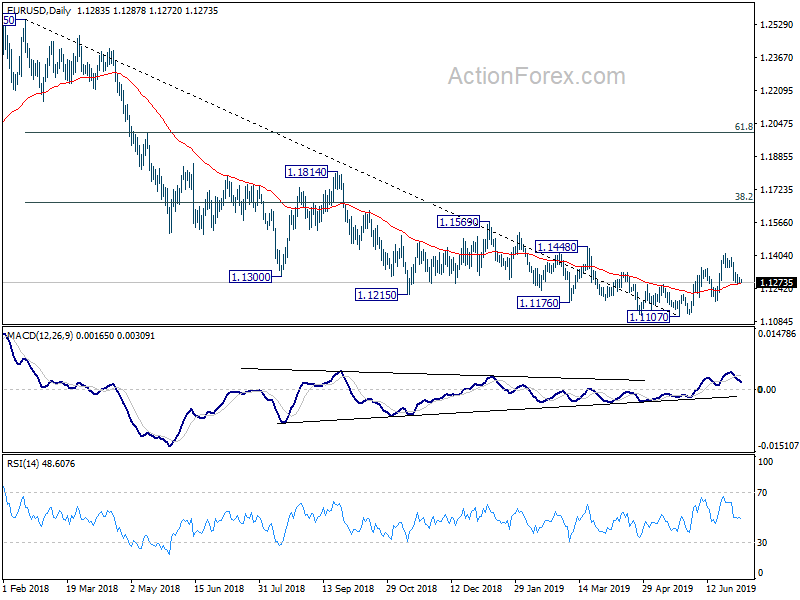
No change in EUR/USD's outlook. With 1.1344 minor support intact, further fall is in favor to 1.1181 support. Break will confirm completion of rebound from 1.1107 at 1.1412. Retest of 1.1107 low should be seen next. Though, above 1.1344 minor resistance will turn bias back to the upside to resume the rebound from 1.1107 through 1.1412 instead.
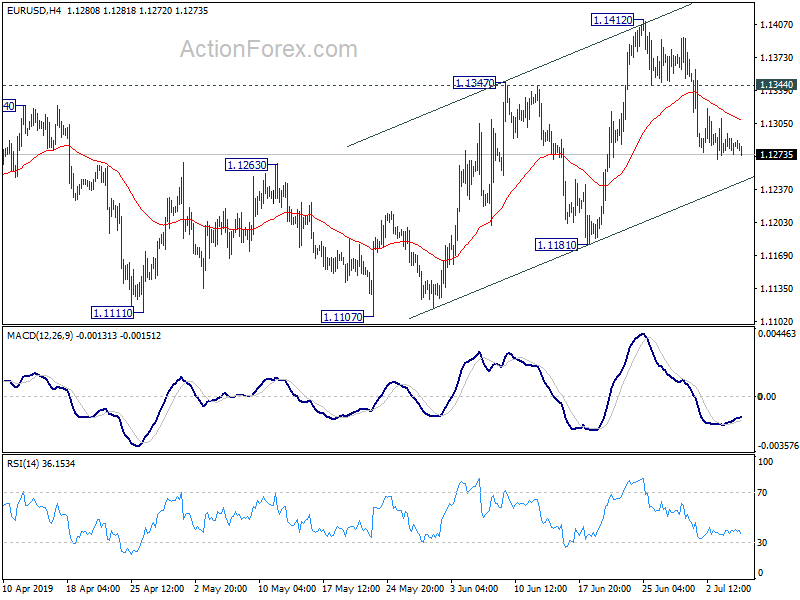
In the bigger picture, considering bullish convergence condition in daily and weekly MACD, a medium term bottom should be in place at 1.1107 after hitting 61.8% retracement of 1.0339 (2016 low) to 1.2555 (2018 high) at 1.1186. Further rise should be seen to 38.2% retracement of 1.2555 to 1.1107 at 1.1660. Reactions from there could indicate whether rebound from 1.1107 is a corrective rise or reversing medium term trend. In any case, risk will stay mildly on the upside as long as 1.1107 low remains intact.