

Sample Category Title
China said to tie US agricultural purchases to lift of Huawei ban
An SCMP report in Hong Kong suggested that China's commitment to buy additional agricultural products, as part of the agreement with US to halt trade war escalation, was not unconditional. Apparently, as Chinese media noted, if US "flip-flops" again in future trade negotiations, the purchase will be stopped again.
Additionally, China would want to see how the ban on tech giant Huawei is lifted, before committing the purchases. Trump has promised to ease supply ban on Huawei and White House could make an announcement on the details soon. For now, it's believed that Trump's administration was still debating how to ease the restrictions.
Suffering The Payrolls Wait
Moribund trading activity
It was a lackluster trading session in Asia, with traders sandwiched between yesterday's Independence Day holiday and tonight's US employment report. Indices were little changed and movements in the currency markets were kept to a minimum.
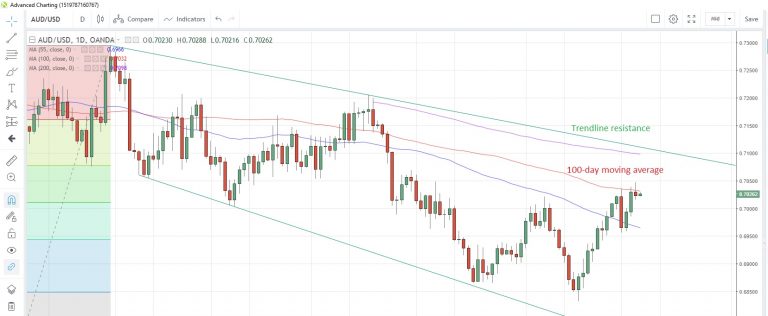
AUD/USD continues to wrestle with the 100-dfay moving average at 0.7032 having once again failed to close above it for the second day running yesterday. The 200-day moving average at 0.7098 and possible trendline resistance at 0.7110 lurk above. However, AUD/USD looks poised for its third weekly gain in a row, despite a couple of interest rate cuts by the RBA, and touched the highest since May 7 yesterday.
AUD/USD Daily Chart
China holding back?
Before the next phase of renewed trade negotiations between the US and China, the Asian nation has said that it is seeking clarity on the Huawei situation before committing to purchasing more US agricultural products. Last weekend, US President Trump said he would allow US companies to sell their (non-sensitive) equipment and that China would resume purchases of some US farm products. On Tuesday, White House Trade Advisor Navarro stated that the US position on Huawei and 5G networks had not changed since the G-20 summit. Let's see how things progress next week.
Monthly lottery
It's time for the monthly nonfarm payroll lottery, with analysts hoping for a strong rebound from last month's disappointing 75,000 jobs added. Estimates suggest 160,000 jobs were added to the US economy in June, with forecasts ranging from 100,000 to 220,000. Such an outcome would be below the six-month average of 175,000, which has been on a downward track for the last two months.
Accompanying the payrolls report, unemployment is seen unchanged at 3.6% with a mild uptick in average hourly earnings to +0.3% m/m from +0.2% in May.
Canada also reports its employment data for June with expectations for another increase of 10,000 jobs in the economy. This would be the third month in a row that jobs were added on a net basis.
Elliott Wave View: AUD/USD Strength Should Resume
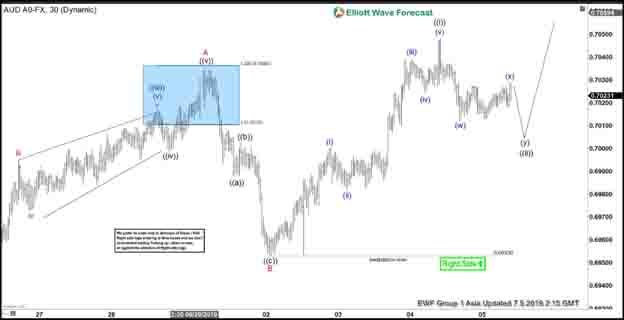
AUDUSD shows a bullish sequence from June 18, 2019 low. Rally from there is unfolding as a zigzag Elliott Wave structure where wave A ended at 0.7035. Wave B pullback ended at 0.6953. The internal of wave B unfolded as another zigzag in lesser degree. Wave ((a)) of B ended at 0.6988, wave ((b)) of B ended at 0.7 and wave ((c)) of B ended at 0.6953.
Wave C higher is in progress and pair has broken above wave A at 0.7035 confirming the next leg has started. Internal of wave C is unfolding as a 5 waves impulse Elliott Wave. Up from 0.6953, wave (i) ended at 0.7 and wave (ii) pullback ended at 0.6982. Pair then resumes higher in wave (iii) towards 0.7039, wave (iv) ended at 0.7024 and wave (v) ended at 0.7048. The entire move higher ended wave ((i)) of C in higher degree. Pair is now correcting cycle from July 2 low within wave ((ii)) before the rally resumes. We don’t like selling the pair and expect dips to find buyers in 3, 7, or 11 swing as far as pivot at 0.6953 stays intact.
AUDUSD 1 Hour Elliott Wave Chart
GOLD Price And Crude Oil Price Could Extend Declines
Gold price climbed higher once again, but it failed to surpass the $1,437 resistance area. Crude oil price is currently correcting higher, but it is facing a lot of hurdles on the upside.
Important Takeaways for Gold and Oil
- Gold price started a downside correction after topping near the $1,437 level against the US Dollar.
- There is a major bullish trend line forming with support near $1,415 on the hourly chart of gold.
- Crude oil price started a decent recovery after it tested the key $56.00 support area.
- There is a key bearish trend line forming with resistance near $56.80 on the hourly chart of XTI/USD.
Gold Price Technical Analysis
Gold price gained traction this week and climbed above the $1,410 and $1,420 resistance levels against the US Dollar. The price even broke the $1,430 resistance level, but it struggled to climb further higher.
A swing high was formed near $1,437 on FXOpen and the price recently started a downside correction. It broke the $1,425 and $1,420 support levels. It tested the $1,410 level and it is currently recovering higher.
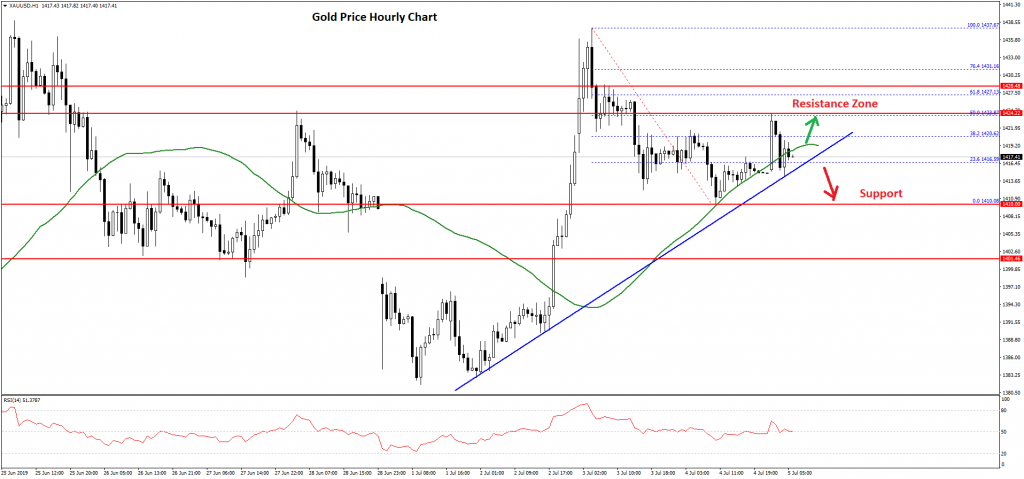
There was a break above the 23.6% Fib retracement level of the recent decline from the $1,437 high to $1,410 low. The price remained above the $1,415 level and the 50 hourly simple moving average.
However, the price struggled to clear the $1,425 resistance plus the 50% Fib retracement level of the recent decline from the $1,437 high to $1,410 low.
At the moment, the price is trading just above the $1,415 support area. There is also a major bullish trend line forming with support near $1,415 on the hourly chart of gold. If there is a downside break below the trend line and the 50 hourly simple moving average, the price could revisit the $1,410 support area.
On the upside, there is a strong resistance near the $1,422 and $1,425 levels. If there is a break above the $1,425 resistance, the price could accelerate above the $1,430 level in the near term.
Oil Price Technical Analysis
After topping near the $60.20 level, crude oil price started a strong decline against the US Dollar. The price broke the $59.50 and $58.00 support levels to move into a bearish zone.
The decline was such that the price settled below the $57.50 support and 50 hourly simple moving average. It traded close to the $56.00 support area and a swing low was formed near the $56.09
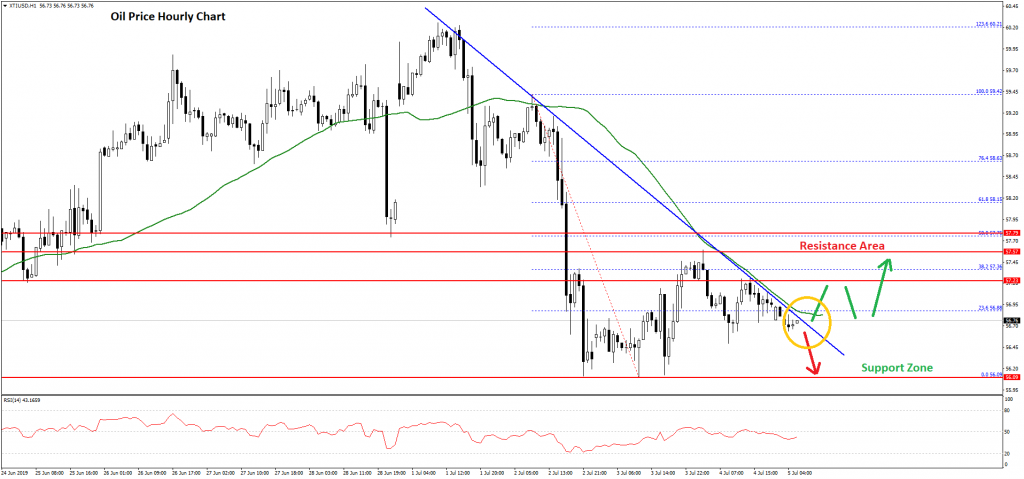
Recently, it corrected higher above the $56.50 resistance and the 23.6% Fib retracement level of the recent decline from the $59.42 high to $56.09 low. However, the upside move was capped by the $57.50 resistance.
Moreover, the price failed to test the 50% Fib retracement level of the recent decline from the $59.42 high to $56.09 low. There is also a key bearish trend line forming with resistance near $56.80 on the hourly chart of XTI/USD.
If there is an upside break above the trend line and the 50 hourly SMA, the price could recover towards the $57.50 or $58.00 resistance.
On the downside, the main supports are near $56.40 and $56.10, below which crude oil price might decline sharply below $56.00. The next major support is near the $55.00 level.
Market Morning Briefing: Pound Is Falling Towards Crucial Levels Of 1.25
STOCKS
Asians are trading lower. Market seems to be in wait and watch mode to see the key US jobs data release today evening. A weak job numbers will strengthen the case of a rate cut from the Fed and will trigger a sharp rise in the equities. Market expects the US to add 164K jobs on the nonfarm payroll while we forecast for an increase of 178K. But broadly we retain our bullish view on the equities and any dip after the US jobs data could be short-lived. On the domestic front, the Union Budget today will drive the markets.
Dc The US markets were closed yesterday. Weak jobs data today will aid the Dow (26966) breach 27000 and rally to 27200 and 27500 in the coming days. Inability to break 27000 today can trigger a corrective dip to 26700-26650 first and could delay our preferred rally to 27200-27500.
DAX (12629.90, +13.66, +0.11%) has inched slightly higher. The view remain bullish for the index to move up to 12800 and 13000 in the coming weeks. Support is at 12450.
Nikkei (21670.73, -31.72, -0.15%) continues to hover near its resistance at 21750 and keeps the near-term outlook mixed. A strong break above 21750 is needed for it to gain momentum and move up to 22250. While below 21750, a test of 21500 and 21350 on the downside cannot be ruled out.
Contrary to our expectation, Shanghai (2996.28, -8.97, -0.30%) has dipped below 3000. A test of 2980-2970 is possible while it remain below 3000. However, the broader picture is bullish with strong support around 2950 which can limit the downside if Shanghai extends its fall below 2970 in the coming days.
Sensex (39908.06, +68.81, +0.17%) and Nifty (11946.75, +30.00, +0.25%) remained stable yesterday above their respective support levels of 39750 and 11900 and has closed slightly higher. The outlook is bullish to see a rise to 40000-40500 on the Sensex and 12000-1215 0 on the Nifty. But as mentioned yesterday, the Indian indices need some trigger to gain momentum and move up sharply. We hope that the Union Budget today would give the needed push for them.
COMMODITIES
Overall commodities are stable and could see some sideways consolidation within a broad range that could at least last for the next 3-4 sessions.
Brent (63.25) is stable while Nymex WTI (56.69) has come off slightly. On the downside there is scope for testing 60 and 54 respectively before a bounce from there is seen.
Gold (1421.70) has immediate support near 1410 and while that holds, we could see trade within 1410-1450 region in the near term.
Silver (15.31) is also likely to consolidate sideways in the 15.15-15.60 region in the near term before breaking on either side. Preference is for a fall in the medium term as 15.60 is a decent resistance coming from Jun’18 levels.
Copper (2.6745) is trading above support at 2.60. There is scope of a rise towards 2.76-2.78 in the near term.
FOREX
Dollar Index (96.77) is likely to be capped at 97.10-97.00 (revised from 97.25 mentioned yesterday) in the very near term from where a fall towards 96.40 or lower could be seen.
Euro (1.1280) has support near 1.1250 which is likely to hold in the near term producing a bounce back towards 1.13 or higher in the coming week.
Dollar-Yen (107.86) has come off sharply from 108.50 and while that holds, Dollar-Yen could have scope to fall towards 107 or even to 106.50 in the near term. View is bearish below 108.50.
Euro-Yen (121.65) is also stuck in the sideways range of 123.50-121.0 and could continue to move up again to 123.50 while support near 121 holds. The currency pair looks bullish in the near to medium term.
Aussie (0.7025) has resistance at 0.71 from where a fall looks likely back towards current levels. Near term is bullish for Aussie towards 0.71.
Pound (1.2582) is falling towards crucial levels of 1.25 which could turn out to be an important reversal level. We would watch closely price action near 1.25 as a bounce from there could take it back towards 1.27-1.28 in the medium term.
USDCNY (6.8749) could test 6.84/83 while immediate resistance near 6.90 holds. The currency could remain within 6.90-6.83 for the medium term.
USDINR (68.5050) has immediate support near 68.35/40 which may produce a near term bounce towards 68.80. A break below 68.35 could accelerate a fall towards 68 in the near term. Overall view is bearish for Dollar-Rupee. We would watch price action near 68.35 today.
INTEREST RATES
The US markets were closed yesterday on account of a public holiday. The non-farm payroll and the unemployment data release today will be a key event to watch. Weak job numbers will increase the hopes in the market for a rate cut from the Fed this month itself. This in turn can drag the Treasury yields further lower from current levels. The 2Yr, 5Yr, 10Yr and 30Yr yields are currently at 1.75%, 1.72%, 1.94% and 2.46% respectively. The 30Yr can test 2.43%. The 10Yr has support near current levels at 1.93% from where a bounce to 2% is possible before targeting 1.85% on the downside. The broader view continues to remain bearish and we expect the yields to fall further in the coming days.
The German yields continues to remain under pressure. Hopes for a rate cut and more stimulus from the ECB are weighing on the yields. The 2Yr (-0.77%), 10Yr (-0.40%) and 30Yr (0.19%) yields have dipped further yesterday. Though the 5Yr (-0.66%) has inched slightly higher, it has key resistance near current levels and can reverse lower targeting -0.73% on the downside in the coming days. The 10Yr can dip to -0.42%.
The 10Yr GOI (6.8891%) has dipped below 6.90%. The bearish view remains intact. Next support is at 6.83% which can be tested in the near-term. A bounce from there can take it to 6.90% and 6.95%. The broader bearish view is intact and an eventual break below 6.83% will take the 10Yr GOI to 6.80% and 6.75% in the coming days.
USD/JPY Remains At Risk Of Further Declines
Key Highlights
- The US Dollar failed to surpass the 108.50 resistance against the Japanese Yen.
- A crucial bearish trend line is forming with resistance near 108.40 on the 4-hours chart.
- The Euro Area Retail Sales declined 0.3% in May 2019 (MoM), whereas the forecast was +0.3%.
- The US nonfarm payrolls in June 2019 could change 160K, more than the last 75K.
USDJPY Technical Analysis
After trading as low as 106.77, the US Dollar started a decent upward move against the Japanese Yen. The USD/JPY pair traded above the 108.00 resistance, but it struggled to clear the 108.50 resistance area.
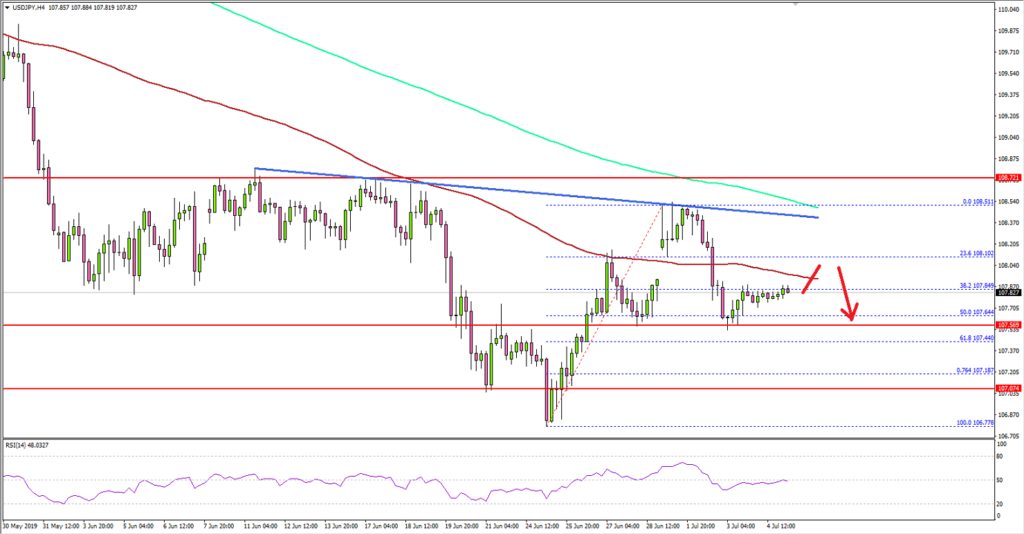
Looking at the 4-hours chart, the pair gained bullish momentum above the 107.80 and 108.00 resistance levels. It even broke the 108.20 resistance plus the 100 simple moving average (red, 4-hours).
However, the 108.50 level acted as a strong resistance and the pair remained well below the 200 simple moving average (green, 4-hours). More importantly, USD/JPY failed to clear a crucial bearish trend line with current resistance near 108.40 on the same chart.
Recently, the pair corrected lower below 108.00 and the 100 simple moving average (red, 4-hours). It tested the 50% Fib retracement level of the upward move from the 106.77 low to 108.51 high.
The main support on the downside is near the 107.60 and 107.50 levels. If there is a downside break below the 107.50 support, the pair could revisit the 107.00 support area.
An intermediate support is 107.18, coinciding with the 76.4% Fib retracement level of the upward move from the 106.77 low to 108.51 high.
Looking at EUR/USD and GBP/USD, both pairs struggled to hold key supports and declined below 1.1320 and 1.2620 respectively. Today’s NFP release in the US could change the market sentiment and likely to impact USD/JPY as well in the near term.
Economic Releases to Watch Today
- US nonfarm payrolls June 2019 – Forecast 160K, versus 75K previous.
- US Unemployment Rate June 2019 – Forecast 3.6%, versus 3.6% previous.
- Canada’s employment Change payrolls June 2019 – Forecast 10K, versus 27.7K previous.
- Canada’s Unemployment Rate June 2019 – Forecast 5.5%, versus 5.4% previous.
Daily Markets Broadcast
US indices unmoved due to holiday
Index futures were little changed overnight with Wall Street closed for the Independence Day holiday. Today focus shifts to the US nonfarm payroll report for June.
US30USD Daily Chart
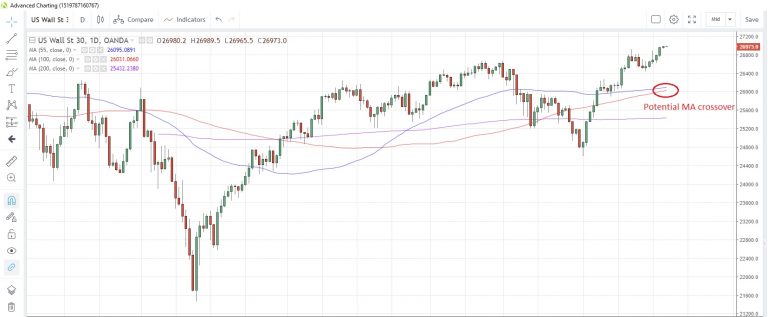
The US30 index edged marginally higher yesterday amid muted activity, closing higher for a sixth consecutive day
The 100-day moving average at 26,031 and the 55-day average at 26,095 are on a convergence path, with a crossover possible by the end of next week
The US economy is expected to have added 160,000 jobs in June, higher than May's disappointing 75,000. Unemployment is seen unchanged at 3.6% while average hourly earnings are forecast to rise 0.3% m/m.
DE30EUR Daily Chart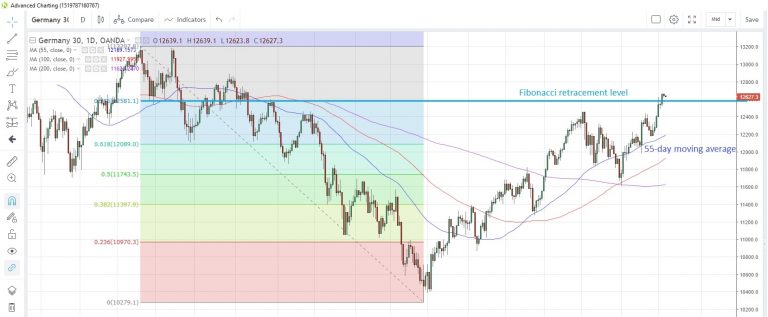
The Germany30 index drifted lower from 11-month highs yesterday, lacking direction from a closed Wall Street
The index is still managing to hold its advance above the 78.6% Fibonacci retracement of the May-December drop last year at 12,581. The 55-day moving average is at 12,189
Germany's factory orders are expected to decline 0.1% m/m in May, the latest survey of economists suggests. ECB's De Guindos is scheduled to speak again today.
UK100GBP Daily Chart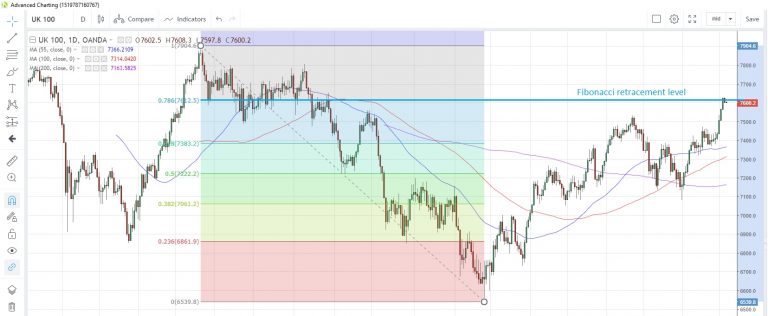
The UK100 index is hovering near more than 10-month highs, encouraged by Wall Street at record highs, though with one eye on the Tory party leadership race, with final voting kicking off from tomorrow
The index is testing the 78.6% Fibonacci retracement of the May-December drop last year at 7,613
A survey published by an employers group, the Institute of Directors, has shown that British businesses have turned more gloomy about the economy amid a deepening political crisis and the uncertain future of Brexit.
USD/CAD Canadian Dollar Steady Ahead Of US And Canadian Jobs
The Canadian dollar was flat on Thursday as the volume in the market was subdued with the Fourth of July holiday in the States. The loonie has risen as the market is pricing in more than one rate cut by the Federal Reserve this year. President Trump continues to pile pressure on the Fed to depreciate the currency via lower rates as he compares the lack of effort from the Fed as what the ECB and other central banks are doing.
The Bank of Canada (BoC) has turned dovish, but not enough to signal a rate cut in the near term. Improving fundamentals have given the central bank some breathing room with steady growth and higher exports.
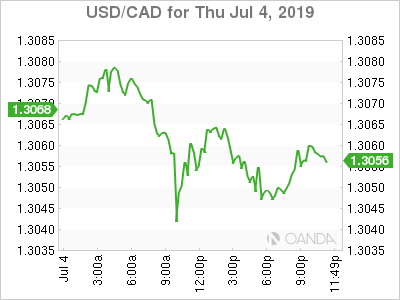
Next up for the CAD will be the release of the Canadian employment data on Friday. Last month was a pleasant surprise as a small correction was expected after the monster jobs gain published on May 10. The forecast calls for 10,000 positions to be added, but a miss would not be a surprise given the gain in the April jobs report.
US employment has been a steady pillar of the economy, so when the NFP showed a big miss last month it validated the market pricing a Fed rate cut. The lower than expected Jobs report triggered a bout of pessimism about US growth and the need for the Fed to drop its patient stance and go the full 180 degree turn on interest rates.
The US economy could add 165,000 jobs, but given the importance of the indicator a lower number combined with a miss on the wage growth component could be another dagger for the US dollar as it would get the Fed even closer to announcing a rate cut when the FOMC meets at the end of the month.
OIL – Oil Lower on Global Growth Concerns
Oil prices fell close to 1 percent on Thursday. The lack of volume due to the US Independence Day was a factor with traders looking for the market to regain full force ahead of the release of the US employment report for June.
US crude inventories registered another drawdown, but given the expectations set by the API a day earlier, it was a miss by shrinking for less than anticipated.
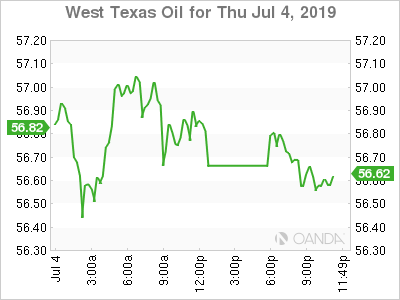
Global growth remains the main factor holding back crude prices. Trade disputes have hurt estimates as more agencies and central banks downgrade growth forecasts as trade headwinds get stronger. Without shutting the door on the US-China dispute, the US has now targeted the EU.
Manufacturing data around the globe is beginning to show signs of deceleration attributed to the trade war. One of the main reasons behind central banks so eager to restart the easing engines is the pressure protectionism is putting on economic growth, so they must step in with more stimulus even though their arsenal is depleted.
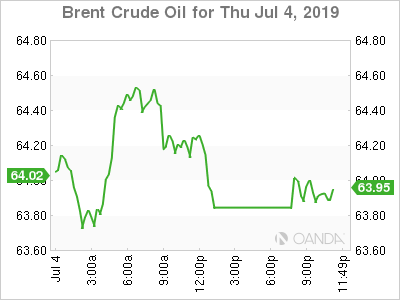
The OPEC+ announced a 9-month extension to their production cut agreement, after a successful meeting between Saudi Arabia and Russia in Japan in the sideline of the G20. Russia played hard to get until the end but given the low forecasts they have for internal budget current prices are acceptable. It is the volatility that could put pressure on Russian producers to break away from the group, but that is something for next year to ponder.
The OPEC+ deal will keep prices from falling too hard, but there must be an end to trade protectionism to assure the demand for energy products recovers.
Oil is also under pressure from higher US production. The US is now positioned to become a net exporter and is not bound by the production limit agreement. This could further drive prices lower.
GOLD – Gold Drops Slightly But Awaiting Signs of US Economic Slowdown
Gold fell 0.2 percent during the Thursday trading session. The Fourth of July holiday came at the right time for the US dollar, as it gave the currency time to get its footing after Fed fund rate cut anticipation had depreciated the greenback.
The NFP report on Friday could add another soft data point to the narrative of a slowdown of American growth. The Fed was forced to a 180 degree turn after lifting its benchmark rate in December and being on the verge of cutting the interest rate to avoid a recession.
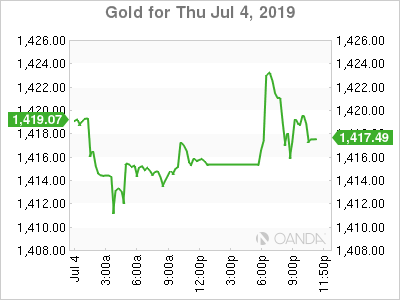
Gold has risen as the Fed preached patience and is now ready to remove some of the tightening it added last year. The yellow metal is also having a moment as it retakes the safe haven crown away from the US dollar. Trade uncertainty, in particular more than one trade front open at the same time, has given the edge to gold in the eyes of investors.
Despite a cordial meeting between Trump and Xi at the G20, the biggest takeaway was a restart of negotiations. Negotiations that are still far apart in key topics, with neither side willing to concede.
Geopolitical concerns are keeping gold bid, as the Middle East situation could once again flare up with the US taking a less diplomatic approach to Iran and although awaiting a new leader the UK is gearing to get Brexit done once and for all.
STOCKS – Indices Mixed Ahead of US Jobs Report
The Fourth of July holiday made for a low volume day of trading, with most major indices stuck in a tight range awaiting the U.S. non-farm payrolls (NFP) due on Friday. Equities have rallied on the back of a most likely rate cut by the Federal Reserve and the lower than expected US private payrolls report earlier in the week.
The Fed is independent from the White House, even though President Trump has been very aggressive that the US central bank needs to lower rates and depreciate the dollar to make US exports more competitive.
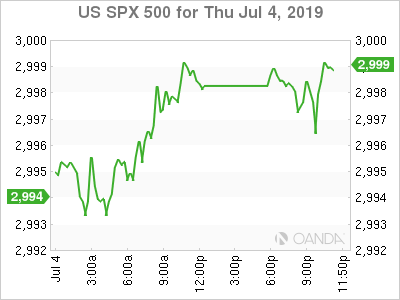
The Fed is likely to cut the benchmark rate later this month by 25 basis points. This fact alone has boosted stock markets around the globe and put pressure on the dollar and bonds.
Emerging markets offer higher yields to investors so they will be more attractive as major economies are looking to cut rates or keep them low.
Risk appetite has improved, but the biggest obstacle for an EM rally is a full-blown trade war. US-China remains unresolved and the US is looking to pick a tariff fight with the EU.
The rally in equities has been driven by dovish central bank rhetoric. The stock market has not been too concerned with the trade war, as the tariffs have avoided hitting consumer goods so far. There is still upside if a true trade agreement materializes between the US and China and the Fed keeps cutting rates as expected.
Geopolitical issues like Brexit, Middle East tensions and the trade war have been an inconvenience, but not enough to derail the record setting pace. A resolution on such fronts could expand the bullish run into next year, but as more headwinds add up it could signal the end of the party.
Eco Data 7/5/19
[php_everywhere instance="1"]
Q3 Outlook: Investing in a Late-Cycle Economy
Fixed income and stock markets waltzed in tandem in the second quarter of 2019, yet continue to tell a different story. Bond yields dropped dramatically, not just in the US, but across most developed economies. The US 10-year yield fell below 2% for the first time since 2016, while bond yields across Europe fell to record lows, led by German bunds. The sharp decline in yields reflects a pessimistic growth outlook, an escalating trade war and plummeting inflation. However, stock markets aren’t buying this story. The S&P 500 posted its best H1 since 1997, rising 17% and sending valuations back to levels last seen in late 2018. Back then, a steep selloff knocked 20% off the US benchmark’s market capitalization.
The only thing that investors in both asset classes seem to agree on is that we are heading into another phase of monetary easing.
The US Federal Reserve has indicated its willingness to halt its gradual tightening of policy, and possibly cut interest rates if necessary. Other central banks across developed and emerging markets are either providing signs of dovishness or have eased monetary policy. If global central banks embark on a synchronized monetary easing cycle, there is hope that this will prolong the current economic cycle, providing another sugar rush for equity investors. However, it remains unclear how long global central banks will extend the current cycle as many variables remain unknown.
Of course, trade uncertainties remain the most significant risk. The temporary trade truce that was reached in the G20 summit between the US and China gave investors a green light to continue buying risky assets. But investors should be careful about the sustainability of the rally in equities if corporate profits remain weak. Caution is warranted at this stage. Another reason to be cautious is the inverted US yield curve. The longer the yield curve remains inverted, the stronger the signal it sends to investors that we are moving towards a new recession.
The dovish shift in the Federal Reserve’s policy stance is likely to drive the Dollar lower in Q3, regardless of the fact the European Central Bank and other major central banks will likely follow suit and turn on the stimulus taps.
The reason for the Dollar’s likely underperformance is the Fed has much more room to cut interest rates than its central banking peers in developed economies.
This will result in a shrinking gap in interest rate differentials, with the Yen likely to be the biggest beneficiary from another round of monetary easing, especially if trade uncertainty persists through the third quarter of 2019.
Bitcoin returned to the headlines in Q2, after a surge of more than 200% since the beginning of the year. The rise in price was fueled by optimism about increased adoption of cryptocurrencies. The rally in Bitcoin also coincided with a surge in prices in traditional safe haven assets, such as Gold and the Japanese Yen throughout June.
Although Bitcoin’s bumpy ride and wild fluctuations mean it’s too early to grant the digital currency safe-haven status, it’ll be interesting to see if $13 trillion of negative bond yields lead institutional investors to jump into the world of crypto once again.
Enclosed is our outlook for the coming three months.
- Q3 Outlook: EURUSD – Set for a Rough Road Trip South as ECB Shifts into Lower Gear
- Q3 Outlook: USDJPY – The Path to 100 is Clearer Than a Move Above 112
- Q3 Outlook: GBPUSD – Boris Johnson To Give Sterling Bears More Ammunition to Sell the Pound
- Q3 Outlook: AUDUSD – Aussie Caught in RBA vs. Fed Rate-Cuts Race
- Q3 Outlook: Oil – Will a Sturdier Floor Make for a Higher Bounce?
- Q3 Outlook: Gold – Positioned to Thrive in Low Interest Rate Environment