

Sample Category Title
Slump in Crude Oil Price after OPEC+ Announcement Signals More Cuts Needed to Correct Imbalance
OPEC+ agreed to extend production cuts of -1.2M bpd 9 months to March 31, 2020. The extension came in longer than market expectations of 6 months, when the group meets to renegotiate further extension in December 2019. Another surprise was the price actions of crude oil. Both benchmarks - front- month WTI and Brent crude contracts- dived to the levels not seen in two weeks, worst reaction to OPEC over the past 4 years. The market is concerned that the output cut would not be sufficient to correct the imbalance driven by the global economic slowdown.
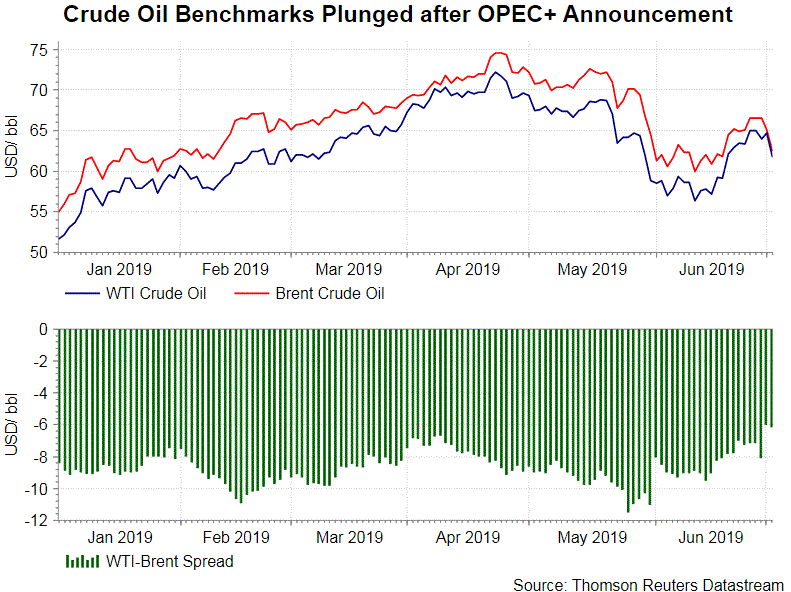
OPEC +, a 24-country coalition with OPEC and non-OPEC producers, agreed to cut 1.2M bpd output through March 2020. According to Saudi energy minister Khalid al-Falih, the 9-month extension seeks to cover 1Q20 (first quarter is a “seasonally weak” period) and to prevent a potential inventory build of 100M bpd. The objective of production cuts is a more normal inventory level, instead of price level. Having been reducing output by more than the quota over the past years, Saudi has again pledged to cut more deeply than required so as to reduce the inventory level.
Undoubtedly, US shale production has, in recent years, contributed aplenty to the rapid increase in oil inventory. The persistent output cut has been to counter the US output. As Al-Falih noted, until US shale output “peaks, plateaus and then declines like every other basin in history”, it is “prudent for those of us who have a lot at stake, and also for us who want to protect the global economy and provide visibility going forward, to keep adjusting to it”.
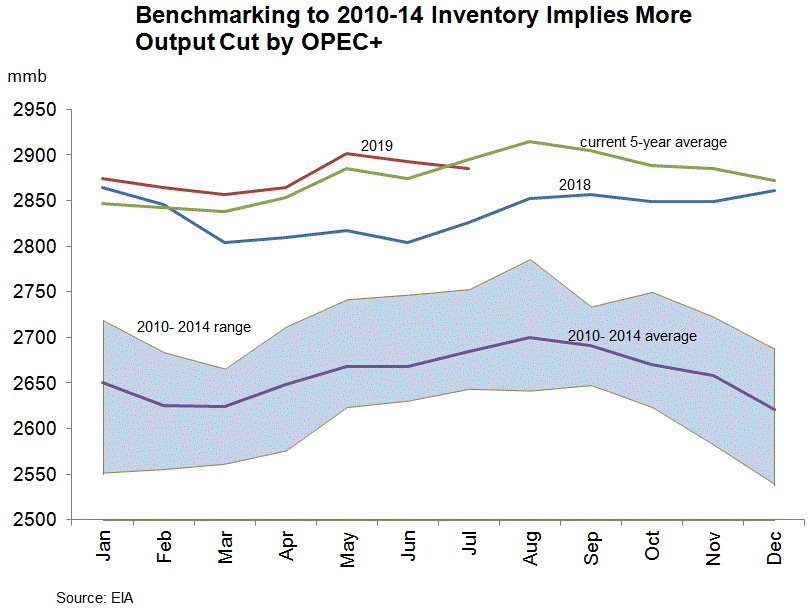
The benchmark for measure inventory has become more aggressive. Saudi has proposed to use the average of 2010-14 inventory in setting future output target, compared with the current “last five years’ average”. This method has, however, not reached consensus. Apparently, Russia has reservation on it as deeper output cut would be needed to return to the inventory level in that period. According to S&P’s estimates, the overhang of OECD stocks was about 25 mmb as of May if the “last five years’ average” was used. However, the overhang would surge to 214mmb if the reference is changed to “2010-14 average”.
BoJ Funo: Necessary to maintain low rates for prolonged period, but no need to ease further
BoJ board member Yukitoshi Funo said it's necessary to maintain current ultra-loose monetary policy. However, he saw no need to ramp up stimulus for now.
Funo said, "given price growth and inflation expectations aren't heightening much, it's necessary to maintain sufficiently low rates for a prolonged period to achieve the BoJ's price target." However, he's also optimistic that "we can expect Japan's economy to recover in the latter half of this year". And, "as such, I see no need to ease policy further now,"
He also noted the forward guidance is already leaving open the possibility of the BoJ maintaining current policy for long. "We say 'at least' until spring 2020 because there's a good chance current low rates will be maintained beyond spring next year."
IMF Lagarde nominated to be next ECB president
After three days of marathon summit negotiations, EU leaders have finally agreed to nominate two women for the two top posts. France's IMF Managing Director Christine Lagarde is chosen as the successor of Mario Draghi as ECB President. German Defence Minister Ursula von der Leyen, a close ally of Chancellor Angela Merkel, would succeed Jean-Claude Juncker as European Commission President.
In other decision, Belgium's Liberal caretaker Prime Minister Charles Michel would overtake Donald Tusk as European Council President. Spain's acting Foreign Minister, Josep Borrell, is nominated as EU's foreign policy chief.
Elliott Wave View: Gold Extends In Impulsive Move
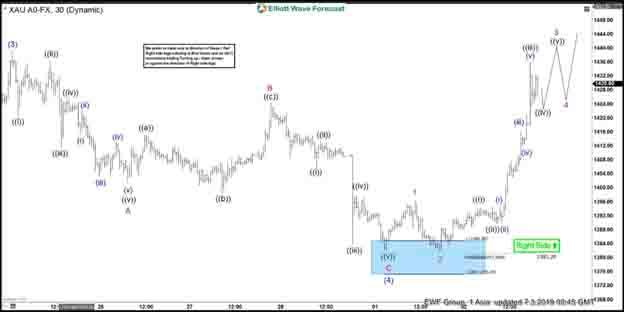
Short Term Elliott wave view in Gold suggests that the decline to $1381.42 low on July 1 ended wave (4). Above from there, the yellow metal is rallying higher as an impulse Elliott Wave structure looking for more upside within wave (5). Up from July 1 low, wave 1 ended at 1396.35 and wave 2 pullback ended at 1381.9. Wave 3 is currently in progress and also subdivides as a 5 waves impulse in lesser degree.
Wave ((i)) ended at 1394.45, wave ((ii)) ended 1389.7, wave ((iii)) ended at 1436.04, and wave ((iv)) ended at 1421.75. Expect the yellow metal to extend higher 1 more leg to end wave ((v)) of 3. Afterwards, it should pullback in wave 4 before more upside is seen. We don’t like selling Gold and expect buyers to show up in the dips in 3, 7, or 11 swing as far as pivot at 1381.4 low stays intact. Potential target to the upside is 100% extension from August 16, 2018 low. This can bring the yellow metal to 1453 – 1497 area before possibly ending the cycle and see a larger 3 waves pullback.
Gold 1 Hour Elliott Wave Chart
USD/JPY Bearish Pullback Faces Support Fib Levels At 107.50
The current wave outlook for the USD/JPY favours a bullish reversal due to the fact that a wave 2 (purple) seems completed at the recent low around 106.75 and because price has made a decent bullish impulsive move up, which has been labelled a wave1 (pink). The current pullback could therefore be a wave 2 (pink) but this wave 1-2 pattern is invalidated if price breaks below the 100% Fibonacci level of wave 2 vs 1.
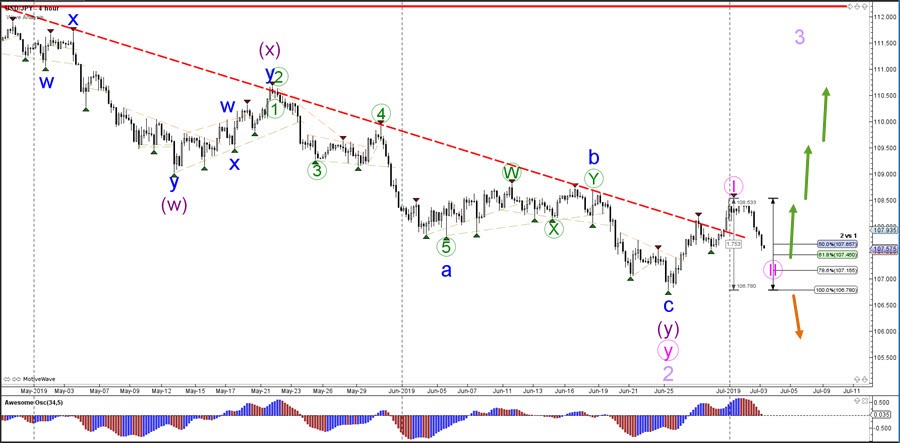
The USD/JPY is now building a bearish impulse but this could be explained by an impulsive wave C (purple). The Fibonacci levels of wave C vs A and 2 vs 1 are potential support and bouncing spots if this wave analysis is indeed correct.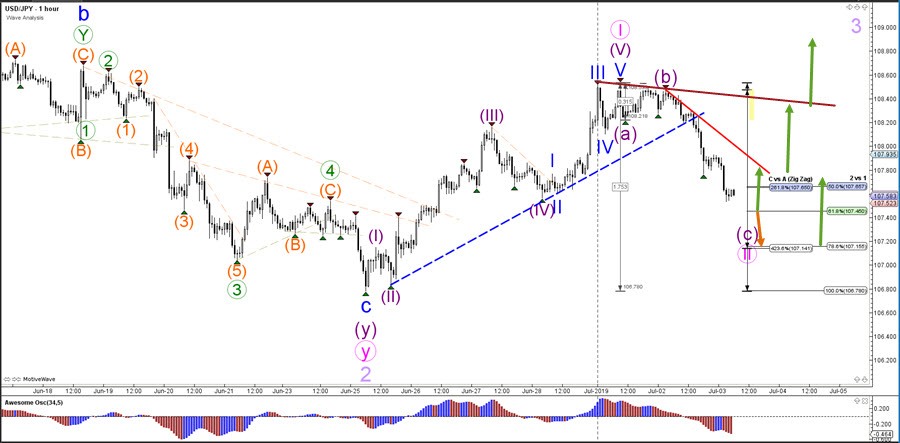
Market Morning Briefing: Euro Bounced From 1.1275
STOCKS
As mentioned yesterday, the US considering additional tariffs on EU goods has renewed the trade war concerns and started to weigh on equities. As a result, the uptrend in the equities which got accelerated after the positive developments on US-China trade talks over the weekend seems to be losing pace. However, the broader picture continue to remain bullish and the equities can resume their uptrend, may be after an intermediate consolidation.
Dow (26786.68, +69.25, +0.26%) is getting support near 26600 and remains bullish to test 27000 in the near term. A break above 27000 will pave way for our preferred target levels of 27200 and 27500.
DAX (12526.72, +5.34, +0.04%) is managing to hold above its support at 12450. As mentioned yesterday, DAX is bullish to test 12800 and even 13000 in the coming weeks while it remains above 12450. A break below 12450 will take it to 12400-12350 and delay the above mentioned rally.
The resistance at 21750 on Nikkei (21623.55, -130.72, -0.60%) seems to be holding well. While below 21750, a pull-back move to 21500 and 21350 is possible. The bullish sentiment will come back in to the picture only on a strong rise past 21750.
Shanghai (3018.48, -25.47, -0.84%) has failed to breach 3050 and has come-off today. However, the outlook remains bullish. A sideways consolidation between 3000 and 3050 is possible in the near-term before we see a fresh rally to 3080 and 3100.
Sensex (39816.48, +129.98, +0.33%) has risen above its resistance at 39750. The bias is turning bullish and the chances are high now for it to breach 40000 and rise to 40500 in the coming days. Support is at 39500.
Nifty (11910.30, +44.70, +0.38%) has closed just above 11900. The daily candle yesterday indicates that the index could be gearing up for a fresh rally. Support is at 11800. While above 11800, the outlook is bullish for the Nifty to target 12100-12150 on the upside.
COMMODITIES
The American Petroleum Institute (API) reported a large crude oil inventory draw of 5mln barrels (higher than market expectation of 2.48mln barrels) for week ending 27th June, initially leading to a rise in Crude prices but could not sustain higher prices as important news events across markets with fears of slowdown in demand dragged crude lower on fresh Dollar strength.
Brent (62.74) and Nymex WTI (56.55) are trading lower. While 67 holds on Brent, it could come off towards support at 60 in the near term. Similarly, resistance at 60 on WTI is holding well and has succeeded in putting up a string rejection there. WTI could now fall towards 56-54 levels before bouncing back in the medium term.
Gold (1426.70) added to gains on falling US Dollar. Immediate resistance near 1440/50 is to be watched in the near term. A break above 1450 could lead to an eventual rise towards 1500 in the medium term. View is bullish for Gold while above 1380.
Silver (15.37) has risen back and could target resistance near 15.50/60 again in the near term. Overall sideways trade within 15.0-15.60 looks likely.
Copper (2.6625) has fallen sharply and while below 2.68, Copper could head towards support near 2.60. Interim support is visible at 2.65 which if holds could help Copper bounce back in the near term negating a fall to 2.60. Watch price action near support at 2.65.
FOREX
Carneys speech and the lower than expected PMI data weighed down on Pound which could test support levels before recovering. Euro bounced after comments from ECB policy makers stated they were in no rush to cut rates in July meeting but fell soon after the news came in that Christine Lagarde is elected to replace Draghi. Aussie and USDCNY are trading higher while Rupee could strengthen a bit today. Dollar-Yen looks weak.
Dollar Index (96.70) may not be able to move up from 97.25 and is likely to trade below 97.25 while 95.50 continues to remain an important support.
Euro (1.1291) bounced from 1.1275 and is trading almost stable just now. We could see a test of 1.1250 before the currency bounces sharply from there. Break below 1.1250, if seen would be bearish for Euro in the medium term. Watch price action near 1.1250/75
Dollar-Yen (107.60) is down sharply falling from resistance near 108.53. If the fall continues, Yen could test 106.50-106.00 in the near term.
Euro-Yen (121.51) could possibly spend some time in sideways ranged movement between 123-121 in the near term before breaking on either side. While 121 holds, Euro-Yen could bounce back towards 123 in the near term.
RBA cut rates by 25bps yesterday to 1% from the earlier 1.25%. Although a short bounce is seen from 0.6950 yesterday, Aussie (0.6989) could be capped at 0.70-0.7050 on the upside unless a sharp break is seen above 0.705. A near term rise could be in place for the next 2-3 sessions but we may look for a fall in Aussie in the medium term towards 0.68.
Mark Carney's speech led to a sharp fall in Pound which was already trading weak after the lower than expected construction PMI. Carney said that the stance of monetary policy is tighter than intended. Markets have interpreted for more rate cuts in the upcoming policy meets although Mark laid possibilities of rate hike in case of a smooth Brexit which looks unlikely considering current scenario. Adding to the speech he mentioned that he expects economic growth to weaken in the second half of the year.
Pound (1.2592) faced stiff selling yesterday and has declined sharply. There is scope of testing 1.25-1.24 in the near term before bouncing back towards 1.26 or higher. While important support in the 1.25-1.24 exists, Pound may not be trading at lower rates for long and could soon see a bounce back in the medium term.
USDCNY (6.8784) has scope to rise towards 6.89/90 again in the near term while support near 6.83 holds. Near term looks bullish to sideways within 6.90-6.83 region.
USDINR (68.93) can possibly test 68.80 today. Immediate resistance is seen near 69.05 on the upside and the pair is likely to fall below 68.80 in the near term bringing in chances of 68.60/50 into the picture. View is bearish for USDINR.
INTEREST RATES
The US threatening to levy additional import tariffs on Euro zone goods has renewed market concerns on the trade war front. The fear of the global economy slowing down as a result of the ongoing trade war is back into the market. As a result, bond yields have fell sharply on increased risk aversion in the market.
The US Treasury yields were down across tenors. The 10Yr (1.95%) declined below the 2% mark for the first time since November 2016. The 2Yr (1.73%), 5Yr (1.72%) and 30Yr (2.49%) were also down significantly. The 10Yr has an immediate support at .93% and a bounce-back to 2% from there cannot be ruled out. However, an eventual break below 1.93% will pave way for further fall to 1.85% and even 1.75%. The 30Yr has declined below 2.50% as expected and can now move down to 2.45%-2.43%.
The German yields were also down across tenors. The 2Yr (-0.78%), 5Yr (-0.69%), 10Yr (-0.37%) and 30Yr (0.25%) were down between 2 and 4 bps. The trend remains down for the German yields. As mentioned yesterday, the 5Yr can dip to -0.73% and the 10Yr can test -0.40% and -0.42% on the downside.
The 10Yr GOI (6.9773%) has dipped below 7% and can test 6.95% and 6.90% in the near term. A break below 6.90% will accelerate the fall to our preferred target levels of 6.80% and 6.75%. But while 6.90%, a sideways move between 6.90% and 7.10% is possible before we see the above mentioned fall.
EUR/USD Could Recover, USD/JPY Under Pressure
EUR/USD declined recently below 1.1320 before it found support near 1.1280. USD/JPY is currently under pressure and it could continue to slide below 107.80 in the near term.
Important Takeaways for EUR/USD and USD/JPY
- The Euro is holding the 1.1280 support area after a major decline.
- There is a major bearish trend line in place with resistance near 1.1298 on the hourly chart of EUR/USD.
- USD/JPY started a crucial downward move after it failed to clear the 108.50 resistance.
- There was a break below a major bullish trend line with support near 108.15 on the hourly chart.
EUR/USD Technical Analysis
The Euro failed to hold gains above the 1.1400 level and recently started a fresh decline against the US Dollar. The EUR/USD pair traded below the 1.1350 and 1.1320 support levels to enter a bearish zone.
The decline was strong since there was a close below the 1.1320 level and the 50 hourly simple moving average. The pair even spiked below the 1.1280 support area and traded as low as 1.1275 on FXOpen.
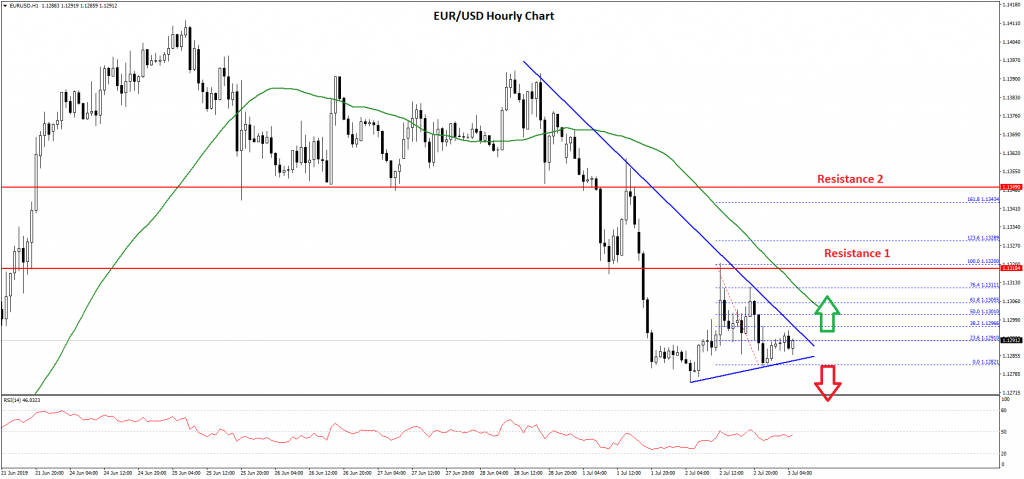
It recently recovered but the 1.1320 level acted as a resistance. Finally, the pair declined again, but the 1.1280 support area is acting as a decent support. It is currently consolidating near the 23.6% Fib retracement level of the recent decline from the 1.1320 high to 1.1282 low.
On the upside, there is a major bearish trend line in place with resistance near 1.1298 on the hourly chart of EUR/USD. Above the trend line, the 1.1300 level and the 50 hourly simple moving average might act as resistances.
Moreover, the 50% Fib retracement level of the recent decline from the 1.1320 high to 1.1282 low is also near the 1.1300 level. If there is an upside break above the 1.1300 level, the price could recover towards the 1.1320 level.
Conversely, if there is no upside break, EUR/USD might slide further below 1.1280. If there is a downside break below the 1.1175 low, there are chances of more losses below the 1.1165 and 1.1150 levels.
USD/JPY Technical Analysis
The US Dollar traded nicely above the 108.00 level until it faced a strong resistance near 108.50-108.60 against the Japanese Yen. The USD/JPY pair failed to continue higher and started a fresh decline.
It broke many supports near the 108.20 level. Moreover, there was a break below a major bullish trend line with support near 108.15 on the hourly chart.
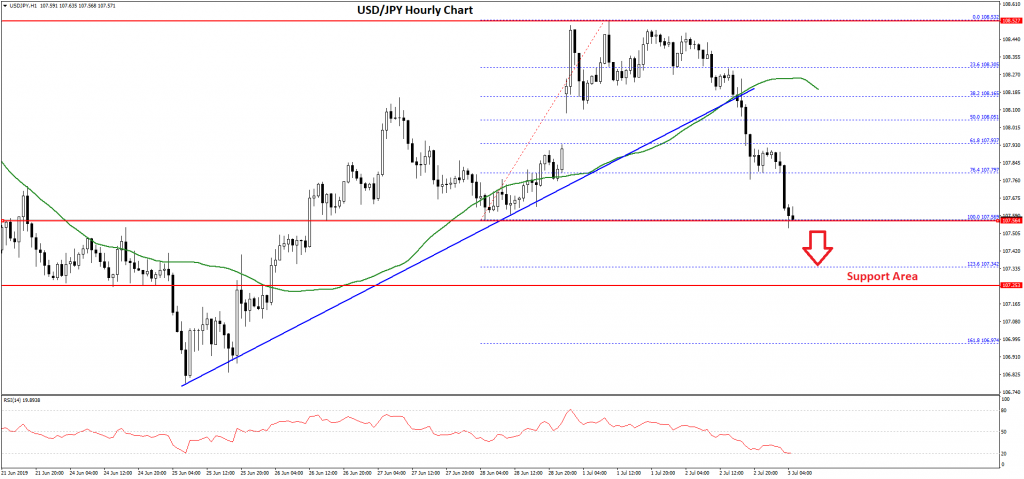
The pair even settled below the 108.00 level and the 50 hourly simple moving average. The decline was such that the pair traded below the 107.80 support plus the 76.4% Fib retracement level of the last wave from the 107.56 low to 108.53 high.
USD/JPY is currently trading near the last swing low at 107.55. If there is a downside break below 107.50, the pair could accelerate losses in the near term.
The next key support could be 107.35 or the 1.1236 Fib extension level of the last wave from the 107.56 low to 108.53 high. If there are more losses, the pair could even test the 107.25 support level.
Conversely, if the pair stays above the 107.50 support, it could start a fresh increase. On the upside, the main resistances are near the 107.80 and 108.00 levels.
USD/CHF Recovery Could Extend Towards Parity
Key Highlights
- The US Dollar started a strong recovery from the 0.9696 low against the Swiss Franc.
- USD/CHF traded above a bearish trend line with resistance near 0.9790 on the 4-hours chart.
- The ISM-NY Business Conditions Index in June 2019 increased from 48.6 to 50.0.
- The US ADP Employment figure could change 140K in June 2019, up from the last 27K.
USDCHF Technical Analysis
After a strong decline, the US Dollar found support near 0.9700 against the Swiss Franc. The USD/CHF pair traded as low as 0.9696 and recently started a strong recovery above 0.9750.
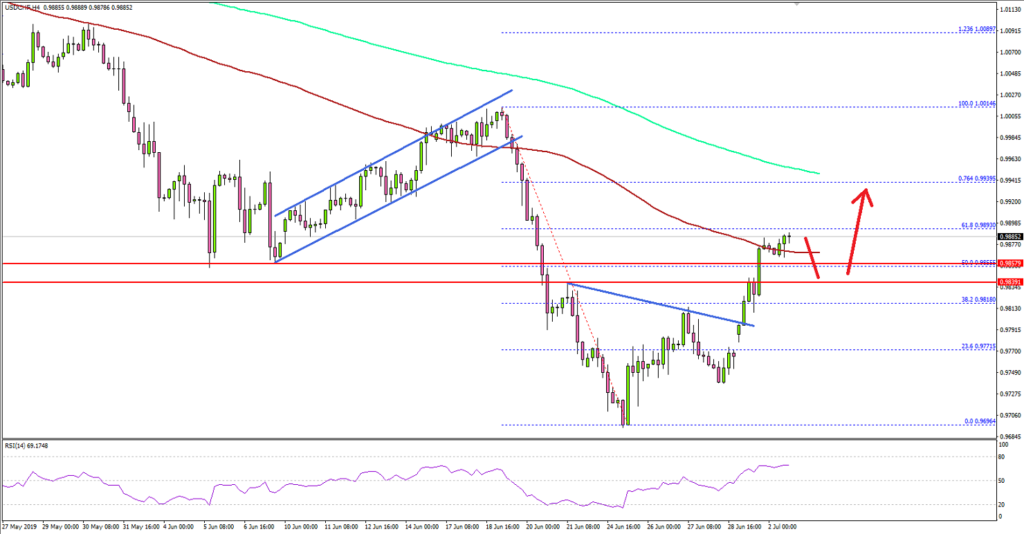
Looking at the 4-hours chart, the pair gained bullish momentum in the past seven days and broke a few important resistances near the 0.9720, 0.9750 and 0.9800 levels.
During the rise, the pair traded above a bearish trend line with resistance near 0.9790 on the same chart. Besides, there was a break above the 0.9840 pivot level plus the 50% Fib retracement level of the last major decline from the 1.0014 high to 0.9696 low.
The pair even surpassed the 0.9880 level and the 100 simple moving average (red, 4-hours). On the upside, the next key resistance is near the 0.9940 level plus the 200 simple moving average (green, 4-hours).
Moreover, the 76.4% Fib retracement level of the last major decline from the 1.0014 high to 0.9696 low is near 0.9939. If the pair clears the 0.9940 resistance, it could extend its recovery towards the parity level (1.0000).
On the downside, an immediate support is near the 0.9850 and 0.9840 levels, below which the pair could correct towards the 0.9800 support area.
Looking at EUR/USD and GBP/USD, there was a downside correction, but both pairs are now approaching a few key supports.
Economic Releases to Watch Today
- Germany's Services PMI for June 2019 – Forecast 55.6, versus 55.6 previous.
- Euro Zone Services PMI for June 2019 – Forecast 53.4, versus 53.4 previous.
- UK Services PMI for June 2019 – Forecast 51.0, versus 51.0 previous.
- US ADP Employment Change June 2019 – Forecast 140K, versus 27K previous.
- US Initial Jobless Claims – Forecast 223K, versus 227K previous.
- US Services PMI for June 2019 – Forecast 50.5, versus 50.7 previous.
- US ISM Non-Manufacturing Index for June 2019 – Forecast 55.9, versus 56.9 previous.
Daily Markets Broadcast
Wall Street consolidates
Tomorrow’s Independence Day holiday kept volumes thin on Wall Street yesterday, with indices hovering close to record levels. Oil tumbled in response to the OPEC production cut extension.
US30USD Daily Chart
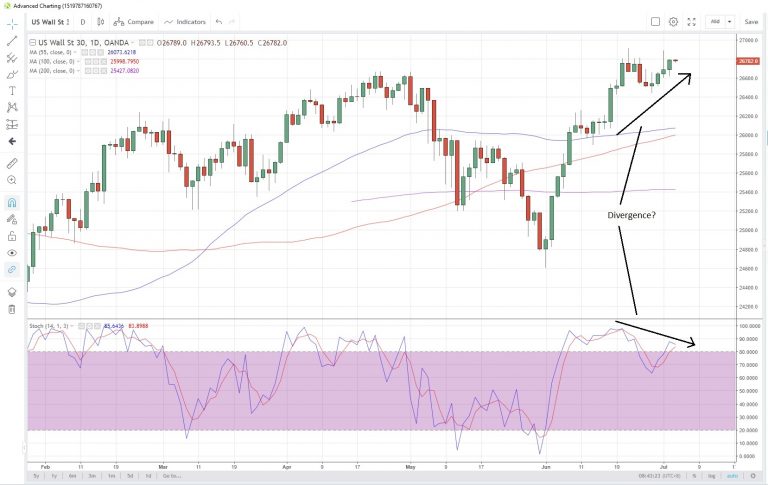
The US30 index rallied for a fourth consecutive day yesterday but still held below last month’s high
The June high at 26.913 and the October high of 26,940 are both still in focus, but possible bearish divergence on momentum indicators suggest they might be unachievable, at the moment
The June ISM non-manufacturing PMI is seen slipping to 55.9 from 56.9 while May factory orders are expected to remain in contraction, with a reading of -0.5% m/m from -0.8% in April.
DE30EUR Daily Chart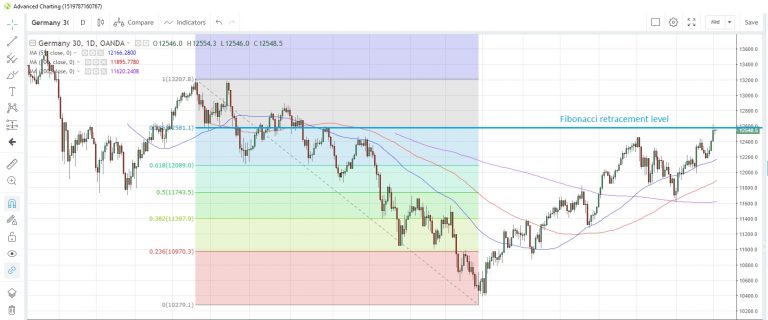
The Germany30 index was little changed yesterday after touching an 11-month high the previous day
The 78.6% Fibonacci retracement of the May-December drop last year at 12,581 continues to hold on a closing basis. The August 2018 high is at 12,599
IMF’s Christine Lagarde has been nominated to take over from Mario Draghi at the ECB, whose term at the helm finishes on October 31. Her nomination needs ratifying by the European parliament.
JP225USD Daily Chart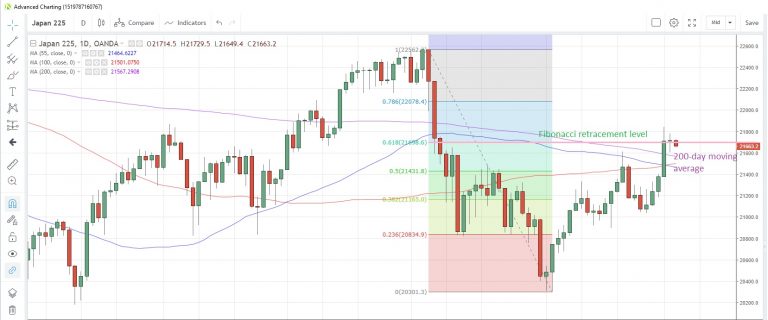
USD/CAD Canadian Dollar Higher As Trade Truce Rally Fades
The Canadian dollar rose 0.1 percent against the US dollar on Tuesday. The Canada day holiday had put the loonie in a vulnerable spot as the G20 wrapped up with Presidents Trump and Xi agreeing to restart negotiations on trade. The outcome was not the best-case scenario for the market as there were no details revealed on when the new rounds will take place, or how far apart both parties are.
Canadian manufacturing is not expanding, with the common thread of contraction that the economies of China and Europe have reported this week. Trade headwinds are to blame for the lack of traction and the prolonged dispute between the US and China has put downward pressure on global growth.
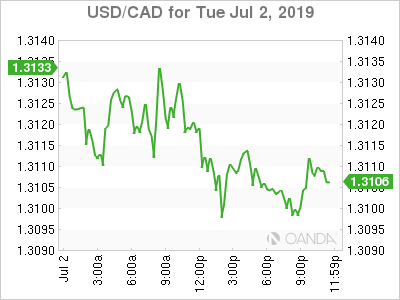
Up ahead for the Canadian currency is the release of the trade balance on Wednesday and employment and PMI data on Friday. Last month, while the U.S. non-farm payrolls (NFP) disappointed with less than 100,000 jobs in the US, the Canadian employment report surprised with a 5X gain even after the monster 106,000 job gain in April. This time around the forecast in the US calls for a rebound after the data miss and Canadian numbers should fall back to reality with 10,000 added positions in June.
The US dollar is on the back foot as the trade win from the G20 is looking more like a tie. Global growth concerns after global manufacturing indicators disappointed and the US opening another trade front after threatening the EU with more tariffs to offset government aid to the aviation industry.
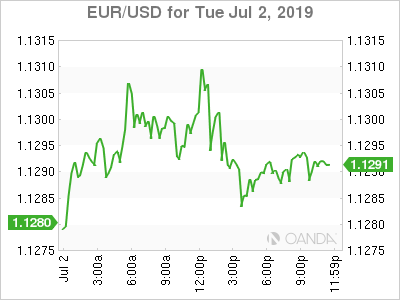
Central banks continue to signal lower rates for longer. The Reserve Bank of Australia (RBA) was the latest to cut its benchmark interest rate but is satisfied with the new level and its optimistic about the economic outlook.
Christine Lagarde of the IMF was nominated to replace Mario Draghi when he steps down at the European Central Bank (ECB) at the end of October.
OIL – Crude Drops on Global Demand Concerns Despite OPEC+ Deal
Oil prices fell hard on Tuesday despite the OPEC+ announcing a 9-month extension for their production cut agreement. Manufacturing data in China and Europe came in below expectations and is putting a huge question mark on energy demand going forward.
The G20 meeting lacked the trade catalyst needed for energy prices to really take off. The meeting between Saudi Arabia and Russia was the most productive sideline event as the OPEC+ extension was announced back then, but without a real breakthrough on the tariff war between the US and China it was not enough.
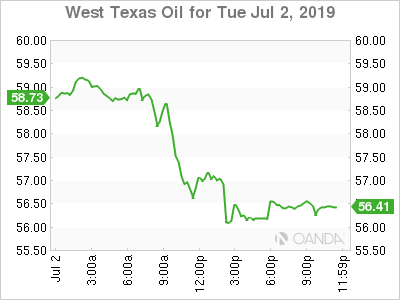
The prolonged trade war is now on ice after both sides agreed to a truce, but the market has seen this before and based on the aggressive demands from the US, it could unravel once again.
Supply data on Wednesday as the EIA published the weekly US crude inventories could show a smaller contraction after two consecutive drawdowns
GOLD – Gold Rebounds as Trade Hopes Fade
Gold rose on Tuesday as the metal once again traded above $1,400 as the G20 trade optimism started to dissipate. Weak global manufacturing and comments from US officials on the length and difficulty of the US-China deal put gold back in play as a safe haven.
The Trump-Xi sit-down had a weaker outcome than expected with negotiations back at square one, and the US taking an aggressive stance while China has signalled it won’t back down, the recipe for long and difficult negotiations. The news that the White House is ready to reopen a trade front as it threatened new tariffs on EU exports was a positive for gold.
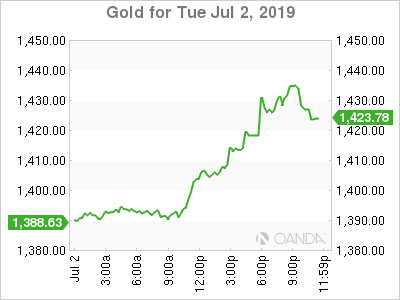
Central banks will not be an obstacle for the yellow metal. The Reserve Bank of Australia (RBA) cut rates on Tuesday to 1 percent and the Fed is expected to cut the benchmark rate at least once this year. Easing monetary policy is back in vogue as global growth has failed to gather momentum.
STOCKS – US Stocks Hit New High Ahead of Short Trading Session
US stocks rose to a new record high, despite concerns about global growth. Safe havens gained ahead of the Fourth of July holiday as trade optimism is beginning to fade as the truce with China is not even a week old and the US is looking for its next trade battle. The dovish turn by the Fed is keeping the dollar under pressure and driving investors to look for more risk as the benchmark interest rate will be lower.
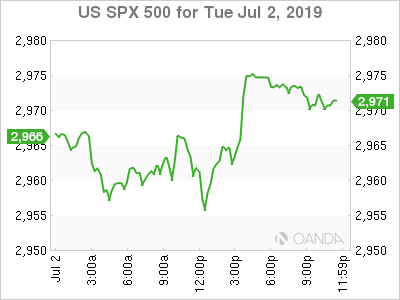
US manufacturing was a pleasant surprise and continues to show the difference in economic growth between the US and other major economies. The US market will close early for the Independence Day celebrations, but traders will be back at the desk for Friday’s U.S. non-farm payrolls (NFP). A rebound of last month’s disappointing report is expected with a gain of 170,000 jobs in June.