Sample Category Title
GBP Ignores Accommodative Monetary Policy
A week has passed since the Bank of England confirmed that it was prepared to keep its bank rate unchanged and that it continues to support a hawkish bias. This along with Fed dovish tone gave GBP/USD a boost as it recovered from lows along with Gilt yield across all maturities. Yet Boris Johnson hard Brexit stance, BoE dovish turn still remain discounted on the foreign exchange market.
The comment on the commitment to “do or die” made by Boris Johnson concerning the European Union 31 October deadline before the last round of elections for the position of British Prime Minister starting on the week beginning 22 July 2019 is not particularly good news for GBP bulls. Furthermore, BoE Governor Mark Carney testimony in front of UK Parliament Treasury Committee is quite revealing as his statement that “some stimulus” (i.e. rate cut) could be deployed if headwinds hurt the economy amid a no-deal Brexit confirms a GBP-bearish bias looking forward.
GBP/USD has been bouncing from 1.2534 (17/06/2019 low), a 6-month low and is currently trading sideways ahead of US May PCE data released on Friday as well as G20 summit.
EUR/USD Tests 55– And 100-Hour SMAs
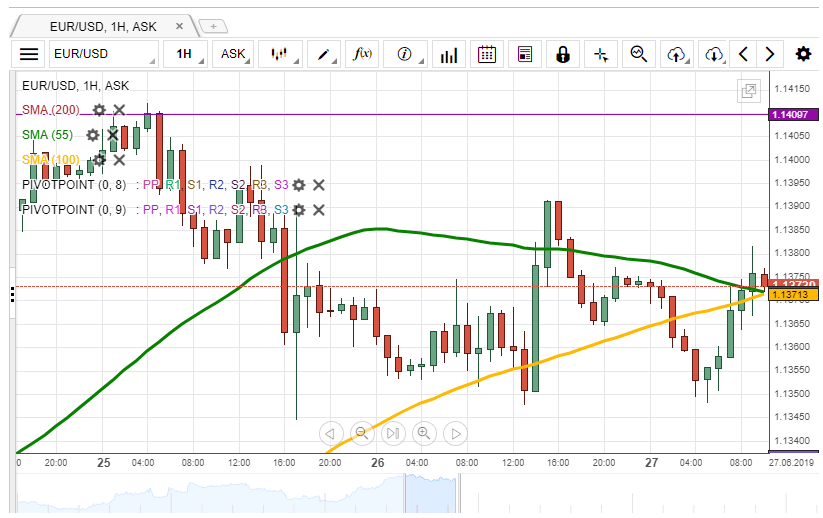
On Wednesday, the EUR/USD currency pair traded sideways around the psychological level at the 1.1370 mark. During today's morning, the pair was trying to surpass the 55– and 100-hour SMAs, currently located circa 1.1370.
If the given resistance holds, it is likely, that a reversal south could occur in the nearest future. In this case, the exchange rate could be supported by the monthly R2 at 1.1338.
If the given moving averages do not hold, the pair could extend gains. A possible upside target is the resistance level formed by the monthly R3 at 1.1412
GBP/USD Could Trade Sideways
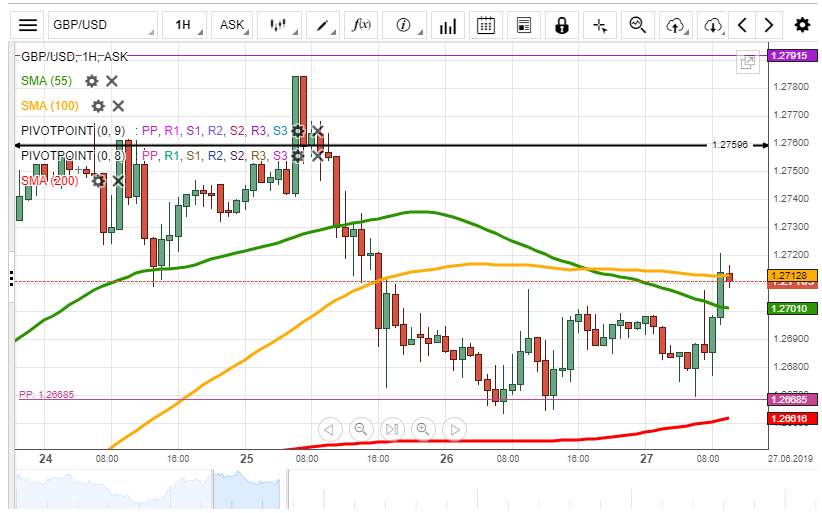
During the previous trading session, the GBP/USD exchange rate traded sideways between the 1.2700 level and the weekly PP at 1.2669.
Note, that the rate is pressured by the 55– and 100-hour SMAs, currently located circa 1.2710. Thus, it is unlikely, that some upside potential could prevail in the market.
It is expected, that the currency pair could continue to trade sideways between the given resistance and support levels in the nearest future.
Also, it is unlikely, that the pair could drop lower than 1.2660 due to the support level formed by the 200-hour SMA.
USD/JPY: Two Scenarios Likely
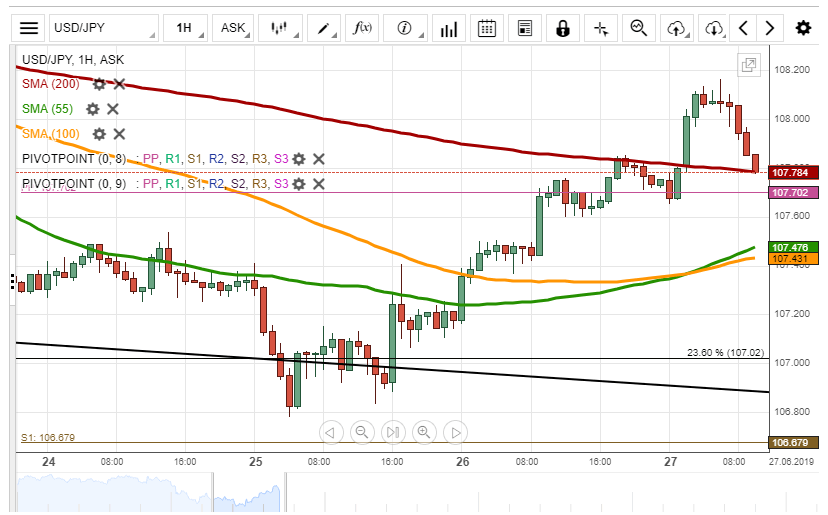
During Wednesday, the USD/JPY currency pair increased to the 107.80 level. During today's morning, the pair exceeded the psychological level at 108.00.
Note, that the exchange rate is supported by the 200-hour moving average, currently located at 107.79. Thus, it is likely, that bulls could continue to prevail in the market. A potential upside target is the resistance level formed by the weekly PP and the Fibonacci 38.30% retracement at 108.44.
On the other hand, bears could prevail in the market in the nearest future, and the rate could reverse south. It is unlikely, that the pair could tumble lower than 107.43 mark due to the support level formed by the 55– and 100-hour SMAs.
XAU/USD Likely To Trade Down
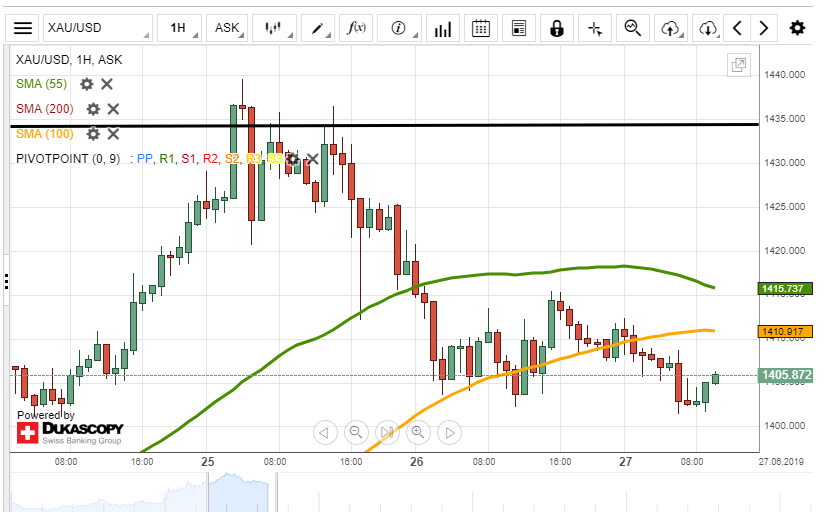
Yesterday, the XAU/USD exchange rate traded sideways around the psychological level at 1,410.00.
Given, that the rate is pressured by the 55– and 100-hour SMAs, currently located at 1,410.93 and 1,416.08 respectively, it is expected, that gold could depreciate against the US Dollar. A possible downside target is the psychological level at 1,390.00.
On the other hand, the exchange rate could continue to trade sideways in the short term, trying to surpass the given moving averages.
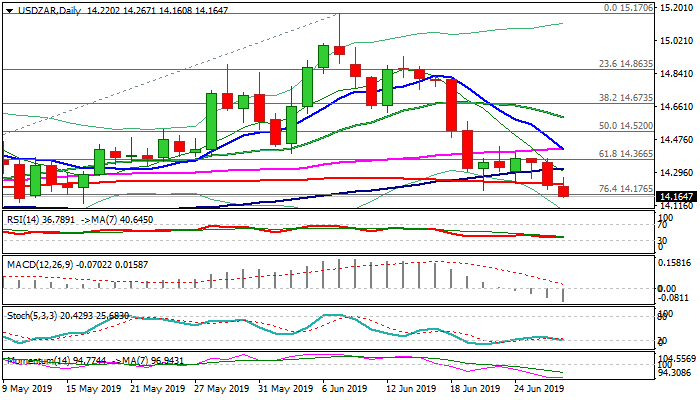
USD/ZAR Outlook: Bears Pressure Higher Base At 14.13 After Break Below 200SMA
The pair remains in red on Thursday and extends below 200 SMA (14.23), following Wednesday’s clear break through thin daily cloud and marginal close below 200SMA, after the moving average contained several attacks during past five days.
ZAR benefits from positive tone around US/China trade talks and awaiting the meeting of two leaders on G20 summit for fresh signals.
Extension below 200SMA pressures higher base at 14.13 (10/16 May lows), with break here to expose round-figure 14.00 support and unmask key level at 13.86 (11 Apr trough).
Strong bearish momentum on daily chart supports the action, with firm bearish bias expected to remain intact while the price holds below 200SMA.
Res: 14.17, 14.23, 14.26, 14.31
Sup: 14.13, 14.00, 13.92, 13.86
Markets Provoke The Fed, Brent Breaks Away
The US-China deal has been perhaps one of the most discussed topics in recent weeks. However, only a few days before the decisive meeting (which, it seems, will fail to solve anything), markets received the comments of US Treasury Secretary Steven Mnuchin. Yesterday, he made quite a confident assumption that the deal is around 90% complete. Certainly, the markets still do not know if this is the case or not, but they are already in a hurry to react to such a comment in the stock prices.
In the first half of Wednesday’s session, the stock markets were stimulated to increase due to the unexpectedly disappointing data for durable goods orders in May. Despite being forecast to rise by 0.3%, the indicator declined by 1.3%. This would seem to be a negative factor, but investors caught that signal to show the Fed that there are no more reasons to stand aside and not reduce the rate. Therefore, yesterday, the markets tried to create conditions that would have provoked the regulator to that definite decision. However, the Federal Reserve representatives are still looking at such attempts without a great deal of enthusiasm.
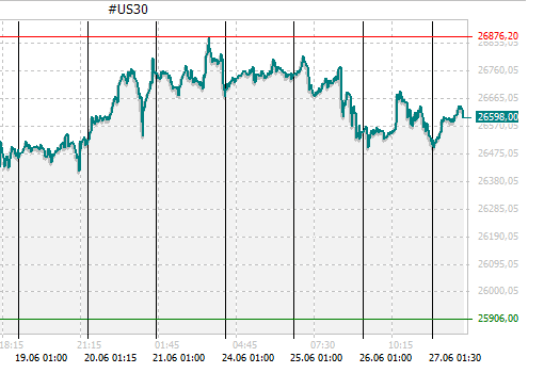
As a result, by the end of the session, the NASDAQ was the only American index that grew by 0.32%: the fundamental picture was supported by the corporate report of Micron Technology Inc. and its shares soared in price by 13.34%. However, there was not enough positive news for the DJIA (-0.04%, up to 26536.82), or for the S&P500 (-0.12%, up to 2913.78).
Since yesterday evening, September Brent futures have adjusted in price and is now trading at around $65.28 – demonstrating the night gaps. However, there is no reason for concern, given that over the past week Crude oil has risen in price by 10%. On Wednesday, for example, an impressive passage from $63.54 to $65.87 was made due to weak US weekly inventory data, which fell by 12.8 million barrels to 469.6 million. Such a fall was due to a decrease in the daily volume of energy imports by 812K barrels per day.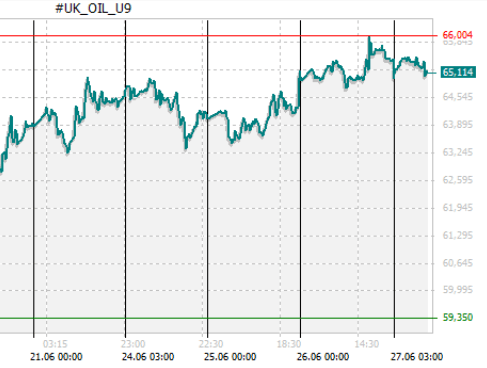
As mentioned by the FxPro Analyst team, the reaction of the dollar today should be monitored during the publication of news in the United States: a GDP 1Q data revision and the primary applications for unemployment benefits. Also, there will be statistics on the unfinished sales in the US real estate area.
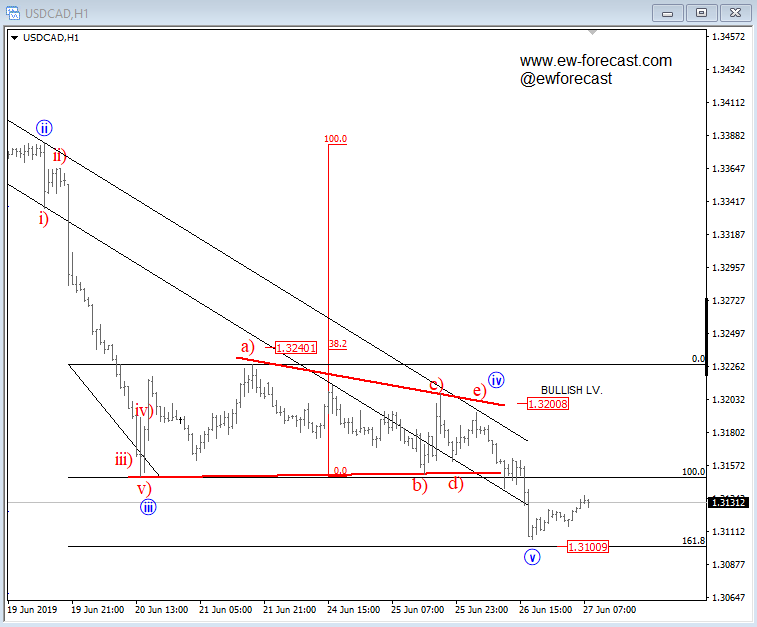
Elliott Wave Analysis: USD/CAD And OIL Facing Reversals!
USDCAD perfectly hit 1.3100 target for wave »v« and at the same time even a negative correlated market crude oil can be approaching 5th wave, so we would not be surprised if we see some reversals at least in three waves. However, to confirm a potential pullback, USDCAD needs to turn back above 1.3200 region, while crude oil bears may show up only if we see a drop below 55 region.
USDCAD, 1h
Crude oil, 1h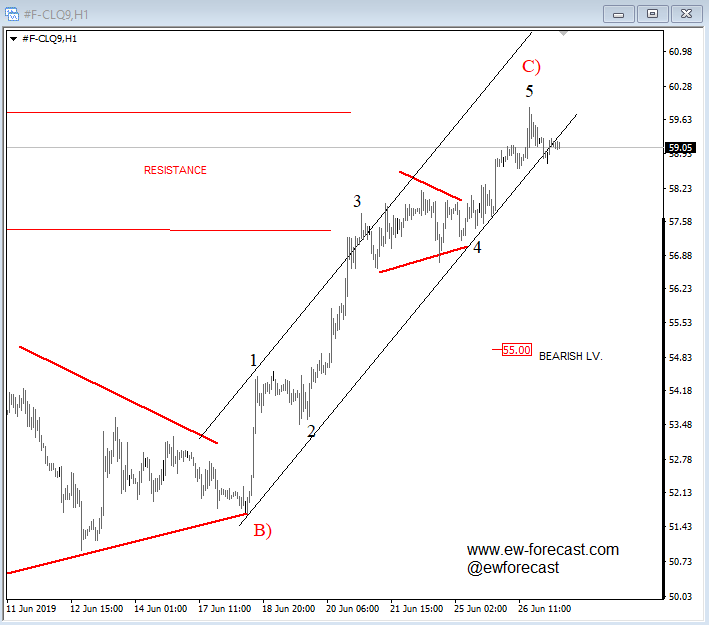
USDJPY 109.00 Major Resistance
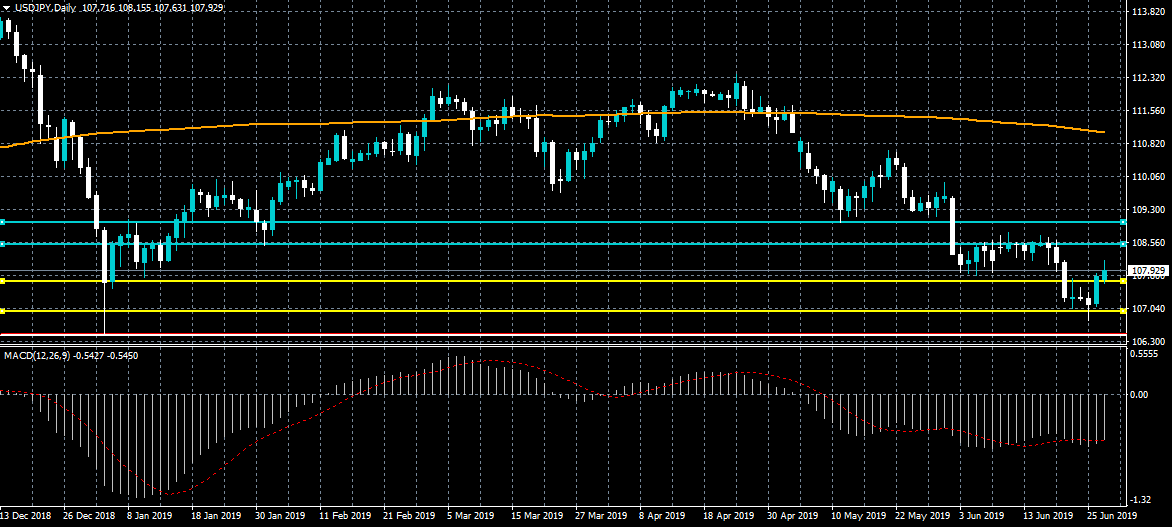
The US dollar briefly moved above the 108.00 level against the Japanese yen as risk-on trading sentiment improves ahead of the G20 leaders meeting. The USDJPY pair could test the 109.00 resistance level if the 108.55 level is broken over the coming sessions. Sustained weakness below the 107.80 support level will provide a clear trading signal that the technical correction is over.
The USDJPY pair is only bearish while trading below the 107.80 level, key support remains at the 107.00 and 106.40 levels.
If the USDJPY pair trades above the 107.80 level, key technical resistance remains at the 108.55 and 109.00 levels.
EURUSD Key Moving Average Holds
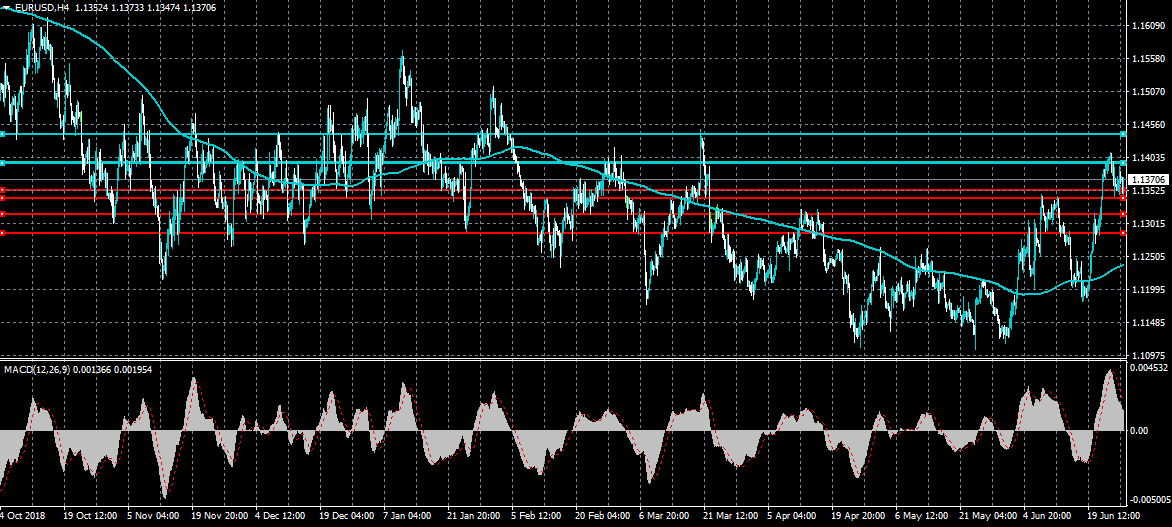
The euro has held key support against the US dollar during the European trading session, with the pair once again bouncing from the 1.1347 level. US GDP and Housing data are next market movers for the EURUSD pair, with a clear break of the 1.1347 to 1.1400 range now needed. Technical indicators on the four-hour time frame have now corrected from extreme overbought levels.
If the EURUSD pair trades above the 1.1400 level, key technical resistance is found at the 1.1440 and 1.1500 levels.
If the EURUSD pair trades below the 1.1347 level, key support is found at the 1.1321 and 1.1290 levels.