Sample Category Title
G20: Abe and Xi agreed to promote free and fair trade
Japanese Prime Minister Shinzo Abe and Chinese President Xi Jinping held bilateral meeting today, ahead of G20 leaders summit that starts tomorrow. Both sides agreed to work together to promote "free and fair trade". A wide range of topics were also discussed.
Xi said the G20 summit will be held "against the backdrop of an increasingly complicated world economic situation." He added I strongly hope the summit will form shared views and send out a clear message to protect multilateralism and free trade." Abe also said he welcomes the"new developments" in relationship with China that is based on the principles of "promoting free and fair trade."
Deputy Chief Cabinet Secretary Yasutoshi Nishimura noted that Abe urged Xi to maintain the free and open society, one-country, two systems with Hong Kong. This is a response to highly controversial extradition bill that prompted a March of 2 millions Hongkongers against the bill. Also, a world wide newspaper ad campaign is launched by Hong Kong activities, urging G20 leaders to stand by them to defend Hong Kong's freedoms and autonomy.
According to Nishimura, Abe also asked Xi to "exercise self-restraint over its activities" around the Japan-held Senkaku islets in the East China Sea and emphasized the importance of demilitarization of disputed islands in South China Sea.
Brent Crude – Has the Rally Run its Course?
Can oil continue to rally?
Prior to the latest eruption in the crypto space, Brent crude (oil) was looking like the volatile player in the market but these moves pale in comparison.
Oil prices have sprung back to life over the last couple of weeks, aided this week by huge inventory drawdowns, as reported by API and then to an even greater extent by EIA, who reported the largest reduction in stocks in almost three years.
Whether prices can continue to rise will likely depend on how the meeting in Osaka goes over the next couple of days. Global growth risks are a major downside risk for oil prices, although they have been overshadowed the last couple of weeks by geopolitical flare ups, inventory declines and the prospect of an OPEC+ cut extension. I do wonder whether recent price action may put that at risk next week though.
Brent Daily Chart
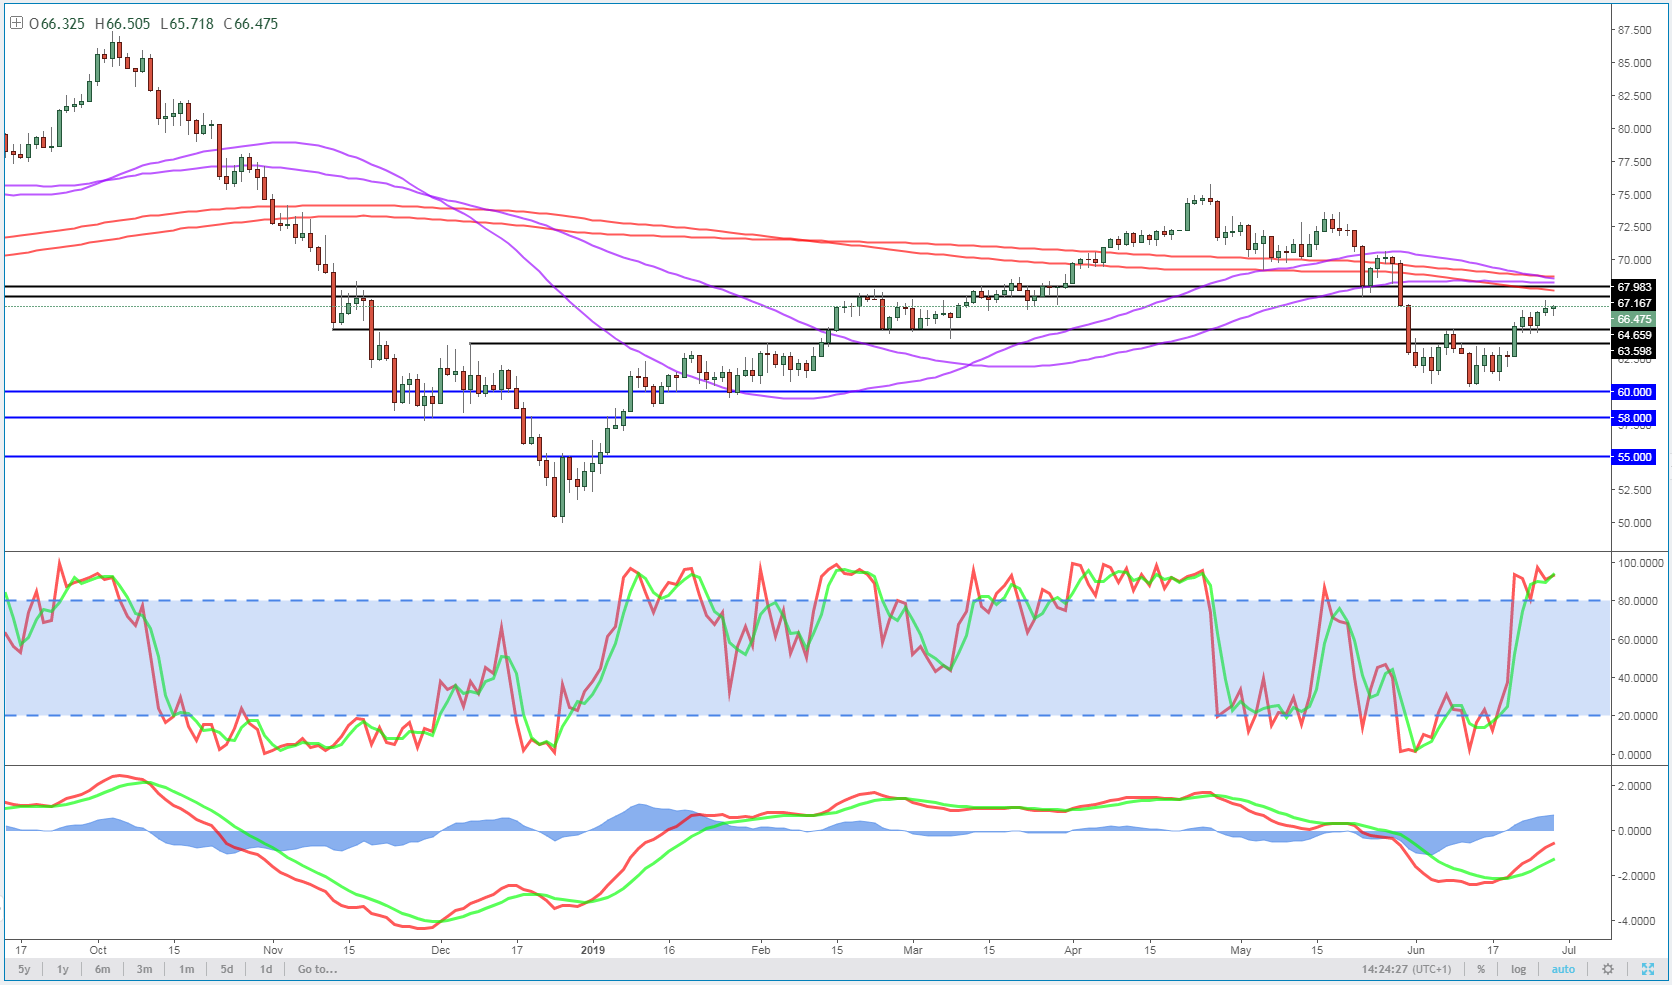
As previously suggested, $67-68 looks to be providing some resistance to the rally, with it having stalled a little again yesterday. The momentum indicators still look healthy on the daily chart though so we may see further runs at this area.
Brent 4-Hour Chart
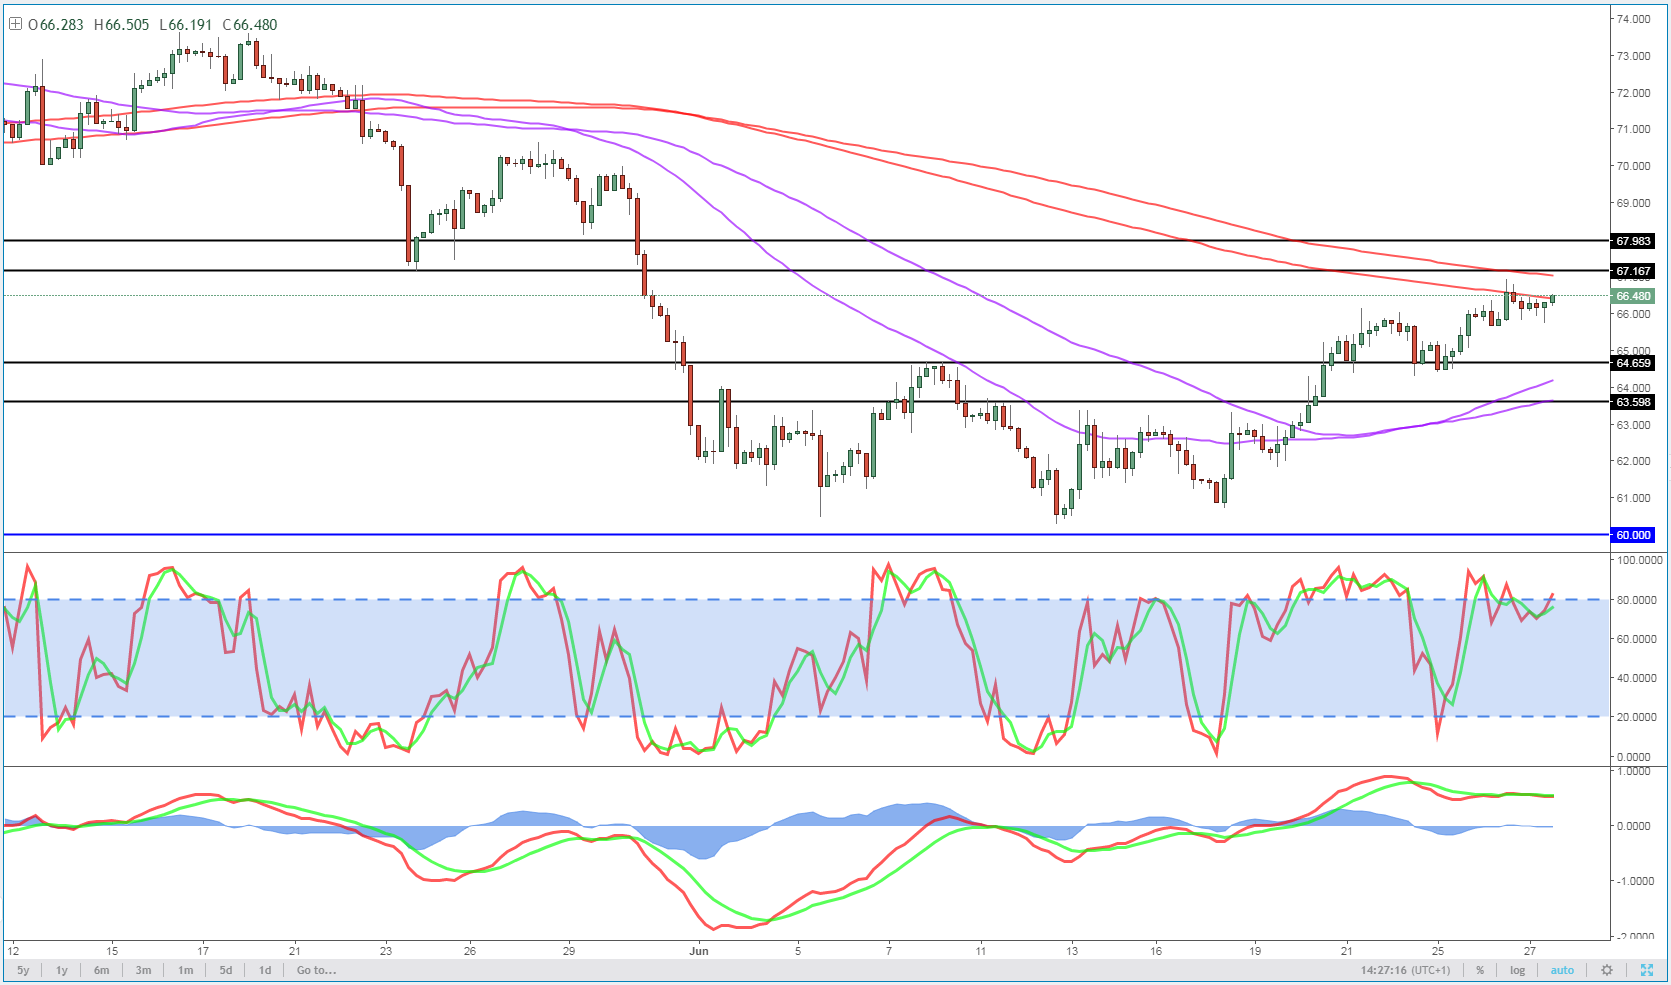
The 4-hour chart looks less convincing, with both the MACD and stochastic diverging from price, indicating a weakening of the near-term trend. This comes around the 200/233-period simple moving average band which may be contributing to the softening in the rally.
Bitcoin Rises Fast and Falls Hard
We’re getting an early reminder today that bitcoins extreme volatility works both ways, with the cryptocurrency tumbling more than 10% and extending it’s losses since peaking yesterday to almost 20%.
The sudden plunge has been widely attributed to another crash, that of Coinbase, the US crypto trading platform. Perhaps this was just a convenient opportunity to lock in some profits or maybe it’s a reminder just how influential one exchange is and therefore how sensitive prices are to these kinds of outages. Maybe both of these are true but it will be interesting to see just how quickly prices recover.
This is a wild market and I wouldn’t be surprised if bitcoin ends the day in the green. Even if it doesn’t, the coming days will likely be no less eventful which usually means large moves. Today strikes me as more of a setback than a game-changer, we only briefly traded below yesterday’s open, that doesn’t suggest to me that traders are completely panicking yet.
That said, one thing that’s always been clear about bitcoin is that it’s very unpredictable, especially during it’s most volatile periods. I expect this will be no different.
Elliott Wave UPDATE: EURNZD Approaching 1.685 Zone!
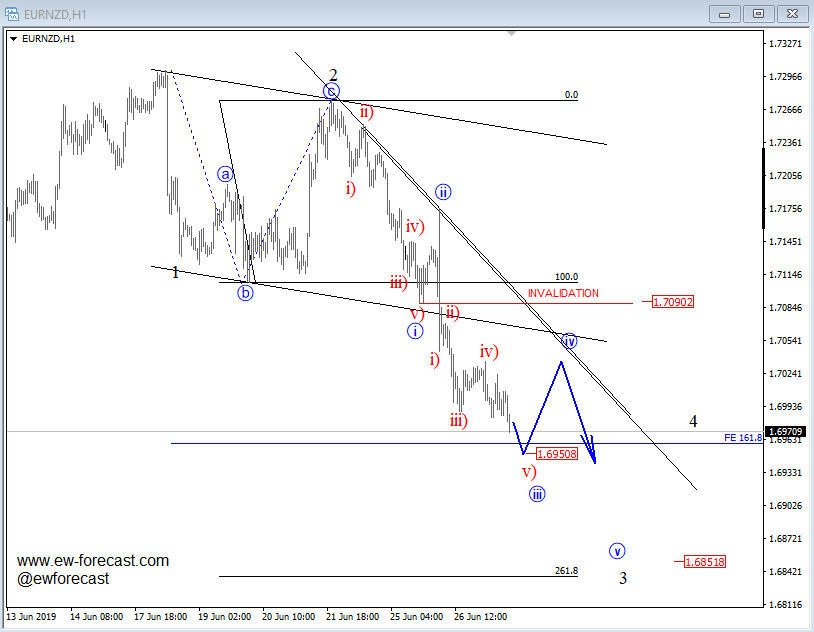
EURNZD is dropping in an impulsive manner from the 1.727 region, where a higher degree wave 2 correction had found resistance. We are specifically tracking sub-wave iii of 3, which can be near completion, and can look for support, and a turn into a corrective wave iv near the 1.695 zone. Wave iv correction can take price temporarily higher, towards potential resistance zone around 1.702/1.705 region, from where final bearish leg as wave v may resume.
EURNZD, 1h
Sunset Market Commentary
Markets
Risk sentiment remains fragile with markets particularly sensitive to trade related news. Constructive headlines suggesting a US/Sino trade truce would be announced at the G20 summit initially supported core bond yields. Sentiment dented later on after the Wall Street Journal reported President Xi will present Trump the terms he wants the US to meet before the trade dispute can be settled. Investors worry this might complicate the already difficult expected talks even further. The US yield curve bull steepens with the wings marginally outperforming the belly. Yields change -2 bps (2-yr) to -1.7 bps (30-yr). The German yield curve also shifts south, facing additional pressure from today’s inflation numbers. Regional German data initially suggested an uptick of inflation in June but the harmonized figure eventually showed a meagre 0.1% MoM (vs. 0.3% in May) or 1.30% YoY (stable). Yields slip about 1 to 1.5 bp at the longer end of the curve. Peripheral yield spreads widened with Spain (+ 3 bps) underperforming. Italy (+ 1bps) couldn’t really profit from a 10-yr and 5-yr auction gone well.
Global markets are captured in an erratic trading dynamics as investors don’t know what to expect of the meeting between presidents Trump and Xi-Jinping and of the G20 event in general. This unstable pattern was also visible in EUR/USD. EMU data caused some additional intraday noise. The dollar initially profited from hopes on a trade truce and higher US yields in early European dealings. EUR/USD gained modest ground as German regional CPI data printed higher than expected. Poor EC EMU confidence had only limited impact. Later, risk sentiment turned more fragile, weighing on US yields and on the dollar. The final overall German CPI showed a discrepancy between domestic data (1.6% Y/Y) and the harmonized CPI (1.3%), leaving euro traders further in doubt. EUR/USD came off the intraday peak. US data (GDP revision and jobless claims) were mixed with activity indicators slightly disappointing but PCE deflators stronger than expected. They had had little impact on trading. EUR/USD is trading in the 1.1365/70 area. USD/JPY trades near 107.85/90. USD trading remains highly conditional on what will happen this weekend, but for now the USD rebound didn’t go far.
EUR/GBP trading developed in a very tight sideways range in the mid 0.89 area. There were no important UK eco data. The usual Brexit-noise also failed to guide intraday sterling trading. PM frontrunner Johnson said that members of his cabinet will have to be committed to the UK leaving the EU by 31 October, with or without a deal. On the other hand, UK PM May indicated that she could join UK conservative MP’s who are trying to prevent a chaotic no deal Brexit. This time, the comments had little impact on sterling trading. EUR/GBP is changing hands in the 0.8960 area. Cable is trading near 1.27.
News Headlines
Turkish lawmakers are preparing a bill that would allow the central bank to transfer more of its lira reserves to the nation’s Treasury, Bloomberg reported. The ruling party held back from proposing a similar law some weeks ago out of fear for it could further roil financial markets amid heightened lira volatility.
The European car lobby (ACEA) slashed its passenger car registrations from a 1% rise to a 1% decline for 2019, citing slower growth and uncertainty over Brexit. Car sales are now expected to just exceed 15 million this year. Production of passenger cars dropped 1.4% in 2018, the ACEA added.
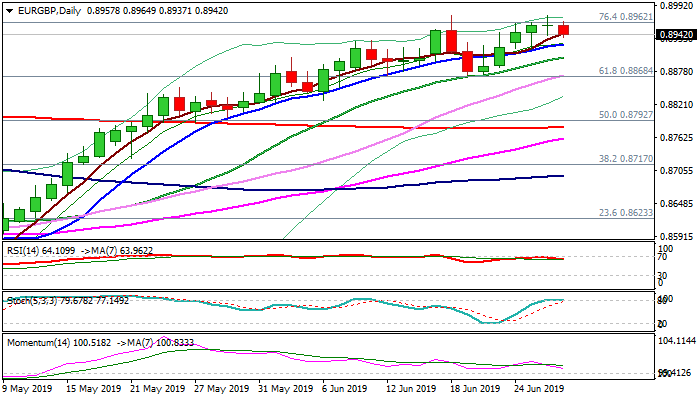
EUR/GBP Outlook: Near-Term Directionless Mode May Extend after Repeated Rejection at Range Top
The uptrend from early May's low at 0.8489 shows initial signs of stall, following repeated rejection at 0.8975 (also 18 June high). Wednesday's Doji candle signaled indecision, while today's action remains in red and supports negative signals. South-heading momentum and RSI and stochastic reversing from overbought territory add to scenario. However, there is a long way for reversal confirmation, as the action in past two weeks held within 0.8975/0.8872 range, with range floor marking pivotal support, loss of which is needed to confirm double-top and generate initial signal for deeper correction of 0.8489/0.8975 ascend. Fresh easing faces solid supports at 0.8924 (rising 10SMA) and 0.8902 (rising 20SMA) and needs to break both supports for attack at 0.8872 pivot. Otherwise, extended consolidation with existing larger bullish bias could be expected while the price holds within 0.8975/0.8872 range.
Res: 0.8962; 0.8975; 0.9000; 0.9061
Sup: 0.8924; 0.8902; 0.8872; 0.8861
USD/JPY Mid-Day Outlook
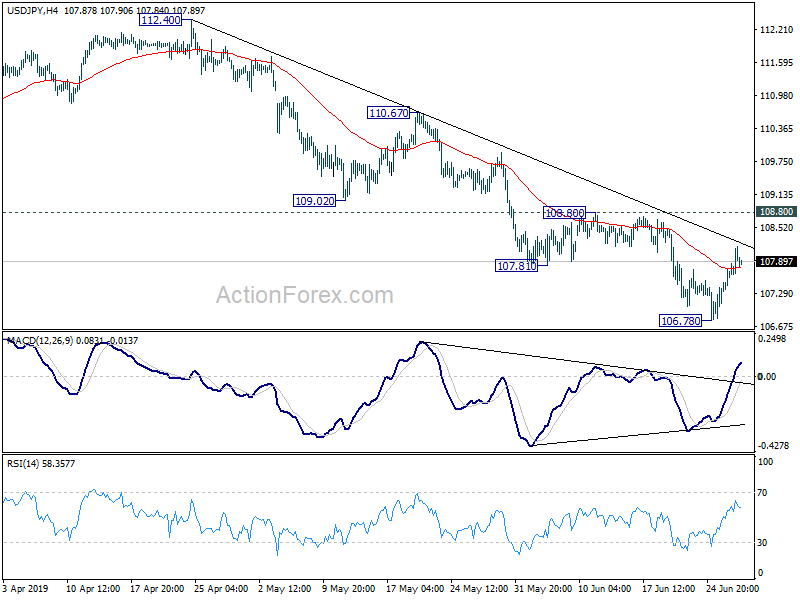
Daily Pivots: (S1) 106.82; (P) 107.12; (R1) 107.45; More...
Intraday bias in USD/JPY remains neutral for the moment. With 108.80 resistance intact, near term outlook stays bearish for further decline. On the downside, break of 106.78 minor support will resume from 112.40 to retest 104.69 low. However, firm break of 108.80 will indicate short term bottoming and turn bias to the upside for 110.67 resistance instead.
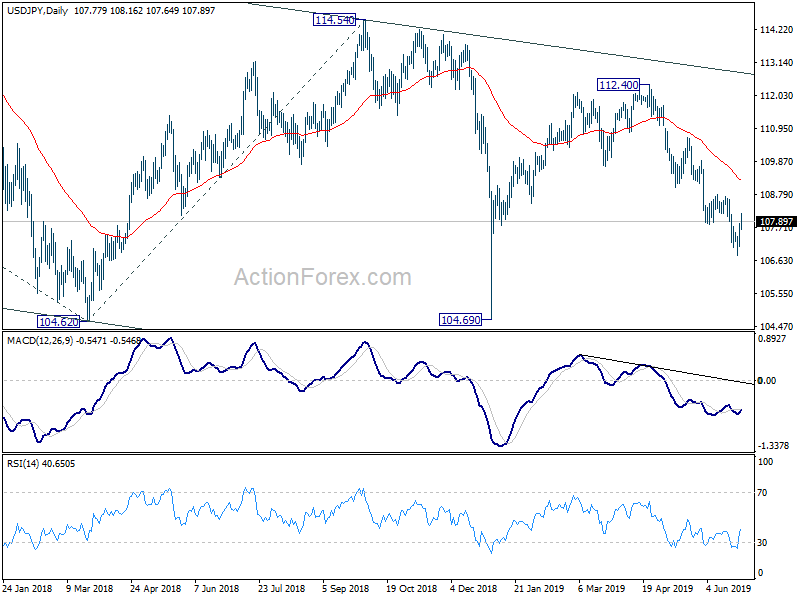
In the bigger picture, decline from 118.65 (Dec 2016) is still in progress, with the pair staying inside long term falling channel. Break of 104.62 will target 100% projection of 118.65 to 104.62 from 114.54 at 100.51. For now, we'd expect strong support above 98.97 (2016 low) to contain downside to bring rebound.
USD/CHF Mid-Day Outlook
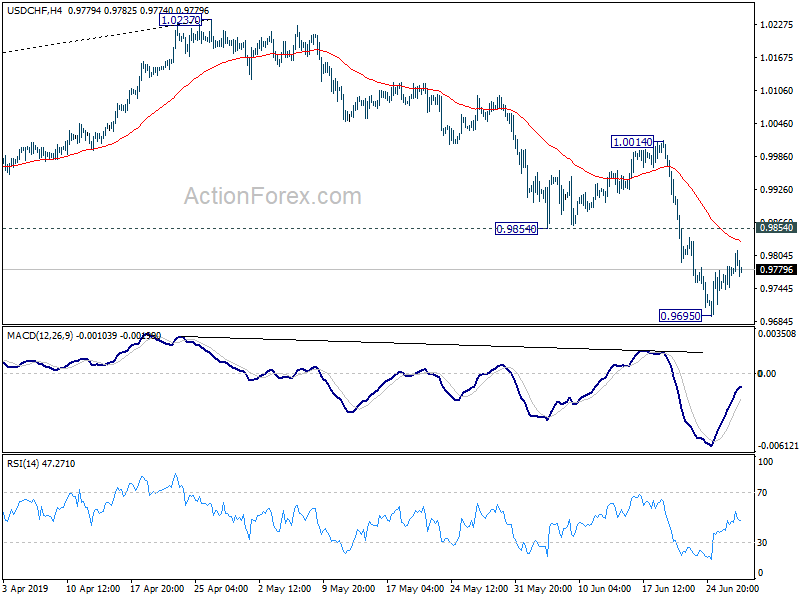
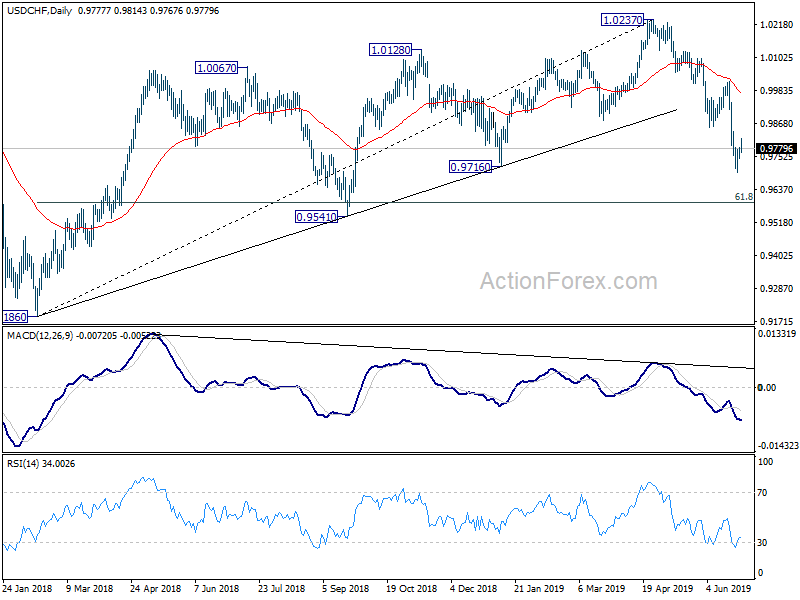
Daily Pivots: (S1) 0.9752; (P) 0.9768; (R1) 0.9796; More...
Intraday bias in USD/CHF remains neutral for the moment. With 0.9854 resistance intact, further decline is expected. On the downside, break of 0.9695 will resume the fall from 1.0237 to 0.9587 fibonacci level. Nevertheless, break of 0.9854 will indicate short term bottoming and target 1.0014 resistance instead.
In the bigger picture, current development confirms that up trend from 0.9186 (2018 low) has completed at 1.0237 already. With 38.2% retracement of 0.9186 to 1.0237 at 0.9836 taken out, deeper fall should be seen to 61.8% retracement at 0.9587 and below. We'd pay attention to bottoming signal below 0.9587.
EUR/USD Mid-Day Outlook
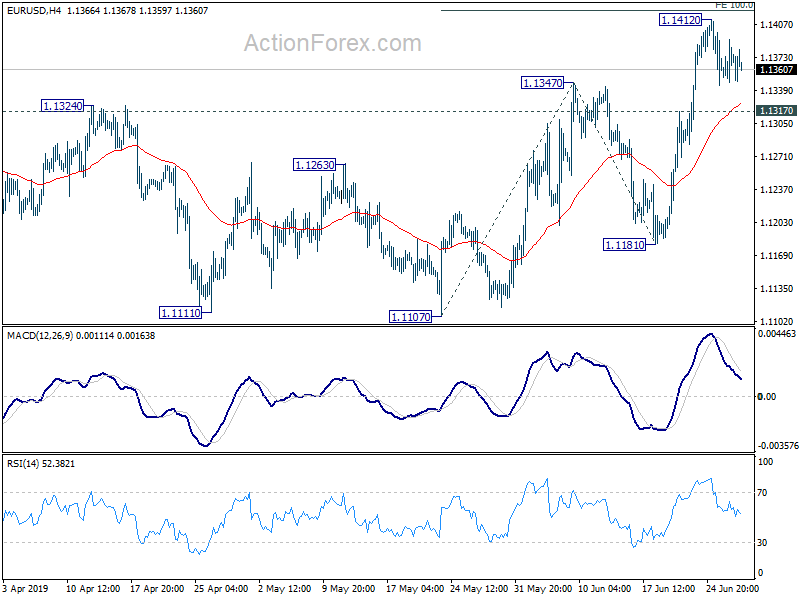
Daily Pivots: (S1) 1.1346; (P) 1.1369; (R1) 1.1390; More......
EUR/USD is staying in tight range below 1.1412 and intraday bias remains neutral first. With 1.1317 minor support intact, another rise remains mildly in favor. On the upside, break of 100% projection of 1.1107 to 1.1347 from 1.1181 at 1.1142 will pave the way to 161.8% projection at 1.1569 next. However, firm break of 1.1317 will be an early sign of completion of rise from 1.1107. Intraday bias will be turned back to the downside for 1.1181 support instead.
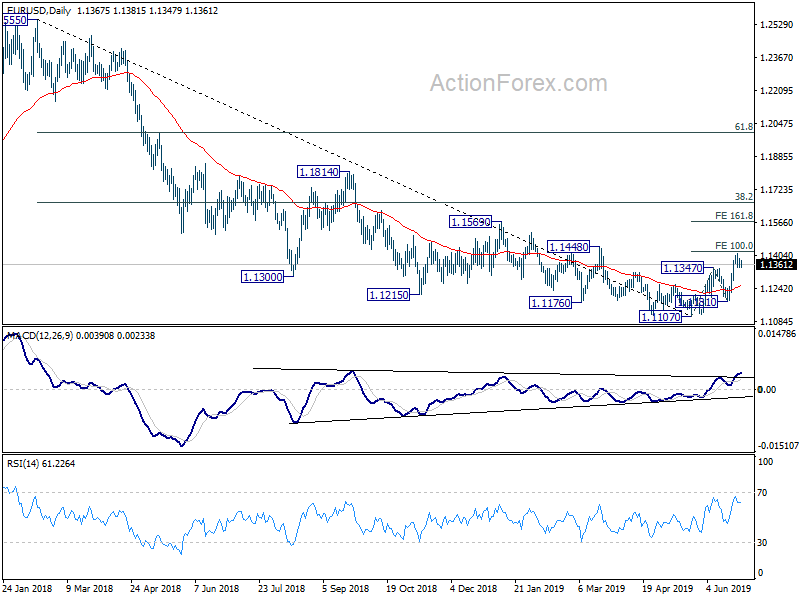
In the bigger picture, considering bullish convergence condition in daily and weekly MACD, a medium term bottom should be in place at 1.1107 after hitting 61.8% retracement of 1.0339 (2016 low) to 1.2555 (2018 high) at 1.1186. Further rise should be seen to 38.2% retracement of 1.2555 to 1.1107 at 1.1660. Reactions from there could indicate whether rebound from 1.1107 is a corrective rise or reversing medium term trend.
GBP/USD Mid-Day Outlook
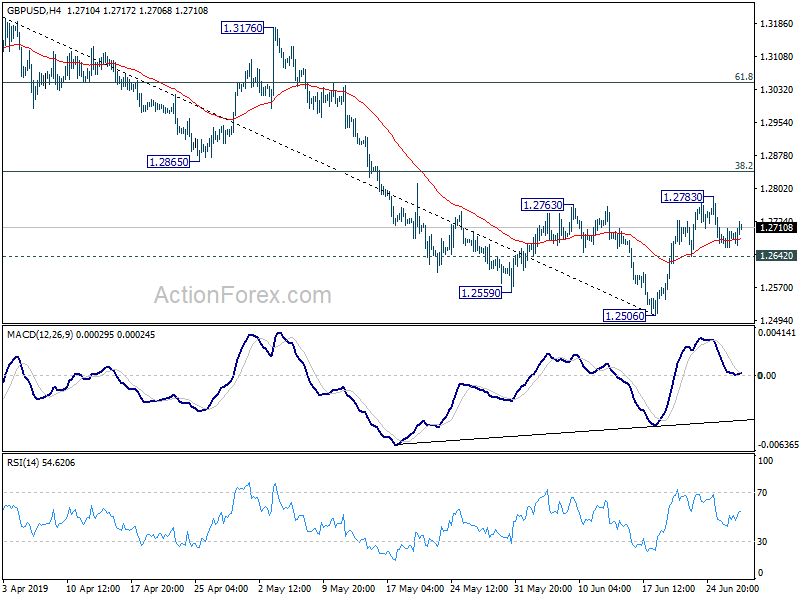
Daily Pivots: (S1) 1.2664; (P) 1.2664; (R1) 1.2709; More....
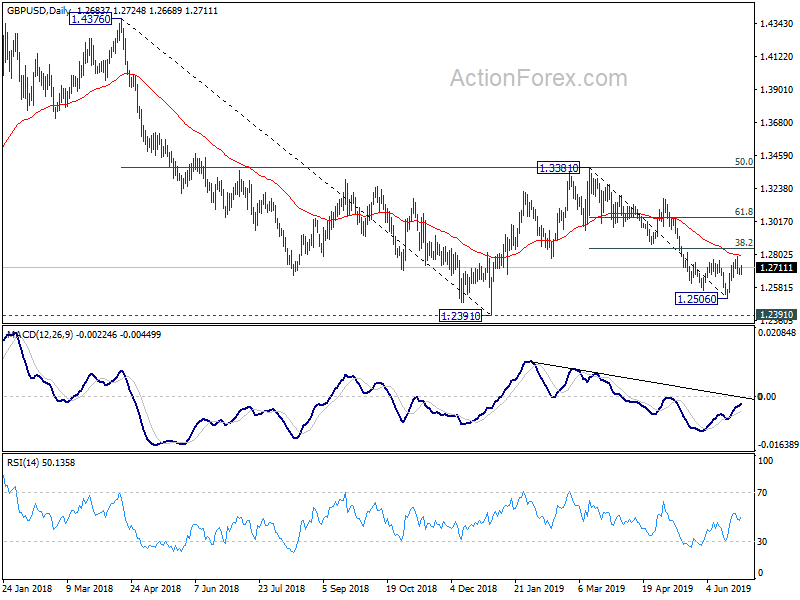
GBP/USD recovers mildly after drawing support from 4 hour 55 EMA. Intraday bias remains neutral and outlook is unchanged. With 1.2642 minor support intact, corrective rebound from 1.2506 could still extend higher. But upside should be limited by 38.2% retracement of 1.3381 to 1.2506 at 1.2840. On the downside, break of 1.2642 minor support will turn intraday bias back to retest 1.2506 low. However, sustained break of 1.2840 will bring stronger rise to 61.8% retracement at 1.3047 next.
In the bigger picture, down trend from 1.4376 (2018 high) is still in progress. Break of 1.2391 would target a test on 1.1946 long term bottom (2016 low). For now, we don't expect a firm break there yet. Hence, focus will be on bottoming signal as it approaches 1.1946. In any case, medium term outlook will stay bearish as long as 1.3381 resistance holds, in case of strong rebound.