

Sample Category Title
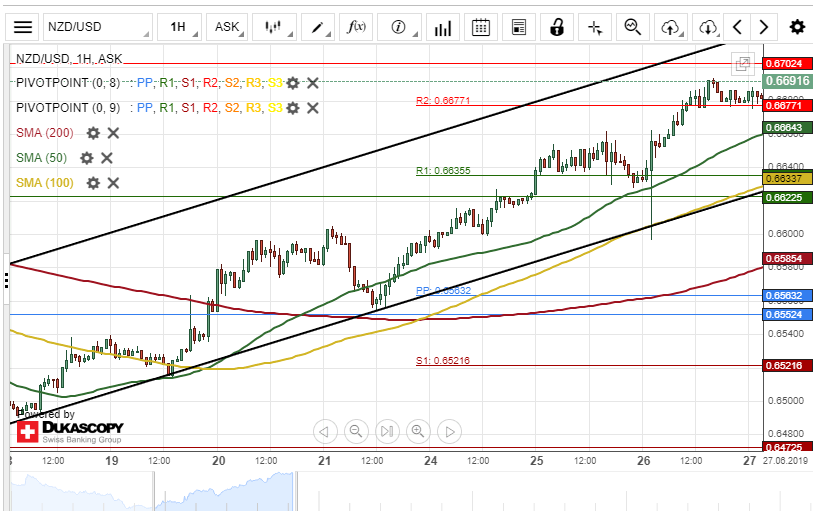
NZD/USD Targets At 0.6720
The New Zealand Dollar appreciated about 61 base points against the US Dollar on Wednesday. The currency pair was guided by the 50-hour simple moving average during Wednesday's trading session.
The weekly R2 at 0.6677 was providing support for the exchange rate during the European trading session on Thursday. If this support level holds, bullish traders will aim for the upper boundary of an ascending channel pattern at 0.6720 within this session.
However, if the currency exchange rate breaks the support level, a decline towards the weekly R1 at 0.6635 could be expected today.
EUR/JPY Tests Weekly R2 At 122.88
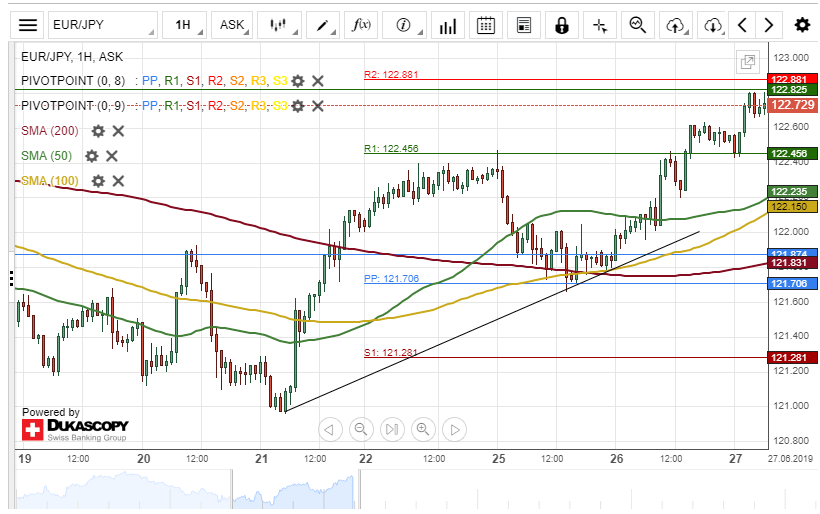
The Eurozone single currency bounced off the 50% Fibonacci retracement level at 121.70 on Wednesday. As a result, the currency pair appreciated about 85 base points during yesterday's trading session.
The exchange rate is currently testing a resistance level formed by the weekly R2 at 122.88.
If the currency exchange rate breaks the weekly resistance level as mentioned earlier, a surge towards a swing high at 123.18 could occur.
On the other hand, if the weekly R2 holds, a retracement towards a support cluster formed by the 50– and 100-hour SMAs at 122.18 might be expected.
AUD/USD Likely To Maintain Channel
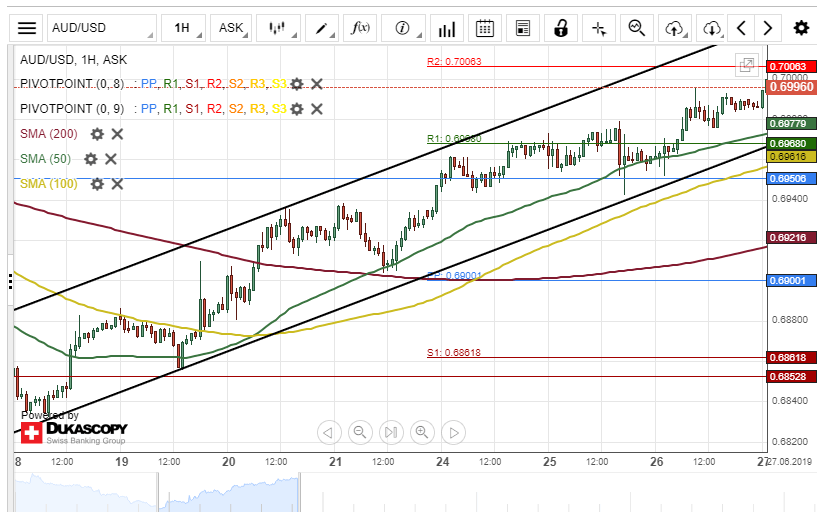
The Australian Dollar has continued to maintain a medium-term ascending channel pattern against the US Dollar. The exchange rate gained about 42 base points during Wednesday's trading session.
As for the near future, it is likely that the Aussie will continue to trade in the medium-term ascending channel. The currency pair might aim for the 50-hour simple moving average at 0.6975 today.
On the contrary, the currency exchange rate might reverse from the current price level at 0.6991 and target the upper boundary of the channel pattern at 0.7030 during the following trading session.
USD/CAD Might Edge Higher Today
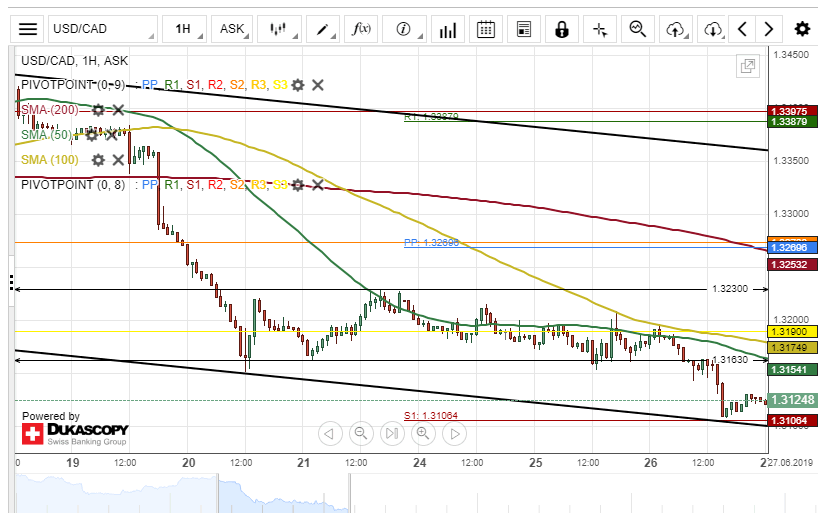
The US Dollar depreciated about 86 base points against the Canadian Dollar on Wednesday. The currency pair tested the bottom border of a medium-term descending channel pattern at 1.3106 during yesterday's trading session.
Everything being equal, it is likely that the currency exchange rate will make a brief pullback towards a swing high at 1.3230 during the following trading session.
However, a resistance cluster formed by the 50– and 100-hour simple moving averages near 1.3176 could hinder bullish traders from driving the USD/CAD currency pair higher today.
Eurozone Flash Inflation To Test Euro’s Rally Ahead Of G20 Summit
The euro grabbed the opportunity to recoup some lost ground last week at a time when major central banks including the European Central Bank (ECB) itself are preparing to add a dose of stimulus to the global economy. The rally however may come under test in coming days as the preliminary Harmonized Consumer Price Index (HCPI) report out of the EU on Friday at 0900 GMT could be the next clue on how soon the ECB might act. Trade headlines following the G20 meeting this weekend are also expected to raise volatility in the euro markets early next week.
The departing ECB chief Mario Draghi who saw his tightening plans scrapped thanks to the mounting trade uncertainty, said last week that he would dare to ease policy again if inflation fails to accelerate. The flash HCPI reading for the month of June is expected to show on Friday that inflation is nowhere near heating up and well under the “close but below to 2.0% “ ECB target, with forecasts standing for a growth of 1.2% year-on-year (y/y), the same as in the previous month. The core HCPI which trims for volatility and hence gives a clearer picture on the inflation trend, is seen steady as well at 1.0% y/y.
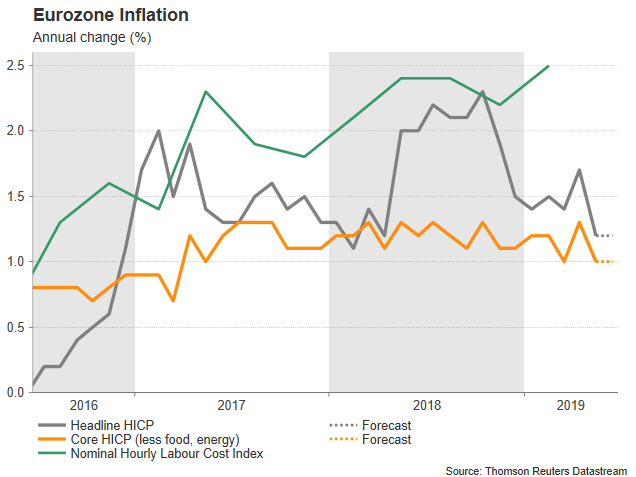
As in major economies such as the US, the weakness in the eurozone price growth could be characterized as baffling given the robust labor market. The unemployment rate dropped to decade lows in April and wages in the first quarter rose at the fastest pace (2.5% y/y) since data tracking began at the start of 2010. Nevertheless, this has yet to translate into higher inflation, making investors wonder whether the ECB's four-year monthly purchases of new government bonds and negative interest rates were worth the effort. Of course, consumer spending remains a key source of growth, accounting 50% of the GDP in the 19-member area over the past decade, something the healthy Services PMI readings revealed recently. Still, with businesses seeing industrial production and demand from foreigners declining despite the depreciation in the euro, there is low incentive to push up prices, especially as risks around trade, Brexit and Italy are not seen fading anytime soon.
Under current conditions, it is almost certain that major central banks will relax monetary policy in coming months to achieve their mandates. What markets do not know however is when and to what extent. Investors speculate that the ECB could cut interest rates by 0.10bps instead of the usual 0.25bps as there is not much comfort to further reduce borrowing costs in the negative area. Besides, negative rates had no meaningful impact on data so far and therefore another rate cut may potentially be less effective than normally. The quantitative easing program that the ECB terminated in December could also come back into play according to Draghi, even though such a move would likely damage the central bank's credibility and make the life of the new ECB governor more difficult next year.
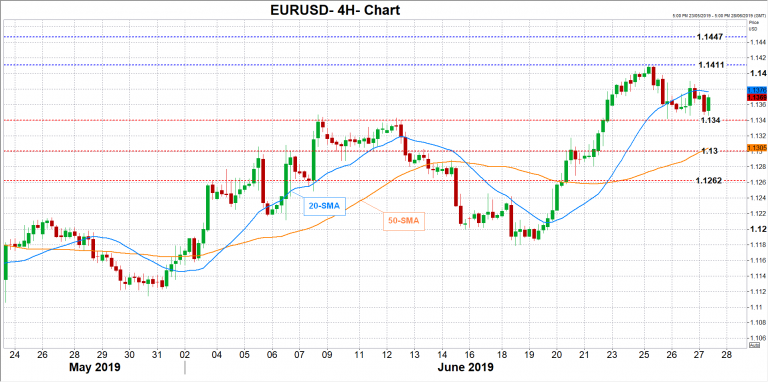
Friday's inflation readings could determine how urgent easier policy is. Another surprisingly weak CPI print could pressure the Bank to adjust policy as soon as in July 25th, consequently pushing EURUSD below the 1.1340 resistance level and towards the 1.1300 mark. The pair could get a double hit if Trump and Xi Jinping do not make progress on trade at the G20 meeting this weekend, with investors eyeing the 1.1262 level as well.
Alternatively, an unexpected pickup in the CPI index may give more room for thought and a chance of the euro to recover Tuesday's losses and reach its 3-month high of 1.1411. A bigger advance in the indicator may also lead the pair towards the March high of 1.1447. The upside correction, though, may prove short-lived if the G20 meeting disappoints.
GBPAUD Records Red Sessions In Trading Range
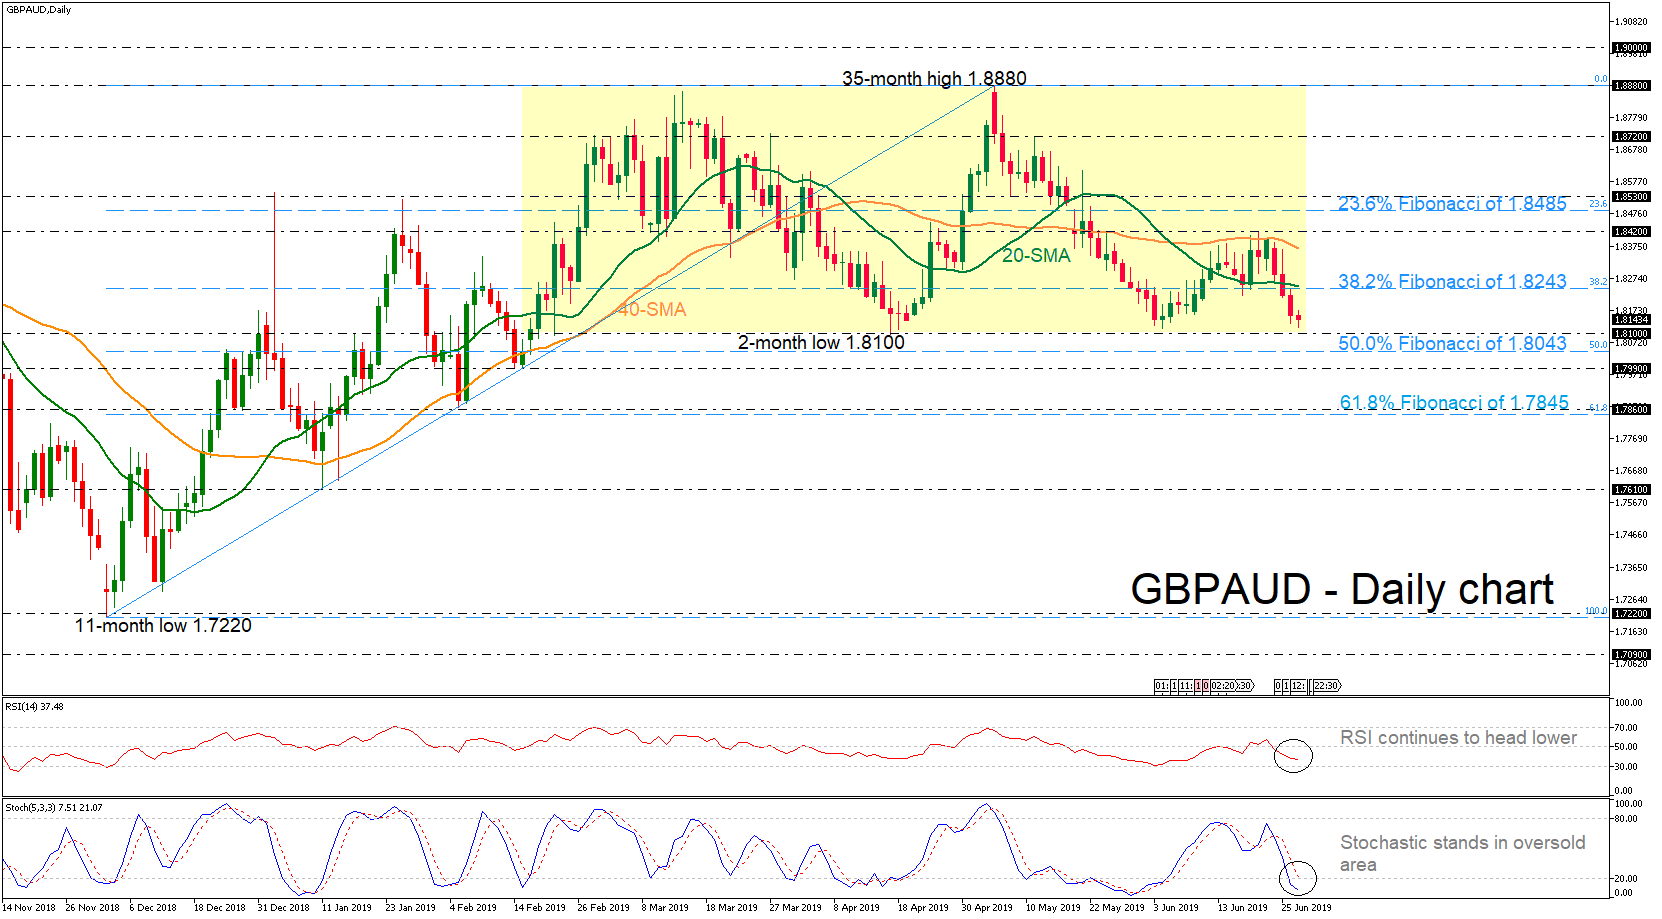
GBPAUD is posting red days, hovering around the lower boundary of the trading range (1.8100 – 1.8880), which has been standing since February 19. The RSI is pointing down in the negative territory, while the stochastic is holding in the oversold area.
Should the market continue its downside direction and penetrate the range, support could initially emerge between 1.8100-1.8043, which overlaps with the 50.0% Fibonacci of the upleg from 1.7220 – 1.8880. Even lower, a rally could find an obstacle at the 1.7990 region and at the 61.8% Fibonacci of 1.7845.
Alternatively, the 20-day simple moving average (SMA) near the 38.2% Fibonacci of 1.8243 could halt upside movements ahead of the 40-day SMA at 1.8365. Crossing above this area, the buying interest could turn more aggressive, with the bulls probably targeting the 23.6% Fibonacci near 1.8485.
Concluding, investors should wait to see a drop below 1.8100 for bearish actions or a climb above 1.8880 for bullish orders.
Hopes On Trade Truce As G-20 Leaders Gathers
G-20 leaders have gathered in Japan and this is where the focus is among traders. There is some optimism that some frame work will be agreed on the future talk on trade war between the US and China. It is this optimism which pushed the Asian stocks higher and the same momentum is filtering into the European market today. Safe haven assets such as gold aren't the first choice of investment among traders.
Everyone is expecting both countries to hold the fire when it comes to trade war, however president Trump isn't shy off talking about his “plan B” under which billions more in tariff could be introduced. He has made it clear that the US will do less business with China and it will only introduce more tariffs meaning “billions and billions of dollars a month”. His statement clearly contradicts with Treasury secretary Steven Mnuchin. His comment were more optimistic about the possibility of a trade deal.
The ongoing trade war is having an impact on the Chinese economic data and I am sure that President Xi has his plans to combat this. The trade war which has been going on nearly a year now and it isn’t good for either side, sooner they admit to this fact the better it is. Both sides are suffering doesn’t matter the narrative and the devil is in the detail- in terms of economic data. If both leaders fail to have any kind of future framework which can keep these negotiation going, markets are likely to react adversely and this is means sell off for the equity markets.
Looking at the score card, the US markets are still holding on to some meaningful gains: the S&P500 index is up 16.23% YTD, the Dow Jones has climbed 13.76% while the NASDAQ index is leading the way with a gain of 19.21%. Whereas the volatility index, VIX is down over 36% YTD and the same index, VSTOXX for the European markets has plunged 41%. Clearly, the dominant trend is in favour of riskier assets.
Closer to home, Boris Johnson has played down the prospects of no deal Brexit by saying that the chances are a “million to one against” the UK exiting the EU with no deal. Despite these comments the sterling dollar pair has failed to show any positive reaction. It has broken the critical level of 1.27 and currently trading down by -0.17 percent. The immediate support is at 1.2644 and a break of this may open the door towards the next psychological level of 1.26.
As for the Bitcoin price, the volatility is high once again, and it has retraced from its high of $13,851. More and more miners have joined this space because after the recent rally in the bitcoin price. This has made the mining space even more competitive. Bitcoin mining difficulty has touched a high of 7.93 trillion surpassing the previous record of 7.45 trillion. However, Satoshi’s asset is programmed to overcome this difficulty level every 2,016 blocks. Generally speaking, the recent retracement was absolutely necessary because the price moved too far too fast. This retracement in price could provide an opportunity for those who have been sitting on the side.
In terms of economic data, it is the US GDP q/q number which matters the most today. The forecast is for 3.1% which is the same as the previous reading. If we see a number which is softer than the market expectations, it would fuel the speculation of deeper interest rate cut by the Fed.
AUD/USD Outlook: Bulls Penetrate Daily Cloud And Eye Key Barriers At 0.7022/41 Zone
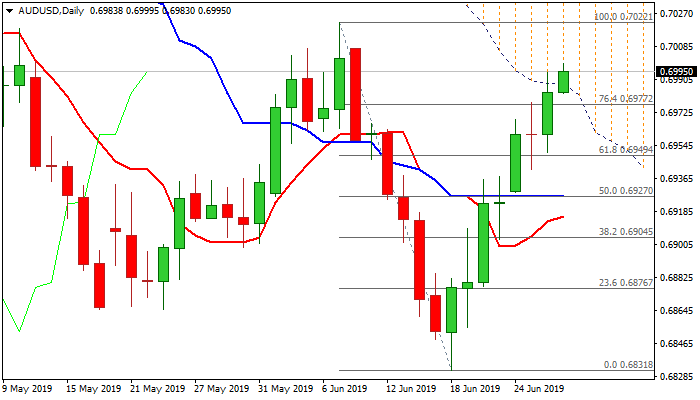
The Australian dollar maintains firm tone and penetrates thick daily cloud in early trading on Thursday, after false break on Wednesday.
The pair is holding around new 2 ½ week high at 0.6999 and strongly pressuring psychological 0.70 barrier, boosted optimistic tones about US/China trade talks.
Weaker momentum and overbought stochastic so far did not affect bulls, but consolidation/positioning before attacking key barriers at 0.7022 (7 June high), 0.7035 (daily cloud top) and 0.7041 (weekly cloud base) cannot be ruled out.
Broken Fibo 76.4% barrier (0.6977) should ideally contain dips.
Res: 0.7000, 0.7022, 0.7035, 0.7041
Sup: 0.6988, 0.6977, 0.6949, 0.6937
Confusion Lingers Over Direction Of Trade Talks As G20 Showdown Approaches
Conflicting signals over the direction of trade between the world's two largest economies are set to disrupt and destabilize the positive mood across markets ahead of the G20 showdown.
The Trump administration wasted no time in adopting the good cop, bad cop strategy leading up to the trade talks. While US Treasury Secretary Steven Mnuchin said he is "hopeful" of a US-China trade deal, President Trump then cited the "Plan B" option, which could see more US tariffs being imposed on Chinese goods. Investors are likely to remain extremely wary and cautious leading up to this weekend's meeting, for fear of being left empty-handed once again.
In a perfect world, the best-case scenario for financial markets would be for both sides to find common ground on trade and secure a breakthrough deal. However, we do not live in a perfect world as there are many times where investors' hopes for a breakthrough trade deal were shattered. The fact that the United States and China have agreed to a tentative tariff truce ahead of the G20 meeting does suggest that there is still some light at the end of the trade war tunnel. A market-friendly outcome will be for both sides to display co-operation and a strong interest in further negotiations to ease trade tensions that have winded the global economy.
Given the unpredictability of President Donald Trump, it would be unwise to be unprepared for a possible scenario where talks descend into disagreements on trade. Such an outcome will most likely rattle financial markets as concerns over slowing global growth and sizzling trade tensions fuel risk aversion.
Dollar cautiously higher ahead of US GDP
King Dollar was thrown a lifeline earlier in the week after Fed Chair Jerome Powell cooled investor optimism around a potential US rate cut in July.
June was certainly a painful trading month for the Dollar, given how the currency has erased its 2019 gains on interest rate cut expectations. Where the Greenback trades as we enter the second half of 2019 will be influenced by US economic data, Fed monetary easing expectations and the direction of US-China trade talks.
Today, investors will direct their attention towards the final version of the US first quarter domestic gross product (GDP) which is projected to remain unchanged at 3.1%. While a report that matches expectations may support the Dollar, the currency is likely to be more concerned with the outcome of the G20 talks.
In regards to the technical picture, the Dollar Index (DXY) is trading marginally above 96.30 on the daily charts. The Greenback could experience a technical rebound towards 96.50 in the near term.
Commodity spotlight – Gold
Gold prices struggled for direction on Thursday morning as Washington dished out mixed signals over the direction of trade talks with China ahead of the G20 summit.
Appetite towards the precious metal was dealt a blow earlier in the week after Fed officials toned down expectations over the Fed cutting interest rates next month. Although a stabilizing Dollar is also adding to the factors weighing on Gold, the precious metal remains resilient and well supported by core themes. For as long as concerns over slowing global growth, US interest rate cut expectations and trade tensions remain on investors' radar, Gold is shielded from downside shocks.
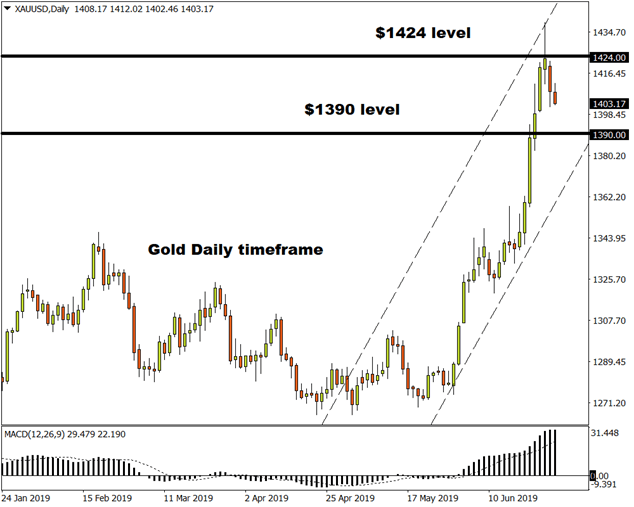
In regards to the technical picture, the precious metal is bullish on the daily charts. Gold seems to be in the process of a technical correction towards $1390 which may become the new higher low. Should this point prove to be reliable support, Gold has the potential to rebound towards $1424.
The Analytical Overview Of The Main Currency Pairs
The EUR/USD currency pair
Technical indicators of the currency pair:
Prev Open: 1.13665
Open: 1.13677
% chg. over the last day: +0.02
Day's range: 1.13478 – 1.13748
52 wk range: 1.1111 – 1.2009
The EUR/USD stabilized after a rather long rally. The trading instrument is consolidating. Local levels of support and resistance are 1.13400 and 1.13750. Concerns about an aggressive reduction in interest rates (by 50 basis points) dropped significantly after the comments of Fed Chairman Jerome Powell on Tuesday. At the same time, more than 75% of financial market participants believe that the regulator will reduce the range of key interest rate by 25 basis points to 2.00% -2.25% at a meeting in July. Investors took a wait-and-see stance before the G20 summit, at which the leaders of the United States and China should once again discuss trade disputes. Recall that the G20 summit will be held in Osaka from 28 to 29 June. Today we recommend to pay attention to economic releases from the USA. Positions must be opened from key levels.
The Economic News Feed for 27.06.2019:
GDP report (US) – 15:30 (GMT+3:00);
Unfinished Real Estate Sales Index (US) – 17:00 (GMT+3:00);
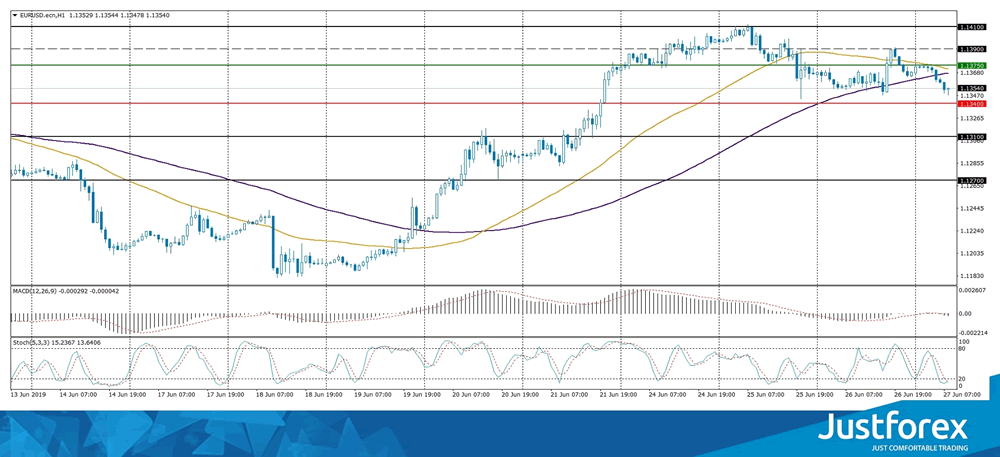
The indicators do not provide precise signals, the price has crossed 50 MA and 100 MA.
The MACD histogram is close to 0.
The Stochastic Oscillator is in the oversold zone, the %K line is crossing the %D line. There are no signals at the moment.
Trading recommendations
Support levels: 1.13400, 1.13100, 1.12700
Resistance levels: 1.13750, 1.14100, 1.14500
If the price fixes below 1.13400, expect further correction towards 1.13100-1.12800.
Alternatively, the quotes can grow towards 1.14100-1.14400.
The GBP/USD currency pair
Technical indicators of the currency pair:
Prev Open: 1.26861
Open: 1.26840
% chg. over the last day: -0.02
Day's range: 1.26743 – 1.26973
52 wk range: 1.2438 – 1.3631
An ambiguous technical picture emerged on the GBP/USD currency pair. Streling is trading in a flat. GBP/USD quotes test local support and resistance levels: 1.26650 and 1.27150, respectively. Boris Johnson, the main contender for the post of Prime Minister of the United Kingdom, said that he was “serious” about withdrawing Britain from the EU by October 31 without concluding a deal if the block refuses to negotiate a new withdrawal agreement. We recommend to keep track of current information on the issue of Brexit. The trading instrument has the potential for further correction. Positions must be opened from key levels.
The Economic News Feed for 27.06.2019 is calm.
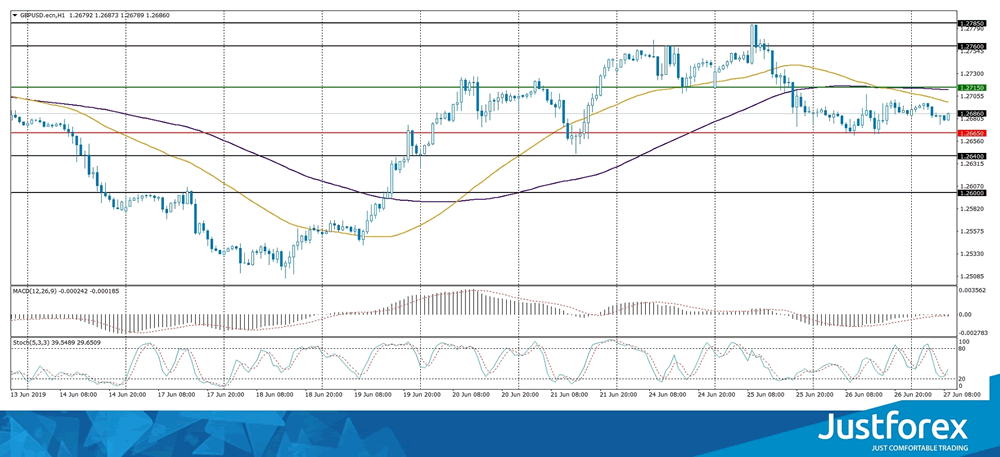
The indicators do not provide precise signals, 50 MA has crossed 100 MA.
The MACD histogram is close to 0.
The Stochastic Oscillator is in the neutral zone, the %K line is crossing the %D line. There are no signals.
Trading recommendations
Support levels: 1.26650, 1.26400, 1.26000
Resistance levels: 1.27150, 1.27600, 1.27850
If the price fixes below 1.26650, expect further correction towards 1.26300-1.26000.
Alternatively, the quotes can grow towards 1.27500-1.27700.
The USD/CAD currency pair
Technical indicators of the currency pair:
Prev Open: 1.31687
Open: 1.31258
% chg. over the last day: -0.37
Day's range: 1.31173 – 1.31380
52 wk range: 1.2727 – 1.3664
The USD/CAD has once again moved to a decline. Yesterday, the drop in quotes exceeded 50 points, CAD updated the key lows. At the moment, the trading instrument is consolidating. The quotes found support at 1.31100. Mark 1.31600 is already a "mirror" resistance. The pair has the potential to decline further. Additional support for the Canadian dollar is caused by a positive trend in prices for oil. Open positions from key levels.
The Economic News Feed for 27.06.2019:
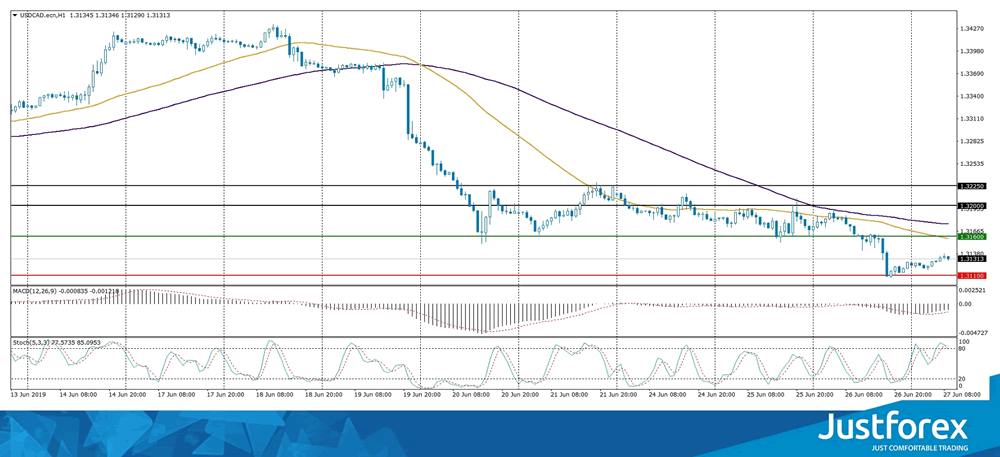
The price fixed below 50 MA and 100 MA which points to the power of the sellers.
The MACD histogram is in the negative zone but above the signal line which gives a weak signal to sell USD/CAD.
The Stochastic Oscillator is in the overbought zone, the %K line is crossing the %D line. There are no signals.
Trading recommendations
Support levels: 1.31100, 1.31000, 1.30600
Resistance levels: 1.31600, 1.32000, 1.32250
If the price fixed below 1.31100, expect further descend towards 1.30800-1.30600.
Alternatively, the quotes can correct towards 1.32000-1.32250.
The USD/JPY currency pair
Technical indicators of the currency pair:
Prev Open: 107.170
Open: 107.776
% chg. over the last day: +0.52
Day's range: 107.647 – 108.132
52 wk range: 104.97 – 114.56
The USD / JPY currency pair shows a positive trend. The trading instrument has updated local maxima. At the moment, the quotes are testing the key resistance level of 108.100. 107.750 is already a "mirror" support. The USD/JPY currency pair has the potential for further recovery. We recommend to pay attention to economic releases from the United States. Positions must be opened from key levels.
The Economic News Feed for 27.06.2019 is calm.
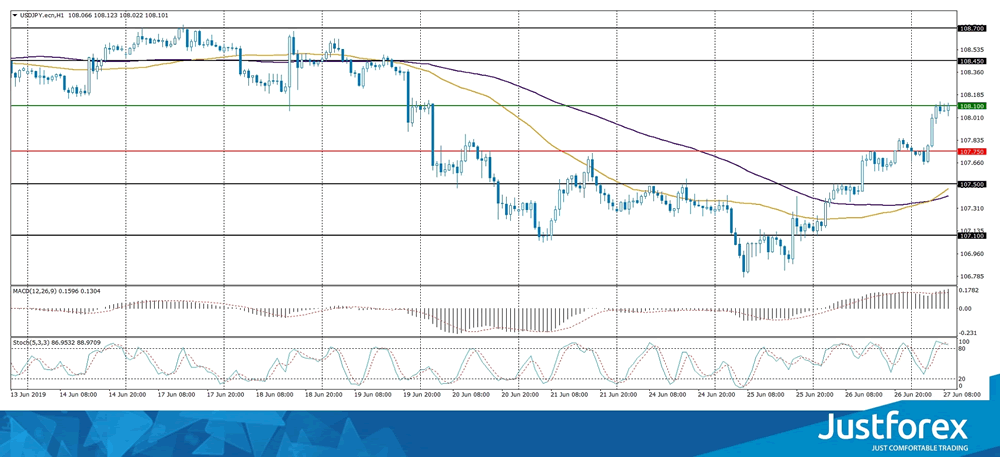
The price fixed above 50 MA and 100 MA which points to the power of the buyers.
The MACD histogram is in the positive zone and abov the signal line which gives a strong signal to buy USD/JPY.
The Stochastic Oscillator is in the overbought zone, the %K line is crossing the %D line. There are no signals.
Trading recommendations
Support levels: 107.750, 107.500, 107.100
Resistance levels: 108.100, 108.450, 108.700
If the price fixes above 108.100, expect further growth towards 108.400-108.600.
Alternatively, the quotes can fall towards 107.500-107.300.