

Sample Category Title
Fed Likely To Change Language, Oil Trading Downward, Norges “Dovish Hike”
Fed likely to change language at FOMC meeting
Trade uncertainties, Trump’s pressure to cut interest rate and weakening economic data: all seems blurred as to how the Fed should react. Market interpretation should play an important role in the future development of the greenback as well. Treasuries continue to gain traction, with yields lowest in over a year across all maturities as expectations of Fed Funds Rate cuts, uncertainties amplify. Although no rate cuts are expected for Wednesday meeting, changes in forward guidance and the Fed’s dot plot are largely anticipated.
During its monetary policy meeting, the Fed is about to turn more dovish, with a shift in language from “patient” to more flexible, paving the way for one rate cut this year and additional easing in 2020 as well. GDP and inflation forecasts currently set at 2.10% and 1.80% will likely be revised downwards as deteriorating economic data support the trend. Nominal and Core PCE given at 1.50% (prior: 1.40%) and 1.60% (prior: 1.50%) in April remain below the 2% target while manufacturing activities downtrend are approaching contraction territory as a result of escalating trade war with China. Furthermore, major problems related to Trump's interference in the Fed's affairs constitute a major obstacle for the central bank, which is supposed to preserve its independence to ensure credibility and avoid long-term difficulties, in particular when stabilizing the economy and the dollar. Certainly, an escalation of political pressure would most likely negatively affect USD and conversely the US economy.
As ECB President Mario Draghi speech about stimulus is weighing on the EUR, we expect EUR/USD (1.1185) to approach 1.1175 short-term while June ZEW figure of -20.2 (prior: -1.6) for the Eurozone should support the decline.
Oil Strange Curve
Clearly, we are not in the 1990’s were the smallest disturbance in the middle-east would cause chaos in energy markets. Tension is rising in the Gulf region as attacks on two tankers near the Strait of Hormuz have put the US and Iran on a collision course. Despite traders being caught short, as they anticipate further weakening of global demand, the upwards bounce was limited. On Friday, the IEA reduced global oil demand growth in 2019 for a second consecutive month highlighting demand issues that have been bulldozing oil prices downwards. Yet the long-term outlook for oil looks stronger especially at $51 brl. The trade is reported to be short the front-end while building longs on the back end of the curve (locking in a cheap price for future delivery) in expectation of steepening. The middle of the forward curve remains ultra weak and complicated (markets understand that the forward curves is not a reliable forecast of futures prices). With the middle-east gulf region on a hair trigger, US summer coming in hot and slower global demand already pricing in, the upside in oil looks attractive. Especially considering how short the market has become in the front-end. Our trajectory for higher oil prices through year-end remains intact, lack of reaction to supply complexity and softer demand is hurting the market further than initially anticipated.
Norges ‘Dovish hike’
Speaking of oil, we expected the Norges banks to raise policy rates by 25bp. The Interest rate path from March meeting explicitly commits to a hike. Yet, the policy adjustment is likely to be a ‘dovish hike’, considering the negative macro backdrop. Norway’s growth is hovering around 3% with strong labor market pressuring inflation (in-line with forecasts). With the hike fully priced in the real question is what is next? Global yields have fallen sharply as market pricing in easier policy from the Fed. Oil prices, despite risks to supply, prices have fallen 20% from April’s highs. Above a hike this week, markets are pricing in 6-7 bps of tightening for the rest of 2019. Interesting the Norges Board will only learn of the FOMCs strategy after their own decision. A dovish hike and pilling back calendar-based forward guidance will be a short-term negative for NOK (especially considering how short the markets are already in NOK).
EUR/USD Outlook: Positive Tone Above Daily Cloud Base Ahead Of Key German / EU Data
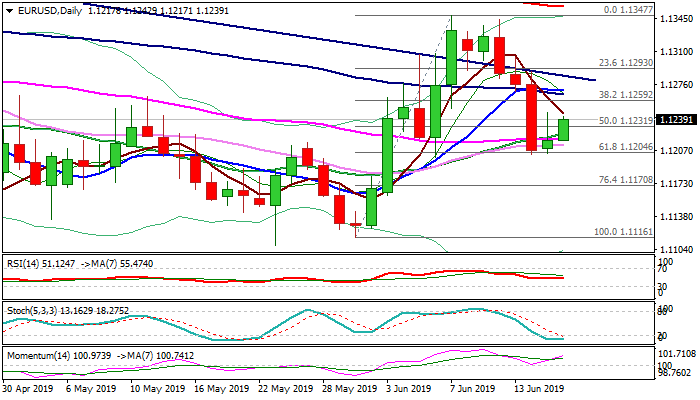
The Euro stands at the front foot in early Tuesday’s trading and pressures initial barriers at 1.1246/47 (falling 5SMA / Monday’s high).
The pair is attempting to form a base at key supports at 1.1208/04 (daily cloud base / Fibo 61.8% of 1.1116/1.1347) which contained Friday’s strong fall and Monday’s action.
Bears off 1.1347/43 double-top are on hold, as bullish momentum is rising and stochastic reversing in oversold territory on daily chart.
Extended upticks need to stay below pivotal barriers at 1.1265/69 (converged 100/10SMA’s) and 1.1279 (daily cloud top) to keep in play hopes for renewed attack at 1.1208/04 pivots and possible bearish continuation on firm break.
Lift and break above daily cloud top would neutralize bears and shift focus higher.
Series of key data from EU and speech of ECB President Draghi are due today and eyed for fresh signals.
German ZEW (Jun -5.7 f/c vs -2.1 prev) and EU CPI (May m/m 0.2% f/c vs 0.7% prev, y/y 1.2% f/c unchanged) would sour the sentiment on weak releases.
Res: 1.1247, 1.1269, 1.1279, 1.1289
Sup: 1.1224, 1.1217, 1.1208, 1.1202
Forex Technical Analysis: EUR/USD, USD/JPY, GBP/USD
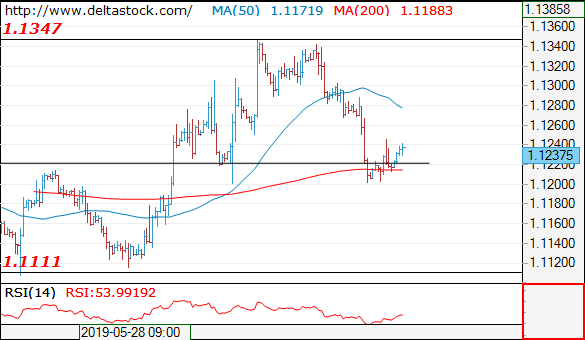
EUR/USD
Current level - 1.1237
The rebound above 1.1200 seems corrective and 1.1250 resistance should cap the upside, for a downswing towards 1.1110 low.
| Resistance | Support | ||
| intraday | intraweek | intraday | intraweek |
| 1.1250 | 1.1450 | 1.1200 | 1.1015 |
| 1.1350 | 1.1450 | 1.1110 | 1.0860 |
USD/JPY
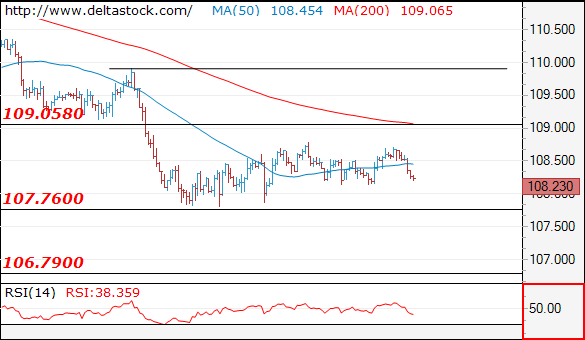
Current level - 108.23
The outlook here remains neutral within the 109.05-107.70 range.
| Resistance | Support | ||
| intraday | intraweek | intraday | intraweek |
| 109.05 | 109.90 | 108.10 | 107.70 |
| 109.05 | 112.40 | 107.70 | 106.70 |
GBP/USD
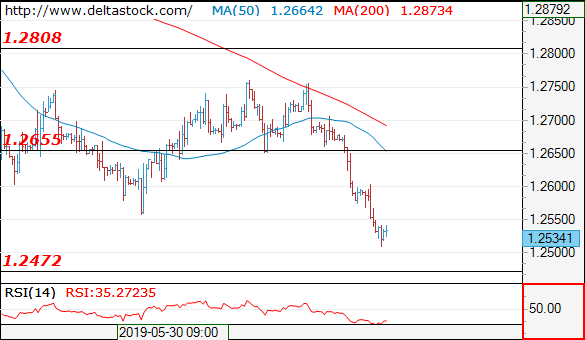
Current level - 1.2534
The downtrend is intact, heading towards 1.2470 area. Crucial on the upside is 1.2600.
| Resistance | Support | ||
| intraday | intraweek | intraday | intraweek |
| 1.2610 | 1.2960 | 1.2470 | 1.2470 |
| 1.2760 | 1.3170 | 1.2470 | 1.2350 |
AUD/USD Outlook: Dovish RBA Pushes Aussie To New Multi-Month Lows
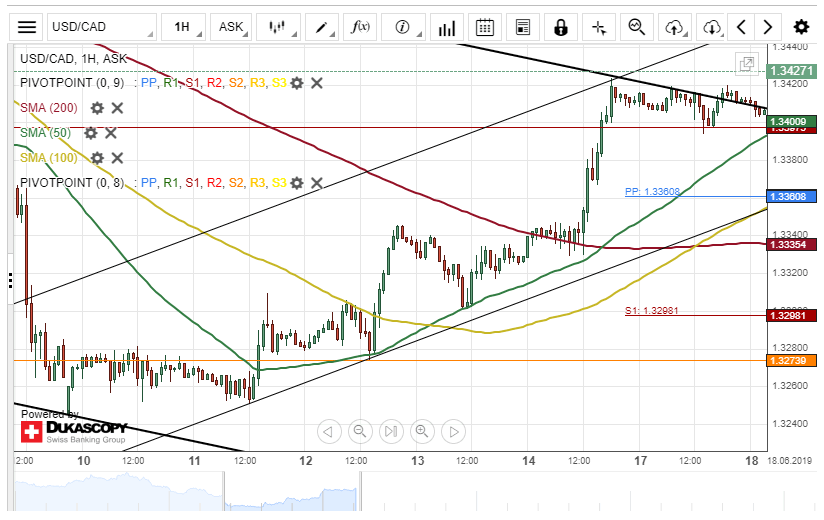
The Australian dollar hit new 6 1/2 month low against the US dollar on Tuesday, extending fall from 0.7022 high into seventh straight day. Weak Australian housing data, released overnight and more important comments from RBA, which reiterated its dovish stance and signaled further easing in interest rates, increased pressure on Aussie dollar from US/China trade conflict and fresh tensions between the US and Iran. Bearish studies support scenario, however, bears may reduce the pace on strongly oversold conditions. Immediate supports at 0.6827/26 (Fibo 123.6% projection / Jan 2016 lows) are under pressure and bears may extend towards projections at 0.6804 (Fibo 138.2%) and 0.6767 (Fibo 161.8%). Former base at 0.6864 now acts as solid resistance, ahead of falling 5SMA (0.6881).
Res: 0.6864, 0.6881, 0.6900, 0.6927
Sup: 0.6826, 0.6804, 0.6767, 0.6744
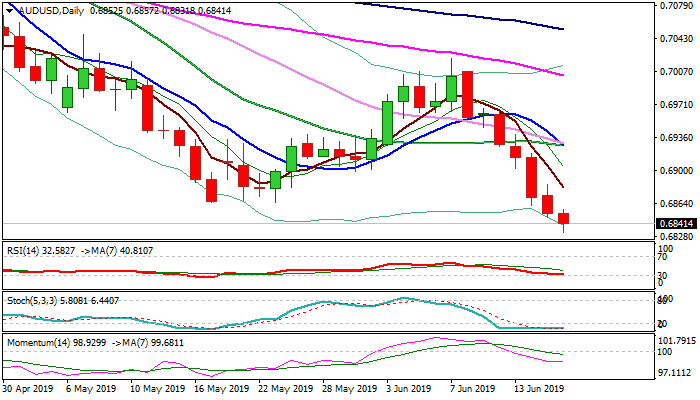
EUR/JPY Could Still Edge Lower
The Eurozone single currency appreciated about 45 base points against the Japanese Yen on Monday. The surge was stopped by a resistance level formed by the weekly PP at 122.17.
Everything being equal, it is likely that the currency pair will continue its movement in the descending channel pattern within this session. The potential downside target will be near the weekly S1 at 121.16.
If the support level formed by the weekly S1 holds, the EUR/JPY currency exchange rate will make an upside reversal during the following trading session.
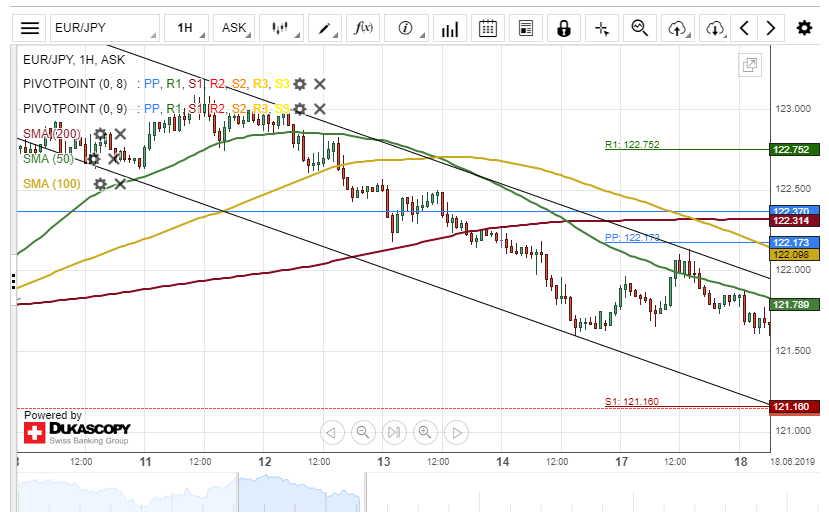
AUD/USD Might Target 50-Hour SMA
During Monday's trading session, the Australian Dollar depreciated about 33 base points against the US Dollar. The decline was stopped by a support level formed by the monthly S1 at 0.6848 during yesterday's trading session.
The exchange rate was trading near the bottom border of a narrow descending channel pattern at 0.6840 and could be set for a breakout.
If the breakout occurs, the AUD/USD currency pair will continue to decline in the shorter term.
However, if the narrow descending channel holds, bullish traders could target a resistance level formed by the 50-hour SMA at 0.6870 within this session.
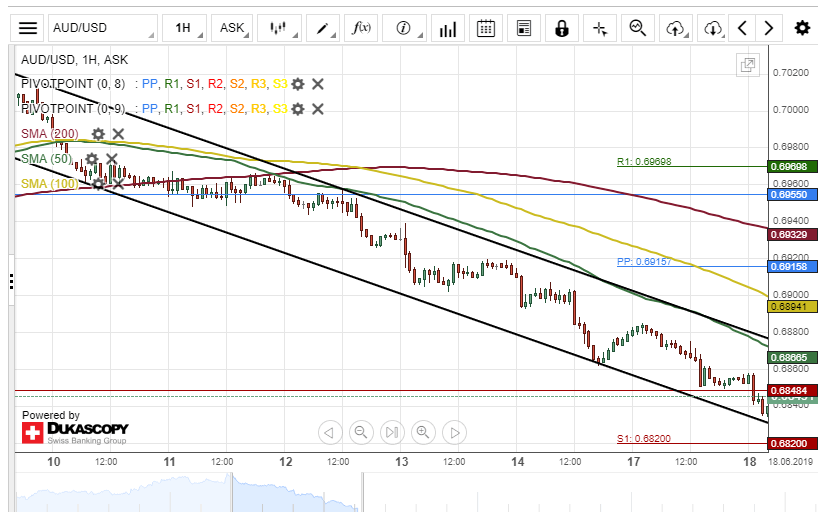
USD/CAD Breakout Likely To Occur
The US Dollar traded sideways against the Canadian Dollar on Monday. The monthly pivot point at 1.3396 provided support for the exchange rate during yesterday's trading session.
A breakout from the sideways movement could be expected within this session. Technical indicators suggest an upside breakout.
If this upside breakout occurs, a surge towards the upper boundary of a junior ascending channel could be the target.
On the other hand, the currency exchange rate could continue to consolidate above the monthly PP at 1.3396 today.
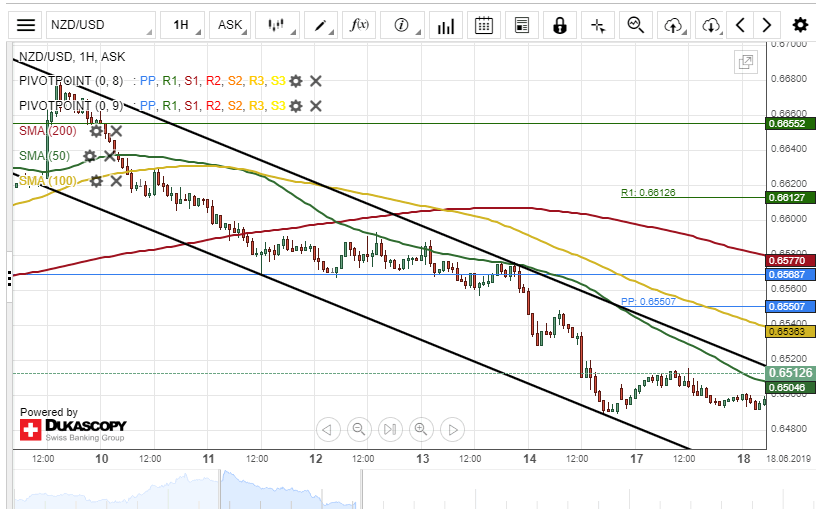
NZD/USD Two Scenarios Likely
The New Zealand Dollar versus the US Dollar maintained a junior descending channel pattern during yesterday's trading session. The currency pair traded with low volatility on Monday.
By and large, it is likely that the NZD/USD exchange rate will continue to maintain the descending channel pattern during the following trading session. The potential target for bearish traders will be near the bottom border of the channel pattern at 0.6456.
Although, the currency exchange rate could reverse from the current price level at 0.6496 and dash through the 50-hour SMA support level and the upper boundary of the descending channel pattern.
Eurozone CPI finalized at 1.2%, core CPI at 0.8% in May
Eurozone CPI was finalized at 1.2% yoy in May, down from April's 1.7% yoy. CPI core was finalized at 0.8% yoy, unchanged from April's figure. EU28 CPI was finalized at 1.6% yoy in May, down from April's 1.9% yoy.
The lowest annual rates were registered in Cyprus (0.2%), Portugal (0.3%) and Greece (0.6%). The highest annual rates were recorded in Romania (4.4%), Hungary (4.0%) and Latvia (3.5%). Compared with April 2019, annual inflation fell in sixteen Member States, remained stable in five and rose in six.
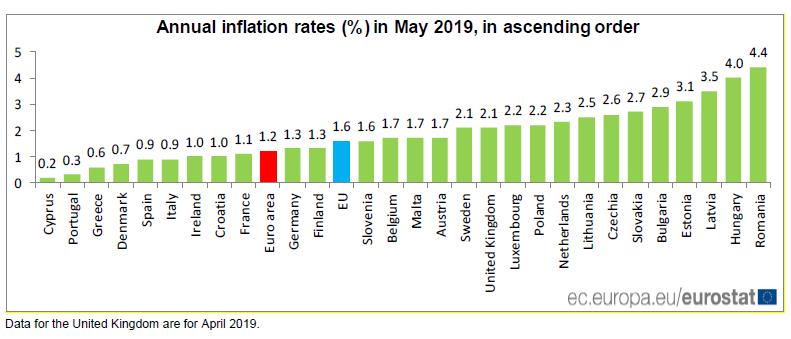
In May 2019, the highest contribution to the annual euro area inflation rate came from services (0.47%), followed by energy (0.38%), food, alcohol & tobacco (0.29%) and non-energy industrial goods (0.08%).
The Analytical Overview Of The Main Currency Pairs
The EUR/USD currency pair
Technical indicators of the currency pair:
Prev Open: 1.12094
Open: 1.12179
% chg. over the last day: +0.08
Day's range: 1.12178 – 1.12394
52 wk range: 1.1111 – 1.2009
EUR/USD stabilized after a sharp descend at the end of last week. Right now the quotes are consolidating in the 1.12150-1.12400 range. The market participants are waiting for the Federal Reserve meeting. Some experts expect Jerome Powell to use this meeting as a signal for lowering the interest rate next year. Consider today`s economic releases and open positions from the key levels.
The Economic News Feed for 18.06.2019:
Economic Mood Index by ZEW (GER) – 12:00 (GMT+3:00);
Inflation Report (EU) – 12:00 (GMT+3:00);
Real Estate Market Report (US) – 15:30 (GMT+3:00);
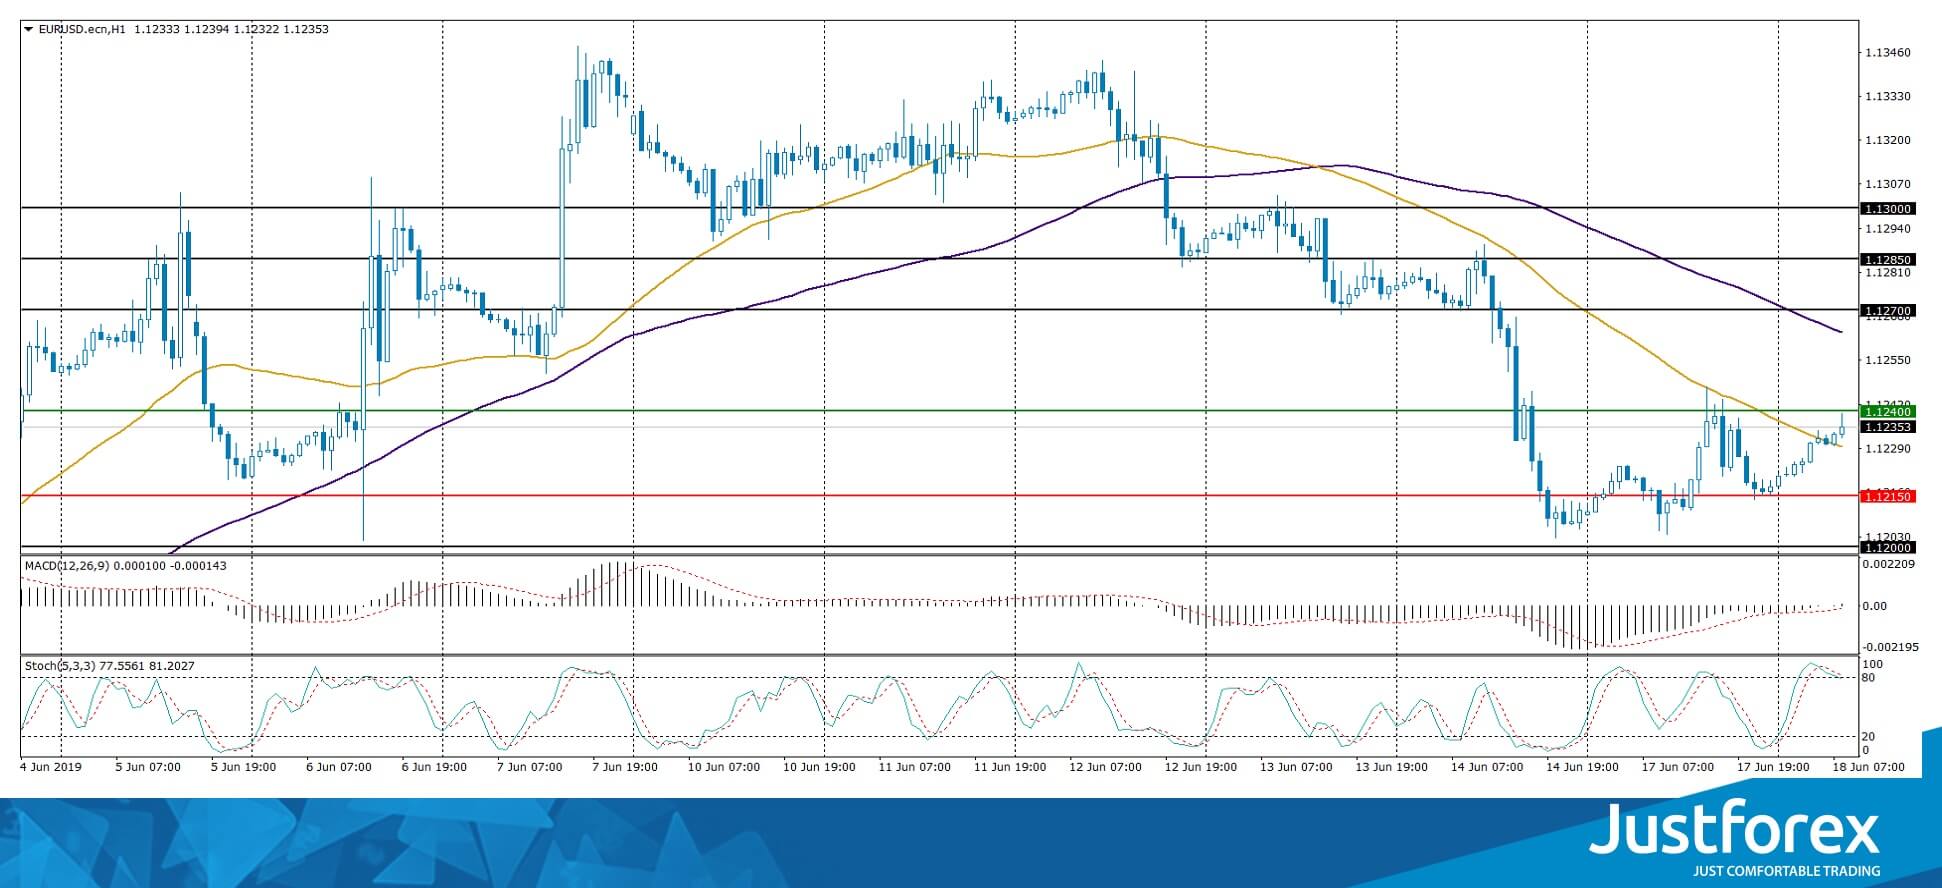
The indicators do not provide precise signals, the price has crossed 50 MA.
The MACD histogram is close to 0.
The Stochastic Oscillator is in the overbought zone, the %K line is crossing the %D line. There are no signals at the moment.
Trading recommendations
Support levels: 1.12150, 1.12000
Resistance levels: 1.12400, 1.12700, 1.12850
If the price fixes below 1.12150, expect the quotes to descend towards 1.11800-1.11600.
Alternatively, the quotes can recover towards 1.12600-1.12800.
The GBP/USD currency pair
Technical indicators of the currency pair:
Prev Open: 1.25798
Open: 1.25318
% chg. over the last day: -0.42
Day's range: 1.25116 – 1.25441
52 wk range: 1.2438 – 1.3631
GBP/USD shows a clear descending trend. The GBP is consolidating near the annual minimums. The local support and resistance levels are 1.25150 and 1.25500. GBP can descend further. Boris Johnson can replace Theresa May as an acting Prime Minister due to having the most support by far as a potential leader of the Conservative party. Earlier the official promised to remove the UK from the EU with agreement or without it by October 31. You should open positions from the key levels.
The Economic News Feed for 18.06.2019 is calm.
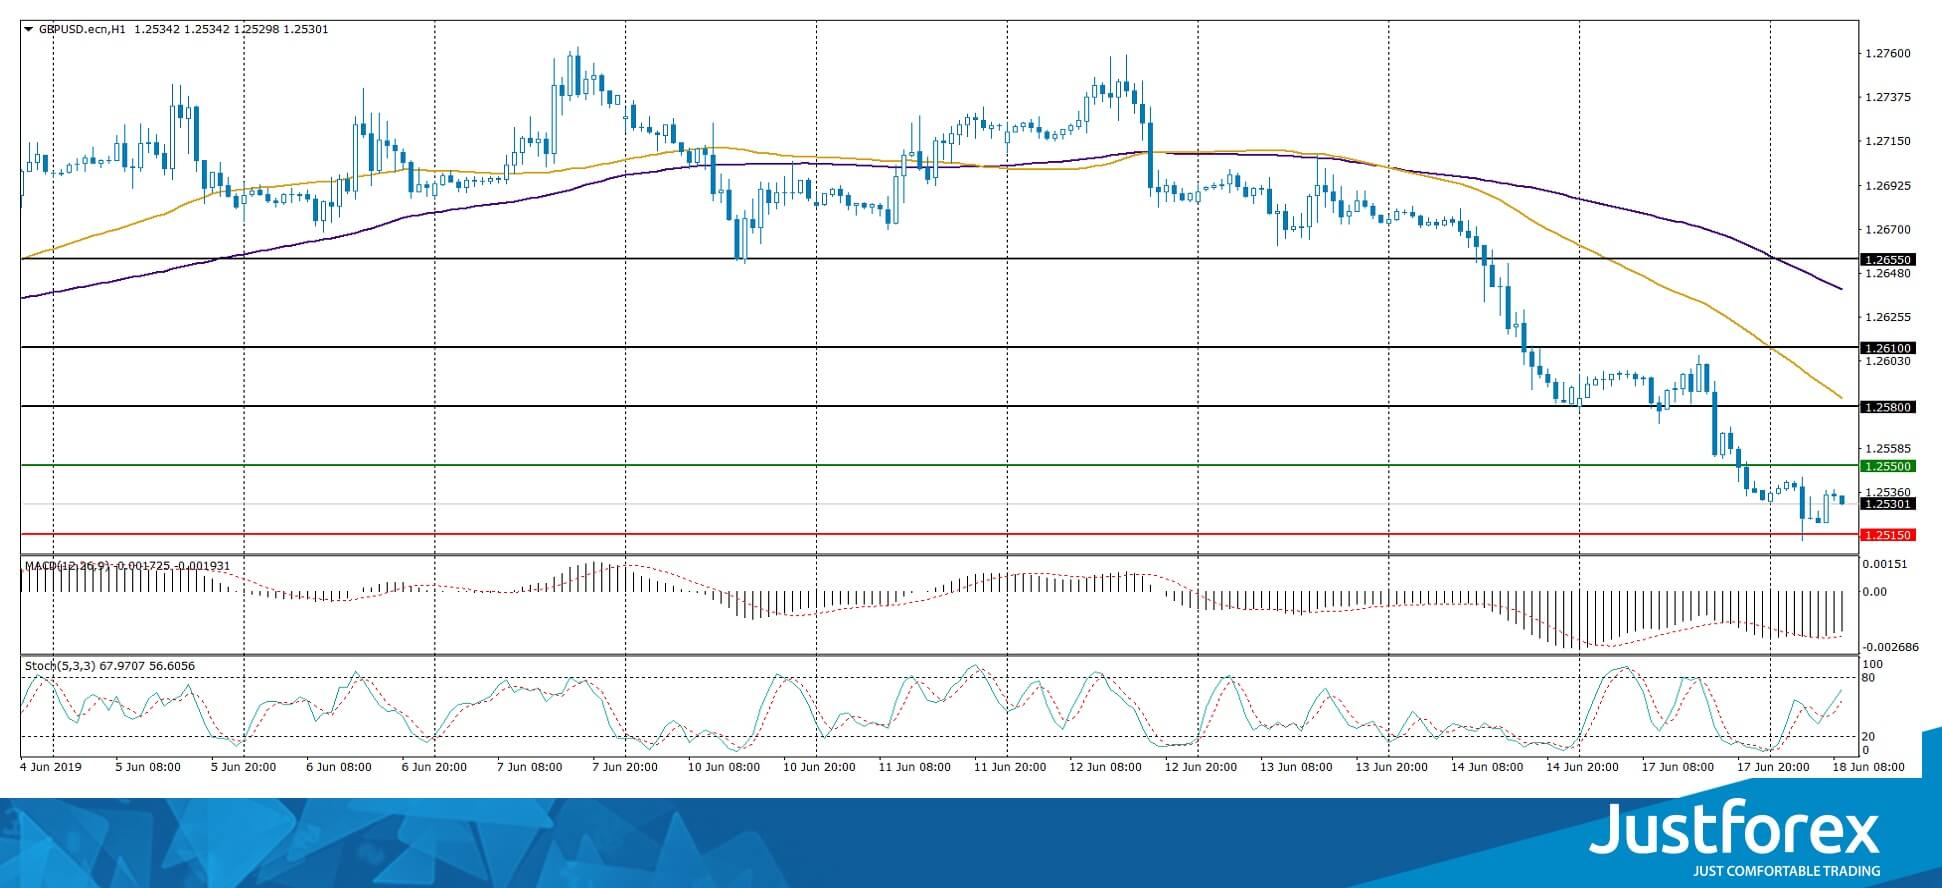
The indicators point to the power of the buyers, the price fixed below 50 MA and 100 MA.
The MACD is in the negative zone but above the signal line which points a weak signal to sell GBP/USD.
The Stochastic Oscillator is in the neutral zone.
Trading recommendations
Support levels: 1.25150, 1.25000, 1.24600
Resistance levels: 1.25500, 1.25800, 1.26100
If the price fixes below 1.25150 expect further descend towards 1.24700-1.24500.
Alternatively, the quotes can correct towards 1.25800-1.26000.
The USD/CAD currency pair
Technical indicators of the currency pair:
Prev Open: 1.34068
Open: 1.34121
% chg. over the last day: +0.03
Day's range: 1.34005 – 1.34127
52 wk range: 1.2727 – 1.3664
USD/CAD stabilized after sharp growth last week. There is no defined trend, the quotes are consolidating around 1.34000. The pressure on the CAD is calused by the negative oil quotes. The trading instrument can grow further, you should open positions from the key levels.
The Economic News Feed for 18.06.2019 is calm.
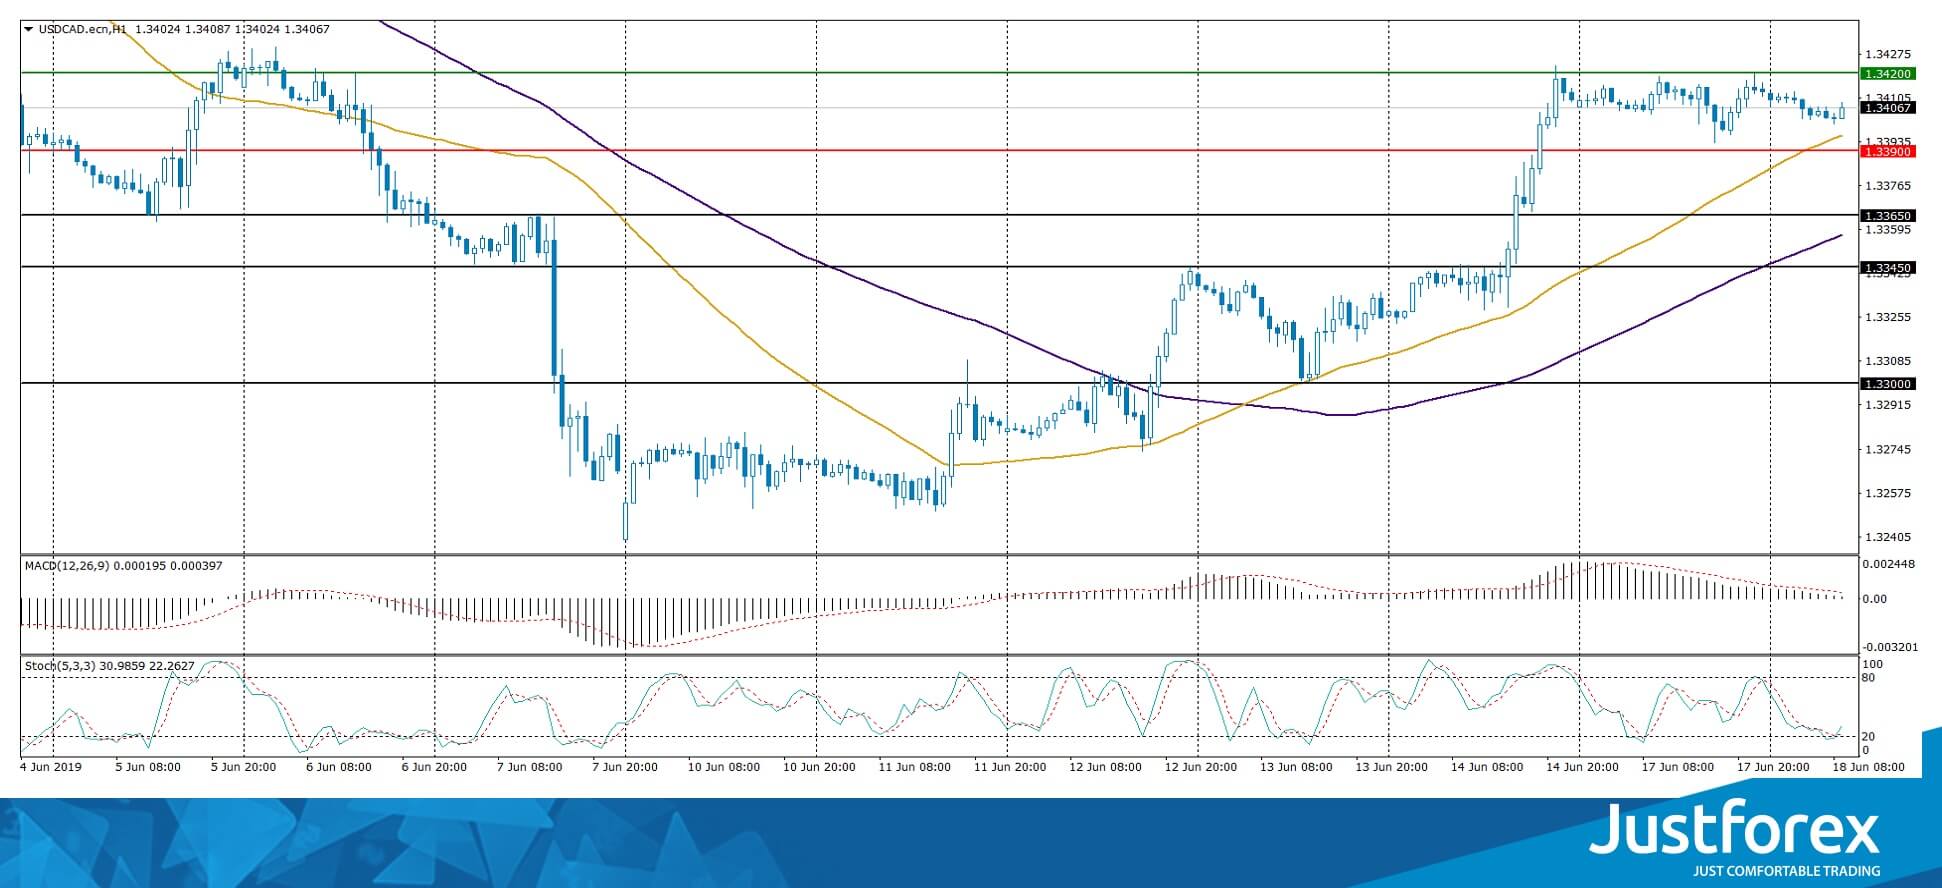
The price fixed above 50 MA and 100 MA which points to the power of the buyers.
The MACD histogram is close to 0. There are no signals at the moment.
The Stochastic Oscillator is in the oversold zone, the %K line has crossed the %D line. There are no signals at the moment.
Trading recommendations
Support levels: 1.33900, 1.33650, 1.33450
Resistance levels: 1.34200, 1.34500
If the price fixes above 1.34200, expect further growth around 1.34500-1.34700.
Alternatively, the quotes can descend towards 1.33600-1.33400.
The USD/JPY currency pair
Technical indicators of the currency pair:
Prev Open: 108.497
Open: 108.523
% chg. over the last day: +0.03
Day's range: 108.252 – 108.583
52 wk range: 104.97 – 114.56
USD/JPY keeps trading in a long flat. There is no defined trend. The local support and resistance are 108.200 and 108.450. The investors are waiting for additional drivers. Keep an eye on the US Treasury bonds' yield and open positions from the key levels.
The Economic News Feed for 18.06.2019:
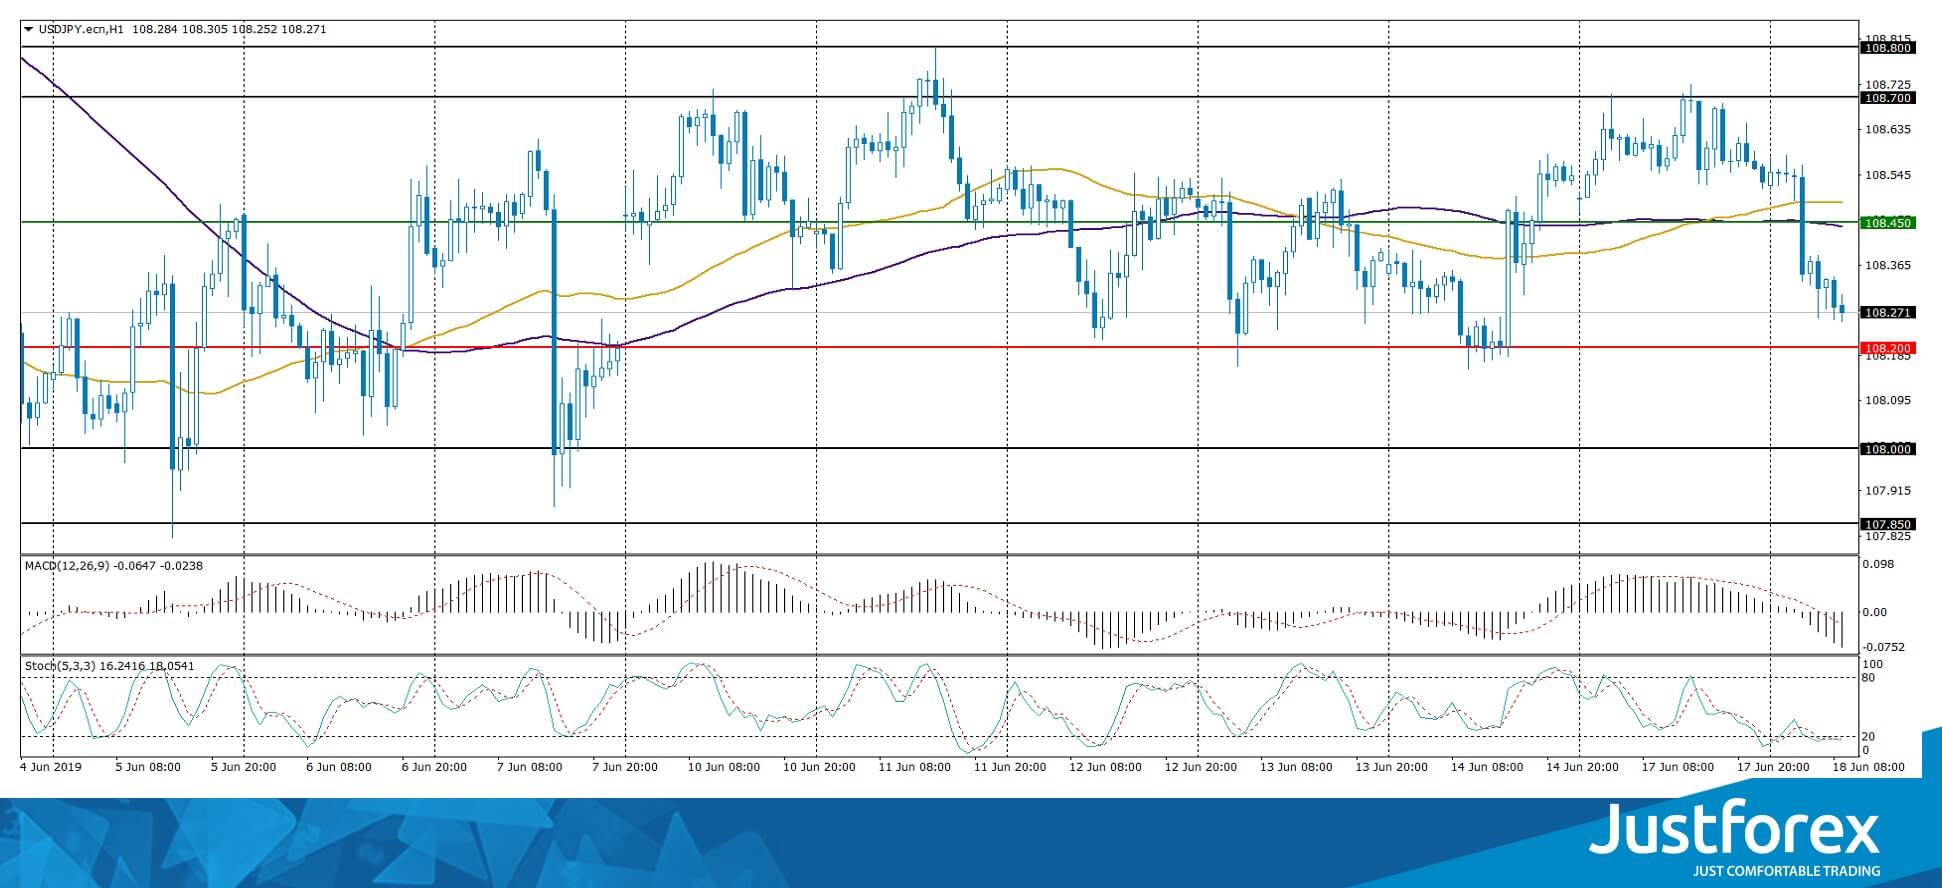
The indicators do not provide precise signals, 50 MA is crossing 100 MA.
The MACD histogram is in the negative zone and keeps descending which points to the bearish mood.
The Stochastic Oscillator is in the oversold zone, the %K line is crossing the %D line. There are no signals at the moment.
Trading recommendations
Support levels: 108.200, 108.000, 107.850
Resistance levels: 108.450, 108.700, 108.800
If the price fixes below 108.200, expect further descend towards 108.000-107.850.
Alternatively, the quotes can grow towards 108.600-108.800.