Sample Category Title
UK PMI construction dropped to 48.6, lowest since March 2018
UK PMI construction dropped to 48.6 in May, down fro 50.5 and missed expectation of 50.6. That's also the lowest reading since the snow-related downturn in construction output during March 2018. Additionally, there was the sharpest drop in workforce numbers since November 2012. And commercial work remains the weakest performing category.
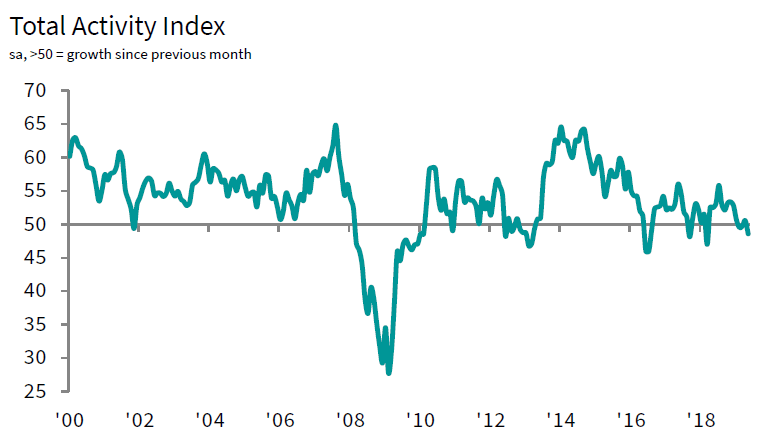
Tim Moore, Associate Director at IHS Markit, which compiles the survey:
"May data reveals another setback for the UK construction sector as output and new orders both declined to the greatest extent since the first quarter of 2018. Survey respondents attributed lower workloads to ongoing political and economic uncertainty, which has led to widespread delays with spending decisions and encouraged risk aversion among clients.
"Commercial building remained hardest-hit by Brexit uncertainty, with construction firms reporting the steepest fall in this category of activity since September 2017. Civil engineering work also dried up in May and a fourth consecutive monthly fall in activity marked the longest period of decline since the first half of 2013. Construction companies often commented that recent tender opportunities for civil engineering work had been insufficient to replace completed projects.
"House building was the only sub-category of construction output to buck the downward trend in May, but growth remained softer than on average in 2018.
"The soft patch for construction work so far this year has started to impact on staff hiring, with some firms cutting back on expansion plans and others opting to delay the replacement of voluntary leavers. May data revealed that the latest fall in employment numbers was the steepest for six-and-a-half years. Survey respondents once again noted concerns that the subdued domestic economic outlook and delays related to Brexit uncertainty had curtailed their near-term growth prospects."
UK Fox backs Hunt to be PM, dealmaking is part of his DNA
UK Trade Minister Liam Fox said he's backing Foreign Minister Jeremy Hunt in the race to be the next Prime Minister. He told BBC radio, "in this contest I'll be backing my friend Jeremy Hunt who is an impressive foreign secretary, an entrepreneur by background, where dealmaking is part of his DNA,"
Fox added, "he understands that we have to message to Europe that we will leave if we cannot get an appropriate deal, but we'll try to get a deal." Meanwhile, Fox also warned of "the prospect of a no deal might well be used by those who seek to break up the UK, to use that as a weapon in that particular battle, both I think in Northern Ireland and potentially in Scotland."
EUR/USD Outlook: Recovery Rally Risks Stall At Key Barriers
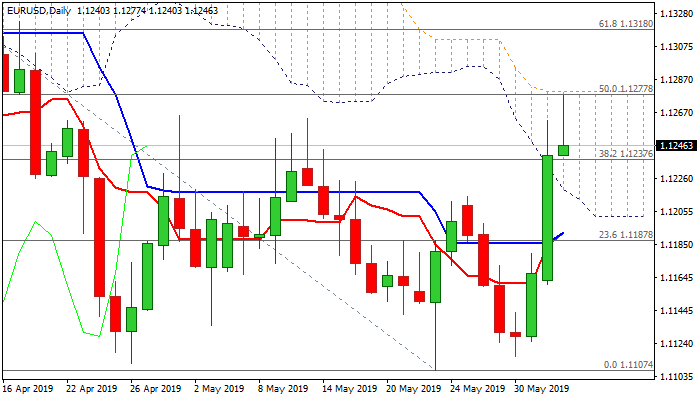
The Euro extends advance of past two days (Monday's 0.69% rally marks the biggest one-day gain since 25 Jan) to test key barriers at 1.1277/79 (50% retracement of 1.1448/1.1107 / 100SMA / daily cloud top) in early Tuesday's trading.
Improved sentiment on weaker dollar fuels Euro's recovery, which is also helped by strong bullish momentum, but bulls show hesitation.
Overall trend is still bearish and risk of recovery stall exists as three-day recovery may offer better selling opportunity on rejection at key barriers.
Return and close below 1.1220/15 (broken 55SMA / former high of 27 May / Fibo 38.2% of 1.1111/1.1277 recovery leg) would generate bearish signal, which will be confirmed on extension below a cluster of converged daily MA's at 1.1185/80.
Firm break above 100SMA / daily cloud top, on the other side, will generate bullish signal for extension of recovery phase towards 1.1318/23 (Fibo 61.8% of 1.1448/1.1107 / mid-Apr lower platform).
Res: 1.1277, 1.1323, 1.1367, 1.1375
Sup: 1.1237, 1.1215, 1.1180, 1.1160
NZD/USD Bounce At 0.6558 On A Retest Towards 0.6620
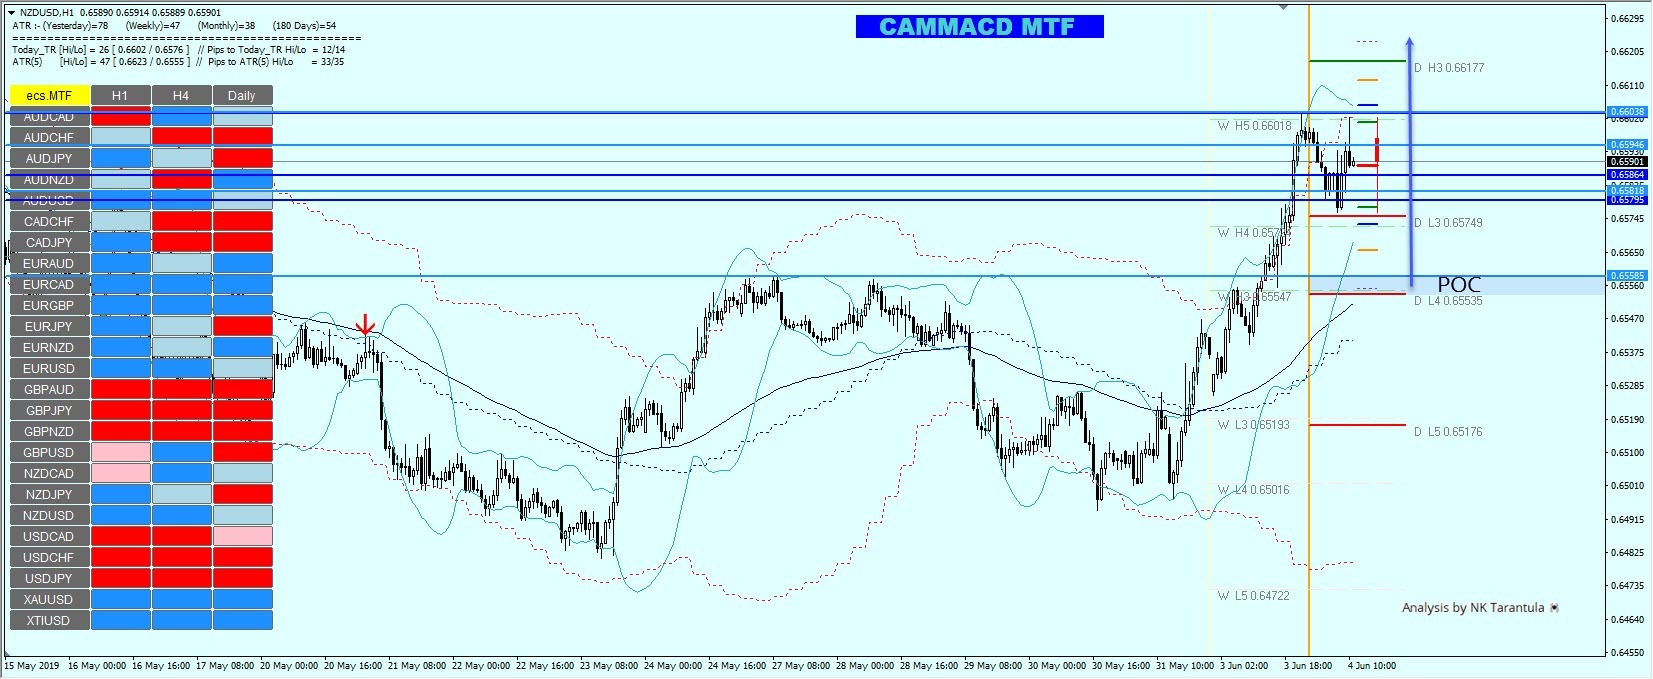
The NZD/USD has formed a BPC pattern (breakout-pullback-continuation) straight above the order block at 0.6558.
Another retest of the 0.6545-58 zone could show fresh buyers towards 1.6585 and 1.6603. A breakout above 0.6603 should target for 0.6620. The ATR (5) is only 47 pips, so ideal situation would be a retest of the POC zone. In that case buyers would have much better price to long the Kiwi. The price will be bearish only below 0.6515. At this point the NZD is strong and buying the dip seem to be a valid option.
USD Index Can Be Completing Its Five-Wave Move
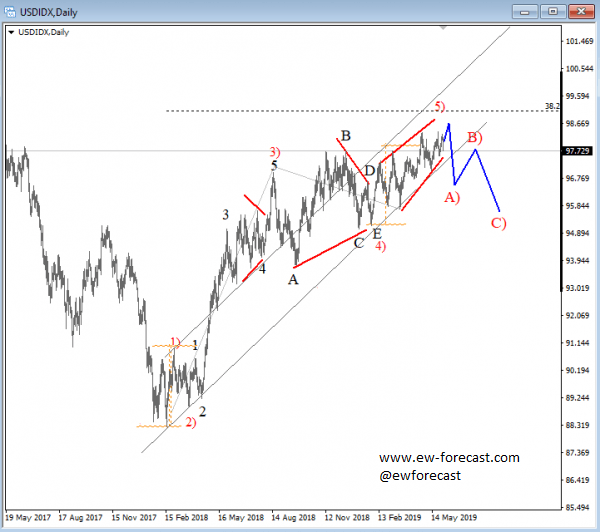
USD Index is in a bullish impulse up from 2018 lows; now with final wave 5) in play. Wave 5) that is unfolding out of a triangle correction can be underway to around 98.50/99.00 region, where bulls may slow down if we consider that legs out of a triangle are final in the sequence, so a higher degree retracement may occur during summer time.
USD Index, Daily
WTI Futures Hovers Above 4-Month Low, Bearish Bias May Run Out Of Steam
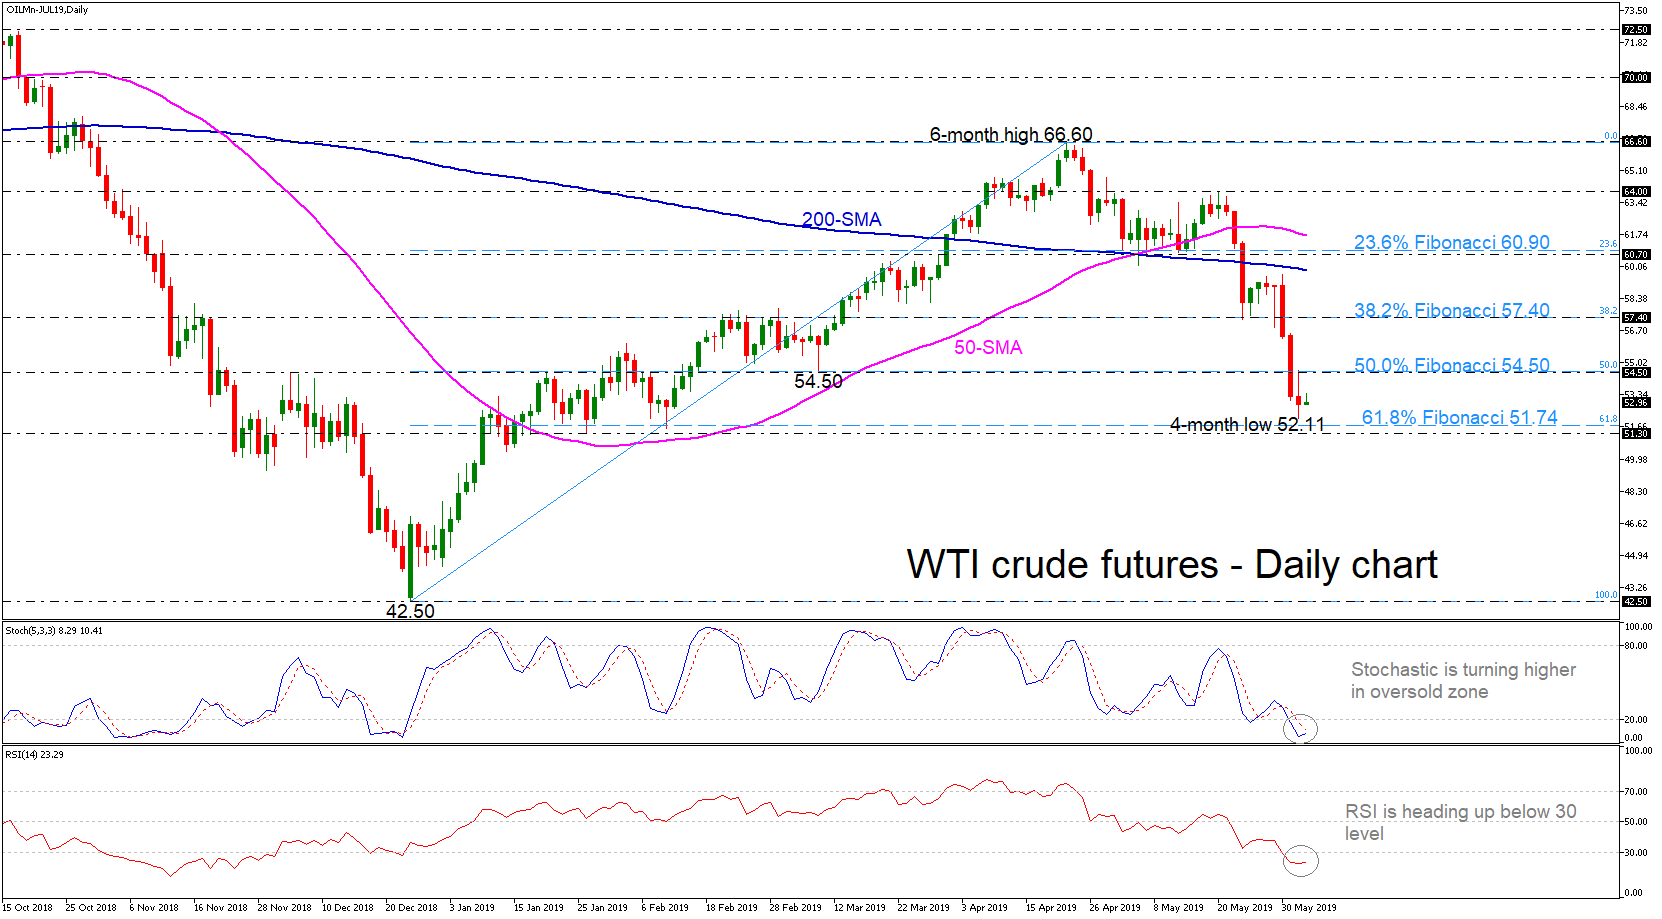
WTI crude oil futures declined considerably towards a fresh four-month low of 52.11 on Monday, erasing the medium-term ascending movement in the daily chart.
However, the downside momentum appears to have run out of steam as prices have been attempting and failing to close below the 61.8% Fibonacci retracement level of the upleg from 42.50 to 66.60 near 51.74. The stochastic oscillator is returning higher in the oversold zone, while the RSI is trying to gain ground below the 30 level.
Should oil prices manage to strengthen the positive momentum, the next resistance could come around the 50.0% Fibonacci mark, which overlaps with the 54.50 barrier. A break above this region would shift the short-term bias to slightly bullish and open the way towards the 38.2% Fibonacci of 57.40. Above this level, the next target could come from the 200-day moving average currently at 59.86.
On the other hand, if prices tumble below the 61.8% Fibonacci (51.74) and the 51.30 support could drive the market until the next support, which is appearing at the 42.00 psychological level. A potential downside violation could increase negative pressure until the 42.50 barrier, identified by the low on December 26.
In the near-term, the bias remains negative since prices hold below all the moving average lines, but momentum indicators signal that this rally may came to an end. So, traders should be waiting for a jump above 50.0% Fibonacci for positive orders, or a drop below 61.8% Fibonacci for more downside movement.
GBPUSD Recoups Losses But Downside Risks Not Faded Yet
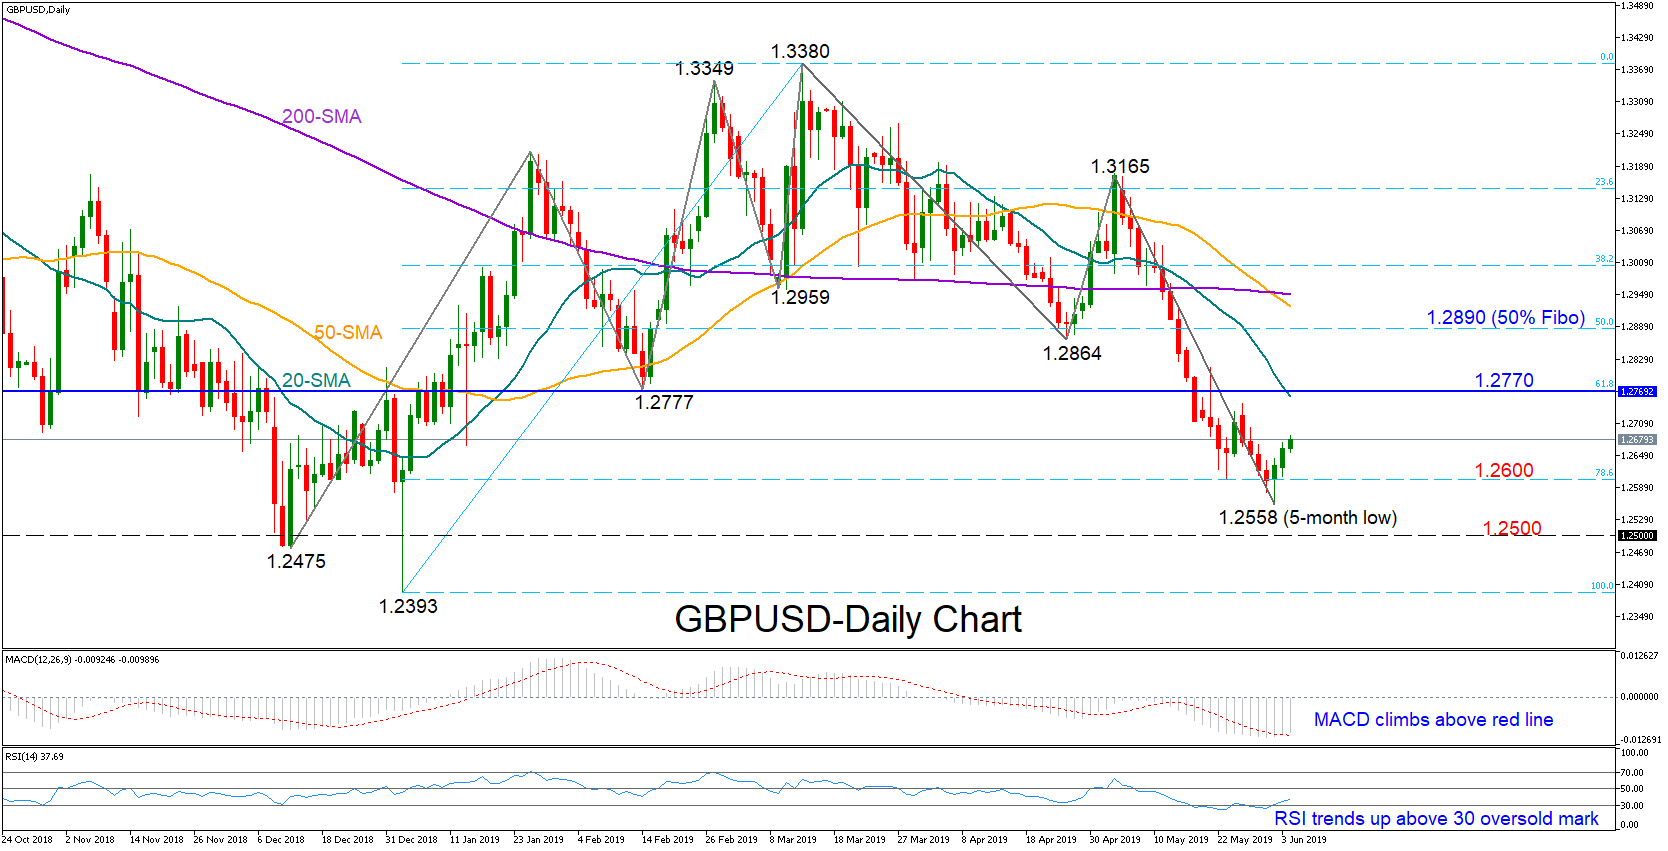
GBPUSD switched to recovery mode after bottoming to a five-month low of 1.2558 on Friday. With the RSI strengthening above its 30 oversold level and the MACD surpassing its red signal line, the pair may gain further ground in the short-term. Yet downside risks remain as long as the indicators hold in bearish territory. Note that the market has violated its December upward pattern after the drop below 1.2864.
Immediate resistance to upside movements could emerge around 1.2750 but a closing price above 1.2770 – the 61.8% Fibonacci of the 1.2393-1.3380 bullish wave – could prove more important for the rally to continue. Even higher, a taller wall could be standing around the previous low of 1.2864.
The 78.6% Fibonacci of 1.2600 has proven a reliable support level in previous sessions and therefore should be closely watched in case negative momentum resumes. Even deeper, a significant decline below the five-month low of 1.2558 would open the way towards the 1.25-1.2475 restrictive area.
In the medium-term time-frame, the outlook turned more bearish after the drop below the 61.8% Fibonacci. The falling 50-day simple moving average (SMA), which crossed under the 200-day SMA on Friday, could be a signal that a bull market may come later than sooner.
In brief, downside risks have somewhat decreased in the short-term as the technical indicators are supporting a bullish retracement, while in the medium-term the bearish outlook has turned stronger.
Dollar Extends Slide As Fed Rate Cut Bets Intensify, Powell Speech Eyed
- US dollar continues to nosedive as Treasury yields touch fresh lows on rising rate cut expectations
- RBA cuts rates but Australian dollar defiant as it climbs to 3-week high
- Tech stocks tumble as US giants, including Facebook and Apple, face antitrust probe
Dollar sell-off shows no sign of abating
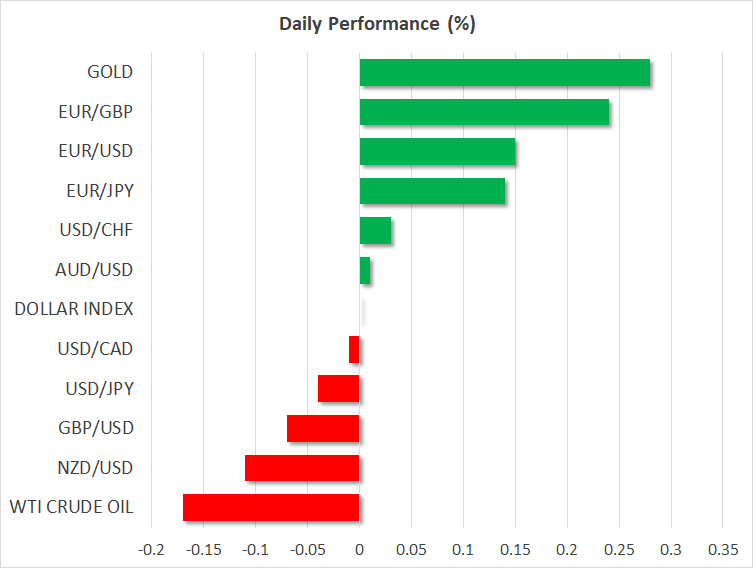
The US currency is headed for its third straight day of sharp losses against a basket of currencies as traders continue to price in an increasing probability that the Federal Reserve will be forced to cut interest rates later this year. The yield on 10-year Treasury notes tumbled to a 21-month low of 2.061% yesterday, while the two-year yield, which tends to follow the Fed funds rate closely, fell as low as 1.812%, widening the gap with the Fed funds target range of 2.25-2.50%.
The dramatic moves in Treasury yields reflect growing expectations that the Fed will soon embark on an easing path. St. Louis Fed President James Bullard fuelled such bets yesterday, becoming the first Fed official to signal a cut, saying “A downward policy rate adjustment may be warranted soon to help re-center inflation and inflation expectations at target”. This puts even more focus on Fed Chairman Jerome Powell’s remarks when he speaks later today at the Fed Listens Conference in Chicago at 13:55 GMT.
Euro and gold lifted by dollar’s slump
The dollar was last trading near 5-month lows versus the yen at just below the 108 level, while the dollar index was struggling to hold onto to the 97 level. The weaker greenback was a boon for the struggling euro, helping the single currency climb to more than one-month high of $1.1277. However, the euro’s gains were capped by ongoing worries of another clash between Italy and the EU as the European Commission considers whether to begin disciplinary procedure against the country over its high budget deficit.
Gold has been another winner during the greenback’s freefall, with the precious metal hitting a 3-month high of $1328.69 an ounce today. The commodity could be in line for even steeper gains should the Fed begin to signal a rate cut and US yields decline even lower.
Tech stocks under pressure from US antitrust probe
Global stocks remained on the backfoot amid the deepening trade row with China and possible US tariffs on Mexico. Adding to the gloomy outlook was a worse-than-expected ISM manufacturing PMI out of the US yesterday. The closely watched manufacturing activity gauge recorded its weakest reading in May since October 2016, heightening fears about a slowing US economy.
Making matters worse for the equities market was a widening antitrust probe by US authorities on Wall Street’s tech giants. The Federal Trade Commission and the Department of Justice are reportedly examining whether to start formal investigations into Facebook, Amazon, Apple and Alphabet’s Google.
Shares of all four companies plummeted overnight in US trading, sending the Nasdaq Composite to its lowest close in four months. The tech-heavy Nasdaq is now officially in correction territory, having fallen more than 10% from its record high in late April following yesterday’s losses.
Aussie shrugs off RBA rate cut
As expected, the Reserve Bank of Australia cut its cash rate to an all-time low of 1.25% today, hoping to boost stubbornly low inflation and softening growth. However, although the RBA kept the door open for further rate cuts, it failed to provide clear signals on the future rate path. This fell short of expectations of a more dovish RBA by many traders and the aussie quickly bounced back after a small dip following the announcement to rise to a three-week high of $0.6993.
The New Zealand dollar also advanced against the greenback to briefly top the $0.66 level, while the Canadian dollar firmed to around C$1.3430 per US dollar as oil prices stabilized from the recent sharp drops.
Coming up later today, flash inflation figures from the Eurozone will be important ahead of the ECB policy meeting on Thursday, and April factory orders will be watched in the US for more possible signs of a slowdown.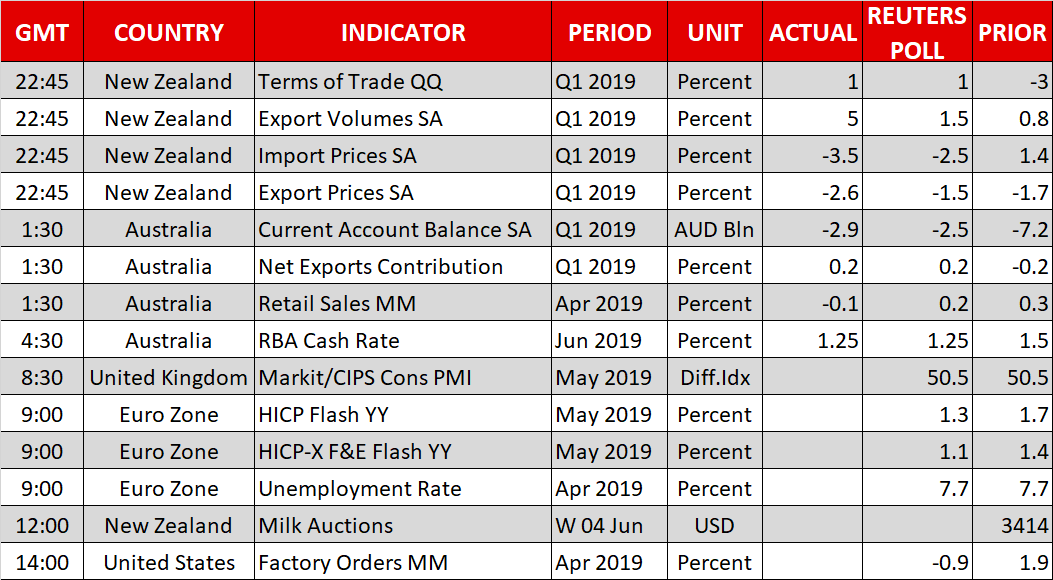
GBP/JPY Daily Outlook
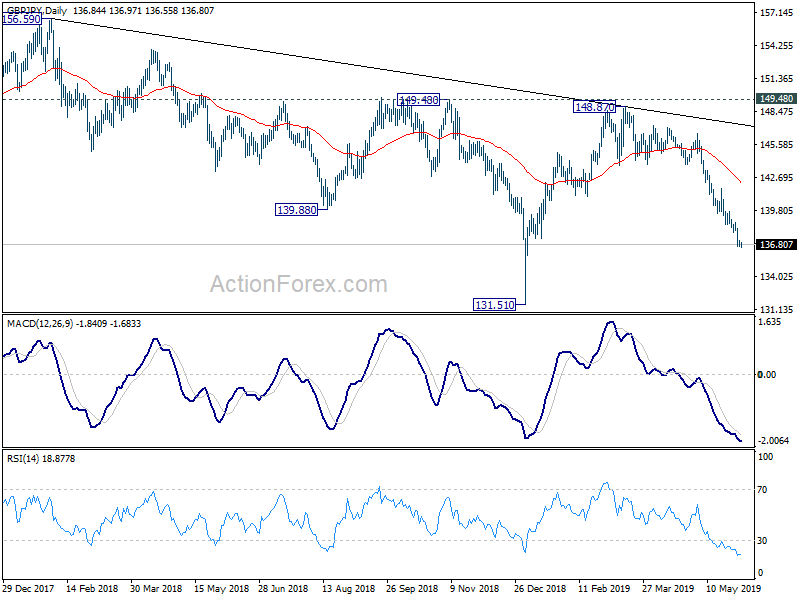
Daily Pivots: (S1) 136.60; (P) 136.87; (R1) 137.11; More...
No change in GBP/JPY's outlook and intraday bias remains on the downside. Current fall from 148.87 is in progress for retesting 131.51 low. On the upside, break of 137.87 minor resistance will turn intraday bias neutral and bring consolidations first, before staging another fall.
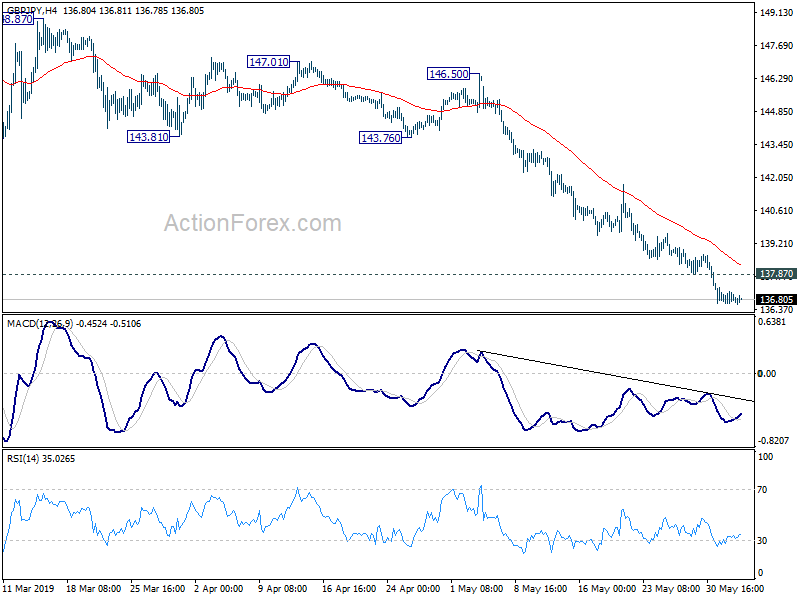
In the bigger picture, current development suggests that GBP/JPY medium term fall from 156.59 (2018 high) is still in progress. Break of 131.51 will target 122.36 (2016 low). Structure of such decline is corrective looking so far, arguing that it's just the second leg of consolidation from 122.36. Thus, we'd expect strong support from 122.36 to contain downside to bring reversal.
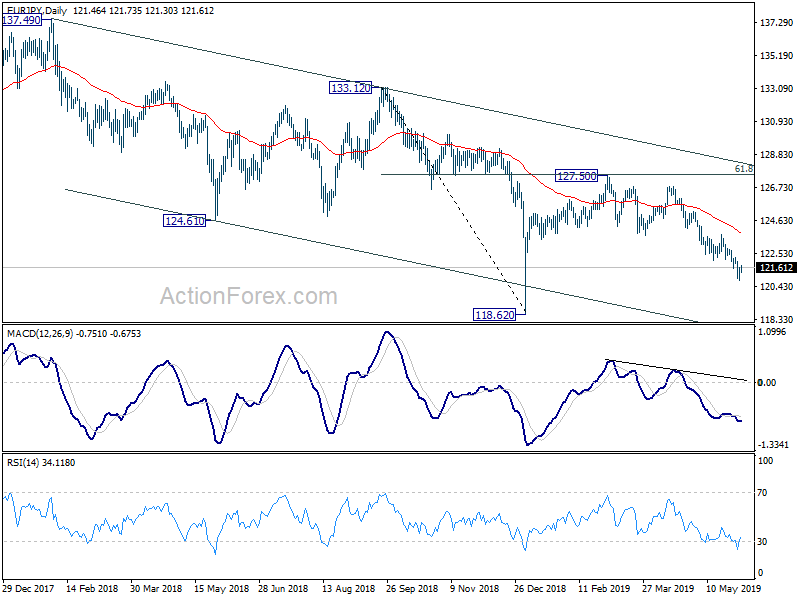
EUR/JPY Daily Outlook
Daily Pivots: (S1) 120.95; (P) 121.30; (R1) 121.83; More....
A temporary low is formed at 120.78 in EUR/JPY and intraday bias is turned neutral for consolidation. Further recovery could be seen but upside should be limited below 123.73 resistance to bring fall resumption. On the downside, break of 120.78 will resume the fall from 127.50 and target 118.62 low next.
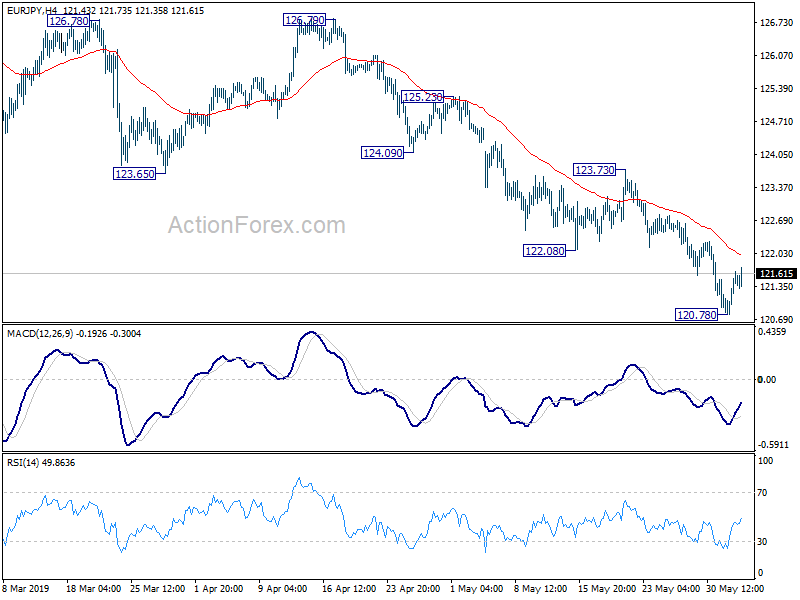
In the bigger picture, down trend from 137.49 is still in progress with the cross staying inside long term falling channel. Break of 118.62 will extend the fall to 109.48 (2016 low). On the upside, break of 123.73 resistance is needed to be the first sign of medium term reversal. Otherwise, outlook will remain bearish in case of strong rebound.