Sample Category Title
ETHUSD Clear Range Break Needed
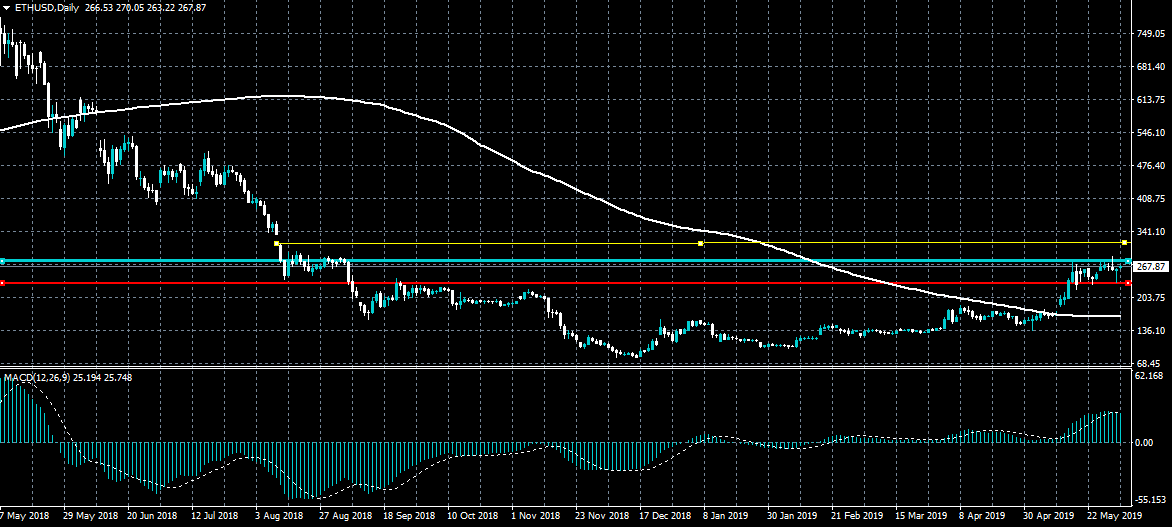
Ethereum continues to stage a recovery in early Monday trade after the second largest cryptocurrency found solid technical support from the $230.00 level. The next strong directional move in the ETHUSD pair will likely come when a confirmed breakout occurs from the $230.00 to $285.00 price range. Overall, bulls need to post a fresh yearly trading high to negate a potential double-top pattern formation on the lower time frames.
The ETHUSD pair is intraday bullish while trading above the $245.00 level, key resistance is found at the $285.00 and $325.00 levels.
If the ETHUSD pair trades below the $245.00 level, key support is found at the $230.00 and $205.00 levels.
EURUSD Upside Limited Until ECB
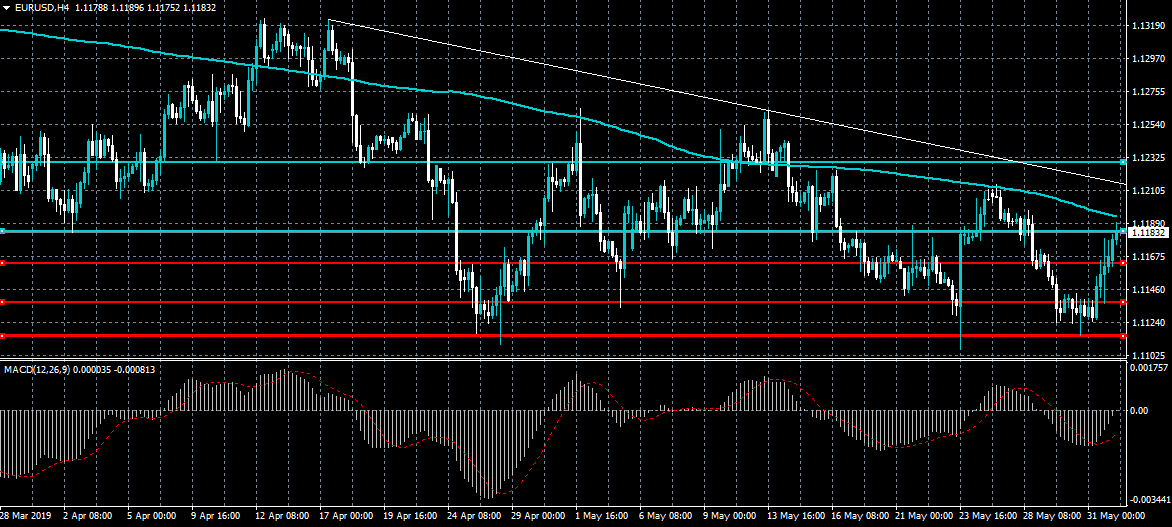
The euro currency remains fairly well supported against the US dollar in early Monday trade, following a late-week sell-off in the US dollar index on Friday. The EURUSD pair could still recover above the 1.1200 level on weaker than expected US data later today, although the upside is likely to be limited until the ECB meeting. Bulls ideally need to negate the bearish pattern on the four-hour time frame, while bears need a strong move below the 1.1110 level.
The EURUSD pair is only bearish while trading below the 1.1165 level, key technical support is found at the 1.1110 and 1.1060 levels.
If the EURUSD pair holds above 1.1165 level, key technical resistance is found at the 1.1216 and 1.1230 levels.
USDJPY 107.40 Bearish Target
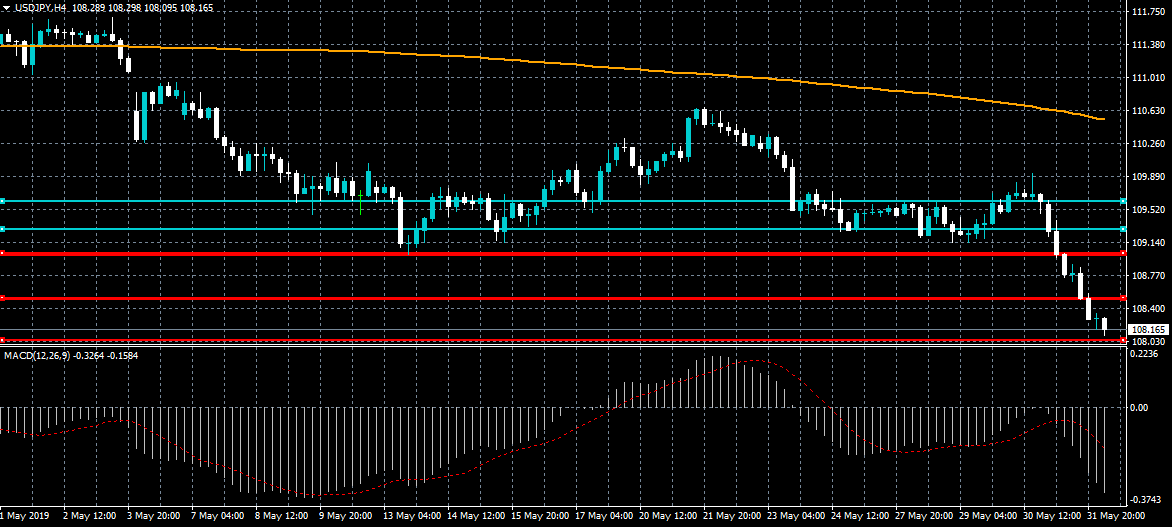
The US dollar starts the new trading month under heavy downside pressure against the Japanese yen following the bearish breakout below the 109.00 level. Further losses in the USDJPY pair still appear possible as the bearish head and shoulders pattern has a target of 107.40 level. The United States ISM report later today is likely to have a big impact on the direction of the US dollar.
The USDJPY pair is heavily bearish while trading below the 108.70 level, key support is found at the 108.00 and 107.70 levels.
If the USDJPY pair trades above the 108.70 level, key technical resistance is found at the 109.00 and 109.30 levels.
Markets Tank As Trade Conflicts Continue
The Australian dollar jumped today after Caixin released China’s PMI data for the month of May. The data showed that the PMI remained at 50.2, which topped the analyst forecasts of 50.0. Meanwhile, data from Australia disappointed, with the manufacturing PMI declining to 51.0 from the previous 50.9. The ANZ job advertisements declined by -8.4% in April. This data came ahead of the RBA interest rates decision, which is expected tomorrow and the final reading of Q1 GDP, which is expected on Wednesday.
It was a sea of red in the Asian stocks as the trade war continued over the weekend. On Sunday, China reacted to the Huawei ban by starting to investigate FedEx, the American shipping giant. The country also announced that it would ramp up investigations of business practices of other US companies. Nonetheless, the country showed interest in having talks with the US on these issues. In China, the Shanghai Index declined by 20 points while in Japan, the Nikkei declined by 255 points. In the US, Dow and S&P 500 futures declined by 150 and 15 points respectively.
Later today, investors will watch out for key economic data from a number of countries. In the morning, Switzerland will release its CPI data, which is expected to show that the CPI rose by 0.6% in May. This will be slightly lower than the 0.7% in April. In Turkey, the CPI is expected to have eased slightly in May to 19.10% from the previous 19.50%. In Sweden, the retail sales are expected to have risen by 0.4% in April. In Germany, the manufacturing PMI is expected to have remained at 44.3. In the US, data from ISM is expected to show that the manufacturing PMI rose slightly to 53.0.
AUD/USD
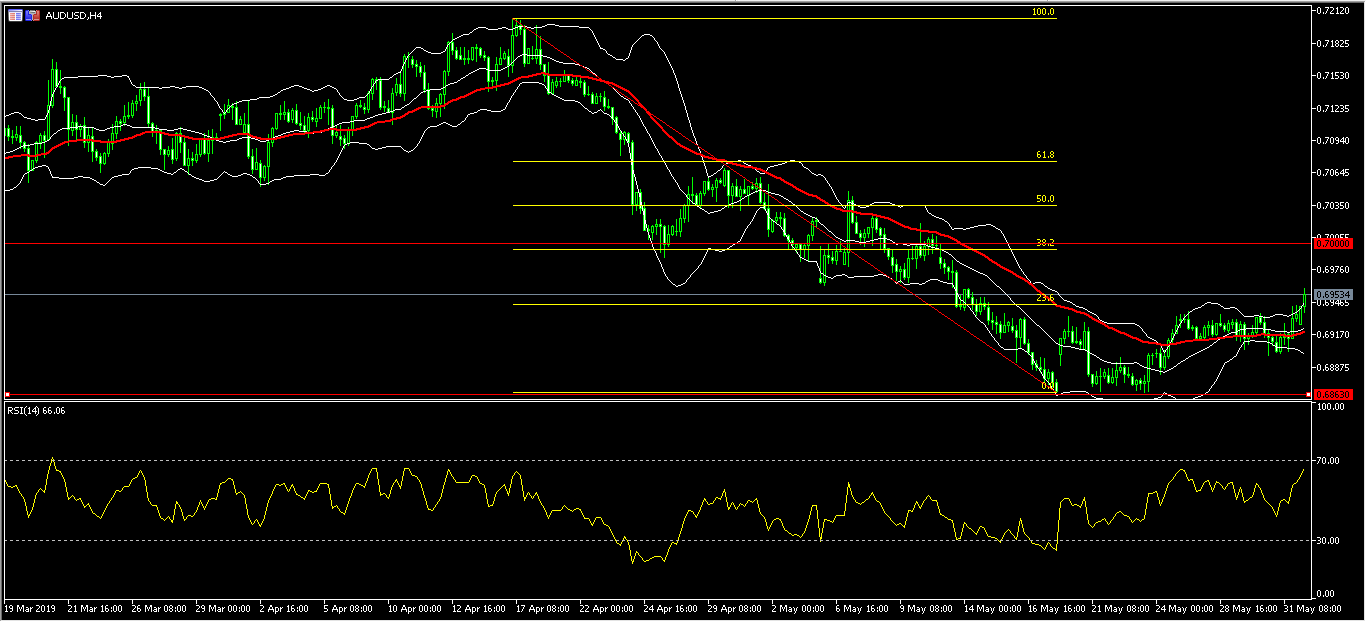
The AUD/USD pair rose to a high of 0.6958. This was the highest level since May 14. On the four-hour chart, the pair’s price is slightly above the 23.6% Fibonacci Retracement level. This price is along the upper line of the Bollinger Bands and above the 50-day moving averages. The RSI has moved up, close to the overbought level of 70. The pair will likely continue to move up to test the 38.2% Fibonacci Retracement level of 0.7000.
EUR/USD
The EUR/USD pair rose sharply to a high of 1.1190 as the dollar weakened following the developments on trade. On the hourly chart, the pair is above the 50-day and 25-day moving averages, while the RSI has almost moved to the overbought level of 70. The pair is trading along the upper line of the Bollinger Bands while the momentum indicator is rising. The pair will likely test the important resistance level of 1.1200.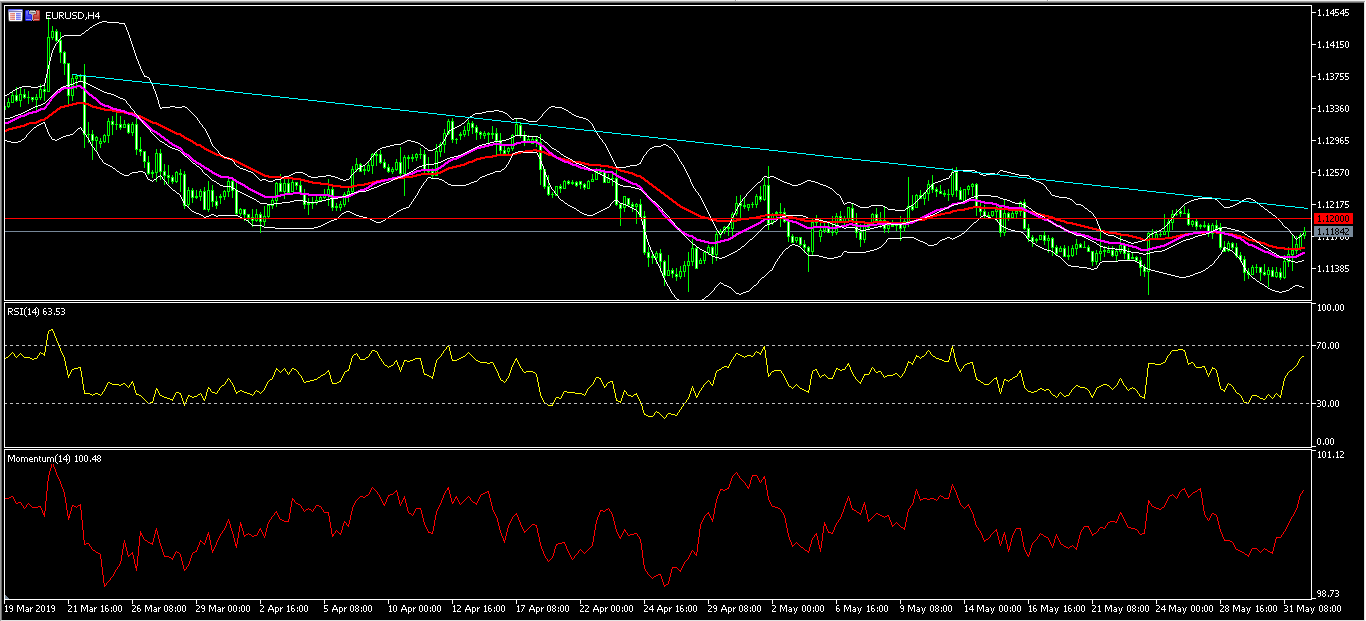
XBR/USD
The XBR/USD pair declined sharply as the trade war rhetoric continued over the weekend. It also declined as Russia withdrew defense support to Venezuela. The pair reached a low of 60.50. On the hourly chart, the price is trading along the lower line of the Bollinger Bands while the RSI dropped to the oversold zone. The Parabolic SAR dots are on the right side of the price. While the pair will likely continue the downward trend, there is a likelihood that it will reverse.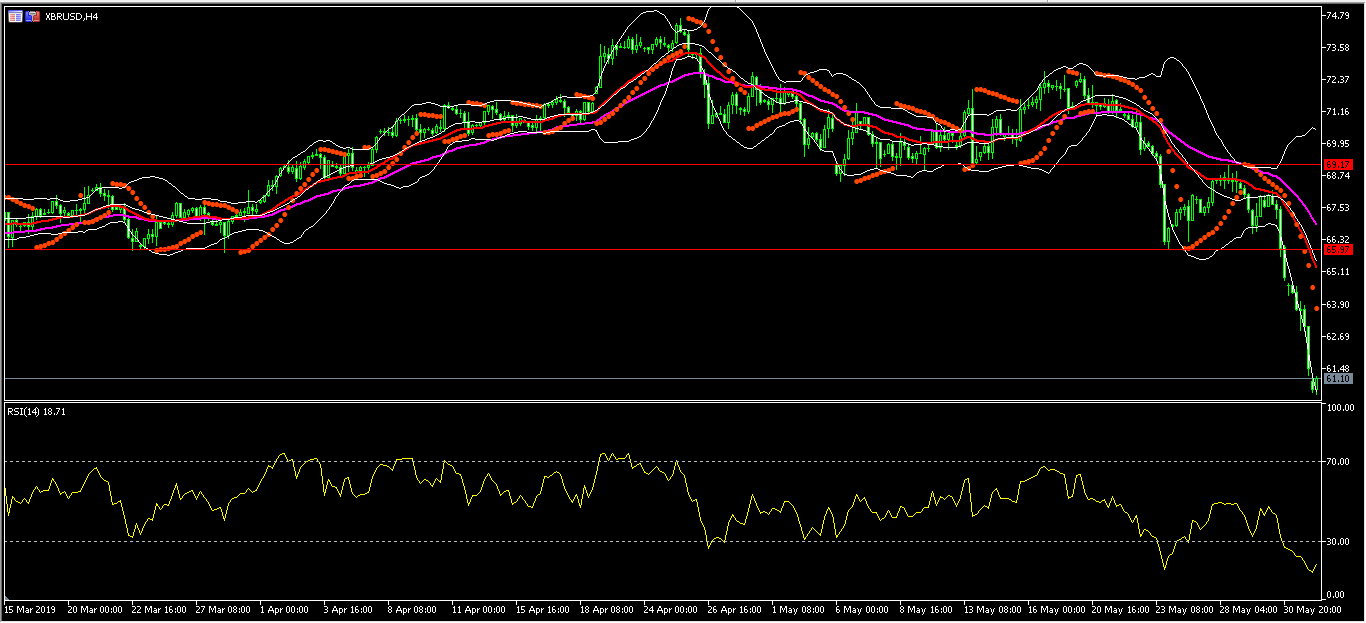
GBP/USD Bullish Pullback Aims For 1.27 Within Downtrend
The GBP/USD seems to be building a WXY (orange) correction within wave 4 (green). Price is expected to retest the 23.6% or 38.2% Fibonacci retracement levels of wave 4 vs 3, which should be bearish bouncing spots for a bearish trend continuation. An immediate breakout below 1.2575 could indicate a failure of price to move higher and start a move lower towards 1.25.
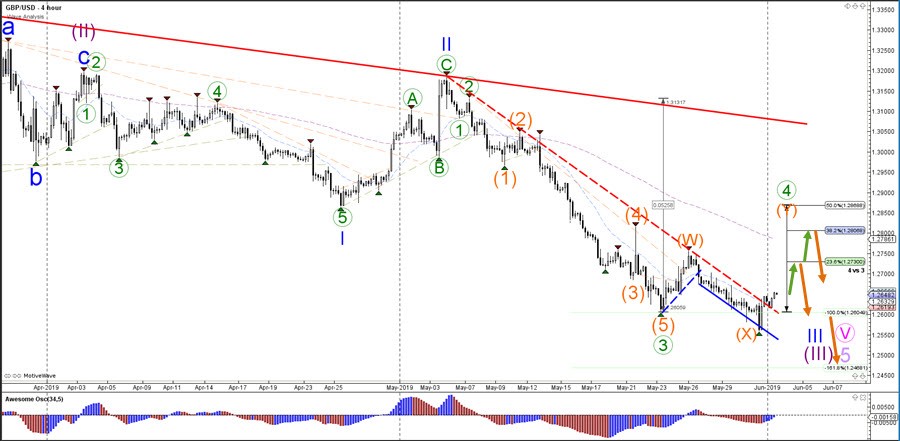
The GBP/USD seems to have completed a bearish ABC zigzag (dark red) pattern within wave X (orange) and could be ready for a similar bullish ABC (dark red) wave pattern. If the expected wave pattern is correct then the Fibonacci levels of wave B vs A should be used a support and price may not break below the previous bottom.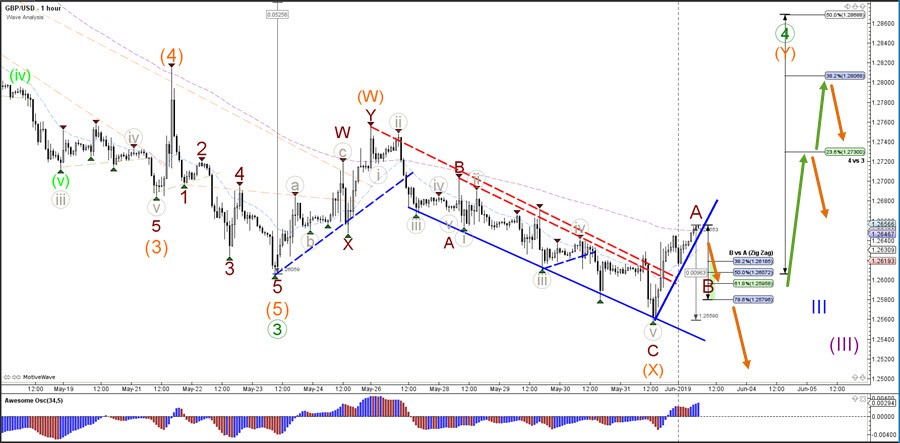
Australian Iron Ore Exports Close to Record in May
In this regular update we use high frequency shipping data to analyse current trends and drivers of bulks exports from Australia and assess the impact of macro and micro economic factors on demand and prices.
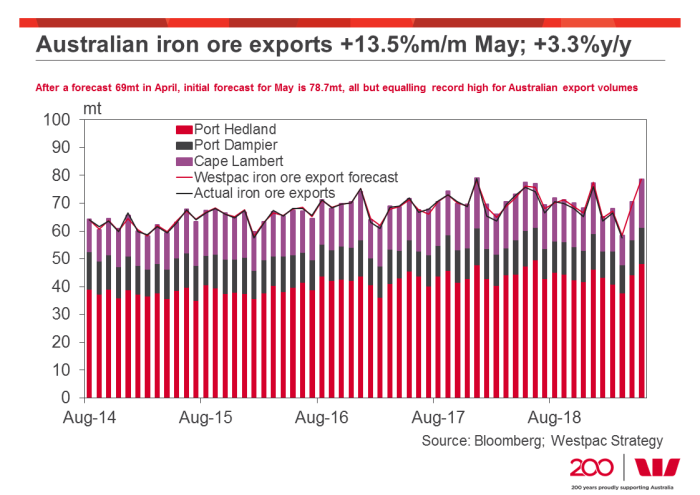
Our initial forecasts for iron ore exports volumes from Australia in May is 78.7mt up +13.5%mm and up +21% versus the average of the last 3 months. This reflects a further normalisation in exports after the impact from TC Veronica in March.
Total exports all but equalled the record seen in December 2017, with all 3 ports that we track having close to record months. Port Hedland saw its strongest month of exports since June 2018; Cape Lambert since May 2018 and Port Dampier since Feb 2018.
Though global supplies still tight
Shipping data also reveals a modest improvement in shipments from Brazil in May too, with a forecast 24mt in exports, up +3% versus the average over the last 3 months. While exports appear to have picked up modestly, if our forecast is correct, they would still be down -38%yy and -32% 3myy.
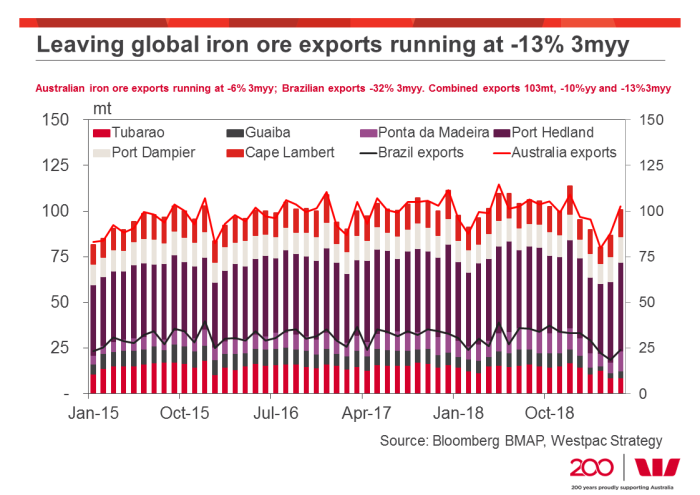
This then makes the obvious point; with Australian iron ore exports running at -6% 3myy and Brazil -32% 3myy, combined exports are down -13% over the last 3 months versus the same period a year ago, emphasising the impact that recent events have had on global supplies over the March/ May period.
Germany’s Consumer Price Inflation Slowed In May
For the 24 hours to 23:00 GMT, the EUR rose 0.32% against the USD and closed at 1.1169 on Friday.
Macroeconomic data showed that Germany’s preliminary consumer price inflation (CPI) slowed to 0.2% on a monthly basis in May, amid decline in services and household energy and undershooting market expectations for a gain of 0.3%. In the prior month, the CPI had recorded a level of 1.0%. Moreover, the nation’s retail sales increased 4.0% on an annual basis in April, compared to a drop of 2.1% in the previous month. Market participants had envisaged retail sales to register a rise of 1.4%.
In the US, data indicated that the Chicago Fed Purchasing Managers’ Index climbed to a level of 54.2 in May, more than market consensus for a rise to a level of 54.0. In the previous month, the index had registered a level of 52.6. Further, the US final Reuters/Michigan consumer sentiment index advanced to a level of 100.0 in May, less than market expectations for a rise to a level of 101.5. The index had recorded a level of 97.2 in the prior month, while preliminary figures had recorded a rise to a level of 102.4. Additionally, the nation’s personal spending rose 0.3% on a monthly basis in April, higher than market expectations for a gain of 0.2%. Personal spending had recorded a revised advance of 1.1% in the previous month. Also, the nation’s personal income climbed 0.5% on a monthly basis in April, surpassing market anticipations for an increase of 0.3%. In the preceding month, personal income had registered a rise of 0.1%.
In the Asian session, at GMT0300, the pair is trading at 1.1189, with the EUR trading 0.18% higher against the USD from Friday’s close.
The pair is expected to find support at 1.1146, and a fall through could take it to the next support level of 1.1104. The pair is expected to find its first resistance at 1.1210, and a rise through could take it to the next resistance level of 1.1232.
Looking ahead, traders would await the Markit manufacturing PMI for May, scheduled to release across the euro-bloc. Later in the day, the US Markit manufacturing PMI and the ISM manufacturing, both for May, followed by construction spending data for April, will garner significant amount of investor’s attention.
The currency pair is trading above its 20 Hr and 50 Hr moving averages.

UK’s Net Consumer Credit Advanced At Its Slowest Pace Since 2014 In April
For the 24 hours to 23:00 GMT, the GBP rose 0.25% against the USD and closed at 1.2641 on Friday.
On the data front, UK's seasonally adjusted Nationwide house prices index unexpectedly declined 0.2% on a monthly basis in May, defying market expectations for a steady reading. In the prior month, the index had registered a revised rise of 0.3%. Meanwhile, the nation's net consumer credit rose £0.9 billion in April, rising at its slowest pace since 2014 and compared to a revised advance of £0.6 billion in the prior month. Market participants had anticipated net consumer credit to record a climb of £1.0 billion. Furthermore, Britain's mortgage approvals for house purchases climbed to a level of 66.3K in April, surpassing market consensus for a rise to a level of 63.7K. In the prior month, mortgage approvals for house purchases had recorded a revised reading of 62.6K.
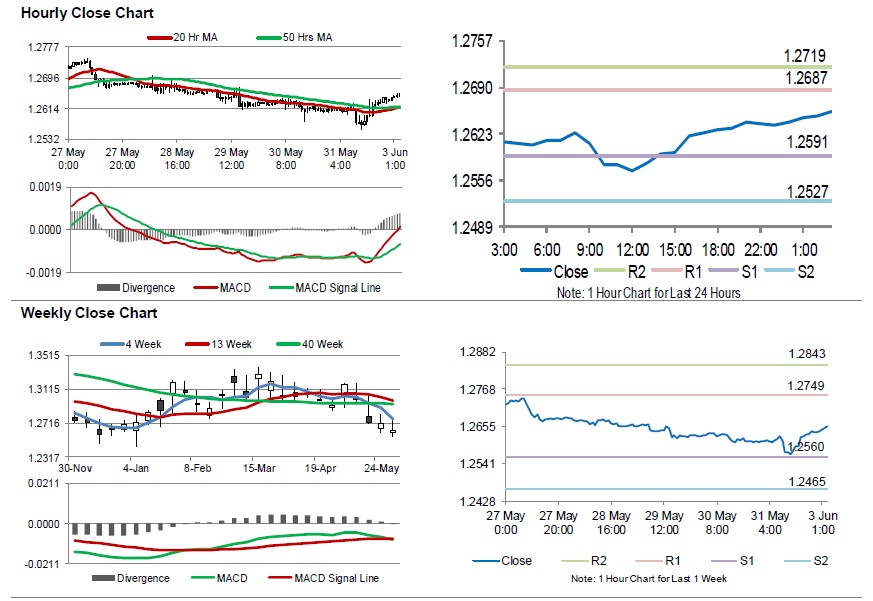
In the Asian session, at GMT0300, the pair is trading at 1.2655, with the GBP trading 0.11% higher against the USD from Friday's close.
The pair is expected to find support at 1.2591, and a fall through could take it to the next support level of 1.2527. The pair is expected to find its first resistance at 1.2687, and a rise through could take it to the next resistance level of 1.2719.
Going ahead, investors would keep an eye on UK's Markit manufacturing PMI for May, slated to release in a few hours.
The currency pair is trading above its 20 Hr and 50 Hr moving averages.
Japan’s Consumer Confidence Index Unexpectedly Declined In May
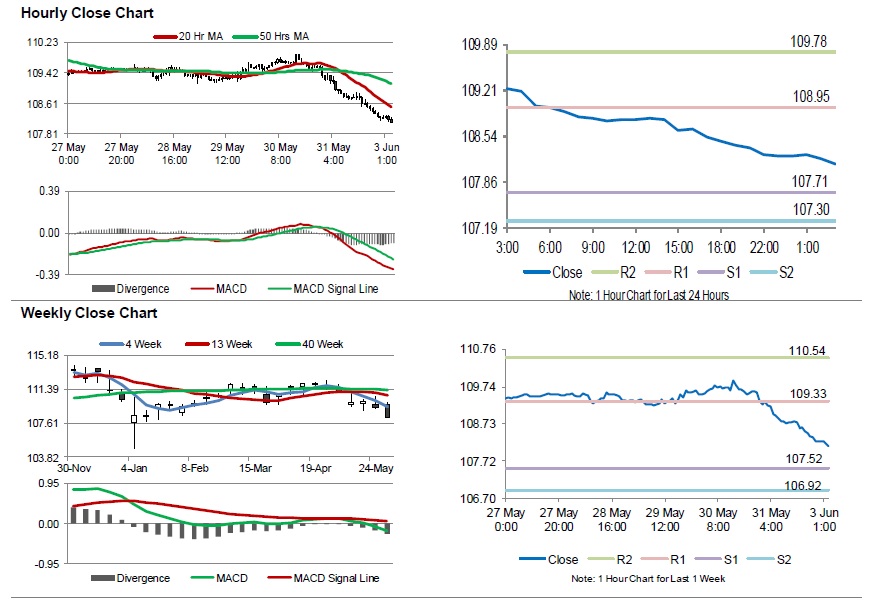
For the 24 hours to 23:00 GMT, the USD declined 1.11% against the JPY and closed at 108.36 on Friday.
Data showed that Japan's annualised housing starts dropped 5.7% on a yearly basis in April, more than market consensus for a fall of 0.6%. Housing starts had registered a rise of 10.0% in the prior month. Moreover, the consumer confidence index unexpectedly fell to a level of 39.4 in May, defying market expectations for an advance to a level of 40.7. In the prior month, the index had registered a level of 40.4. Further, the nation's construction orders tumbled 19.9% on an annual basis in April, following a gain of 66.1% in the preceding month.
In the Asian session, at GMT0300, the pair is trading at 108.13, with the USD trading 0.21% lower against the JPY from Friday's close. Overnight data showed that Japan's final Nikkei manufacturing PMI eased to 49.8 in May, compared to a reading of 50.2 in the previous month. The preliminary figures had recorded a drop to 49.6.
The pair is expected to find support at 107.71, and a fall through could take it to the next support level of 107.30. The pair is expected to find its first resistance at 108.95, and a rise through could take it to the next resistance level of 109.78.
The currency pair is trading below its 20 Hr and 50 Hr moving averages.
Switzerland’s Real Retail Sales Fell In April
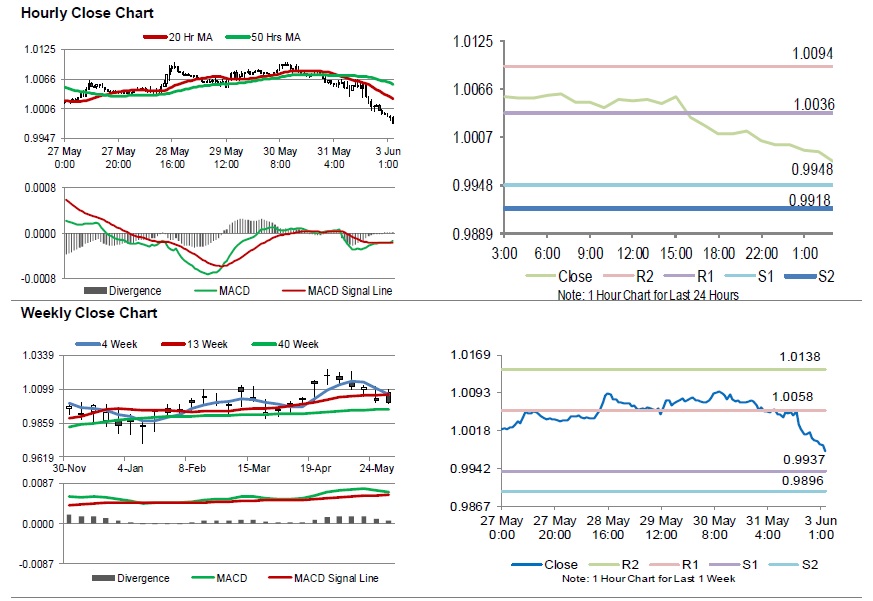
For the 24 hours to 23:00 GMT, the USD declined 0.62% against the CHF and closed at 1.0014 on Friday.
In economic news, Switzerland's real retail sales eased 0.7% on an annual basis in April, compared to market consensus for a fall of 0.8%. In the previous month, real retail sales had registered a similar fall.
In the Asian session, at GMT0300, the pair is trading at 0.9977, with the USD trading 0.37% lower against the CHF from Friday's close.
The pair is expected to find support at 0.9948, and a fall through could take it to the next support level of 0.9918. The pair is expected to find its first resistance at 1.0036, and a rise through could take it to the next resistance level of 1.0094.
Moving ahead, traders would closely monitor Switzerland's consumer price index and manufacturing PMI, both for May, set to release in a while.
The currency pair is trading below its 20 Hr and 50 Hr moving averages.