

Sample Category Title
Canada’s Annualised Gross Domestic Product Advanced In 1Q 2019
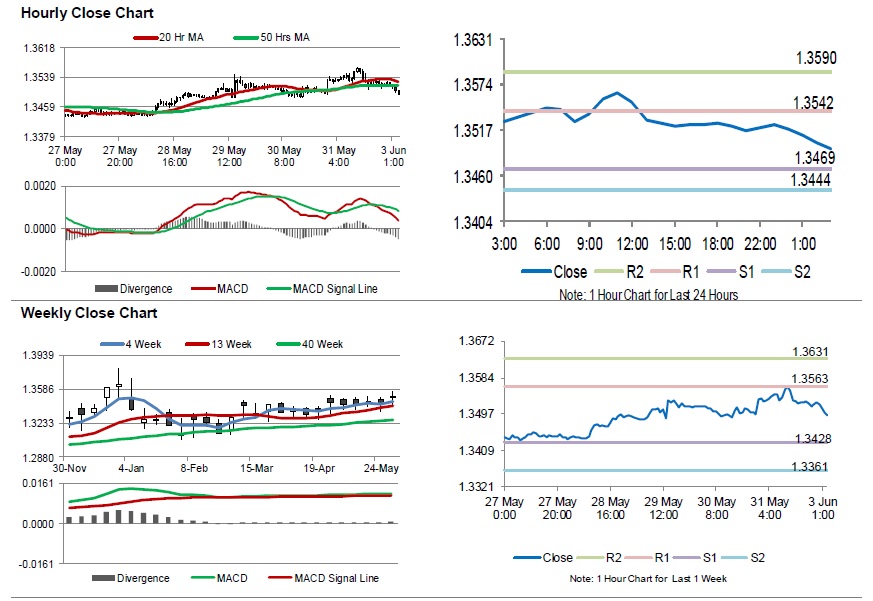
For the 24 hours to 23:00 GMT, the USD rose 0.16% against the CAD and closed at 1.3516 on Friday.
On the macro front, Canada's annualised gross domestic product rose 0.4% on a quarterly basis in 1Q 2019, compared to a revised gain of 0.3% in the prior quarter. Markets had anticipated the GDP to record a rise of 0.7%.
In the Asian session, at GMT0300, the pair is trading at 1.3494, with the USD trading 0.16% lower against the CAD from Friday's close.
The pair is expected to find support at 1.3469, and a fall through could take it to the next support level of 1.3444. The pair is expected to find its first resistance at 1.3542, and a rise through could take it to the next resistance level of 1.3590.
Trading trend in the Loonie today, is expected to be determined by Canada's MLI leading indicator for April and the RBC manufacturing PMI for May, slated to release later in the day.
The currency pair is trading below its 20 Hr and 50 Hr moving averages.
Aussie Trading Higher, Ahead Of RBA’s Interest Rate Decision
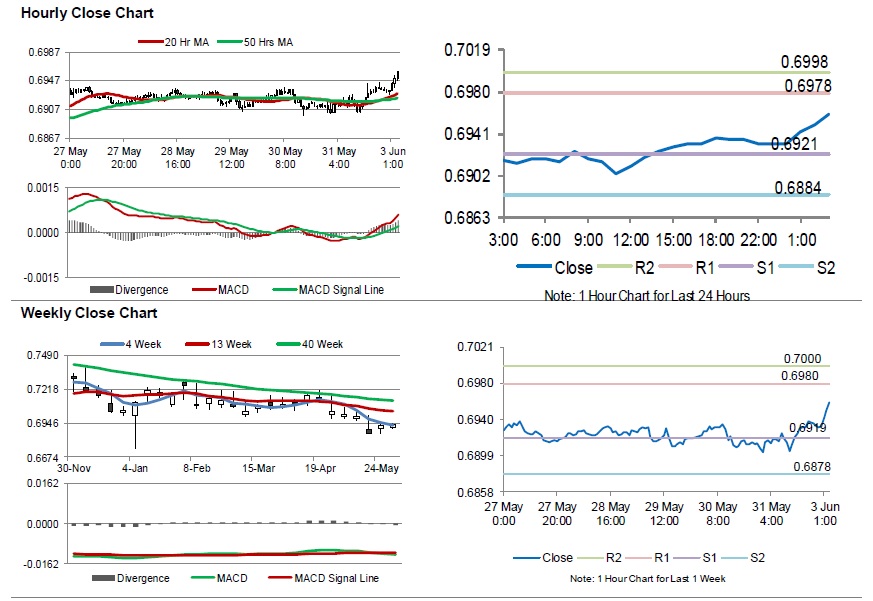
For the 24 hours to 23:00 GMT, the AUD rose 0.32% against the USD and closed at 0.6935 On Friday.
LME Copper prices declined 0.7% or $42.5/MT to $5780.5/MT. Aluminium prices declined 0.1% or $1.0/MT to $1761.0/MT.
In the Asian session, at GMT0300, the pair is trading at 0.6959, with the AUD trading 0.35% higher against the USD from Friday's close.
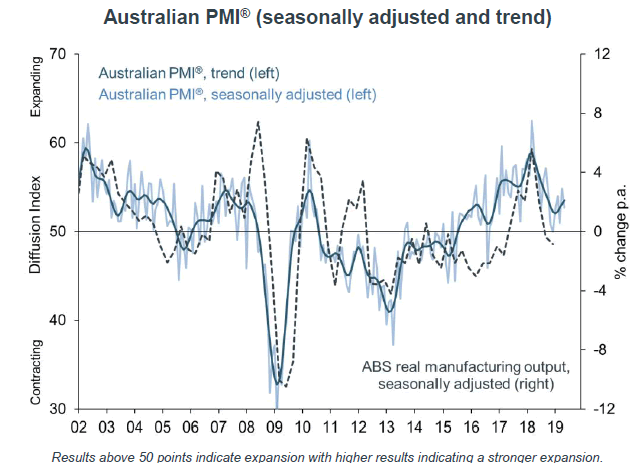
Overnight data showed that Australia's CBA manufacturing PMI dropped to a level of 51.0 in May, compared to a reading of 51.1 in the previous month. Additionally, the AiG performance of manufacturing index recorded a drop to 52.7 in May, compared to a level of 54.8 in the prior month.
Separately, in China, Australia's largest trading partner, the Caixin manufacturing PMI index remained unchanged at a level of 50.20 in May.
The pair is expected to find support at 0.6921, and a fall through could take it to the next support level of 0.6884. The pair is expected to find its first resistance at 0.6978, and a rise through could take it to the next resistance level of 0.6998.
Going forward, traders would await the Reserve Bank of Australia's interest rate decision along with Australia's retail sales for April, scheduled to release early morning tomorrow.
The currency pair is trading above its 20 Hr and 50 Hr moving averages.
Gold: Yellow Metal Extends Its Gains In The Morning Session
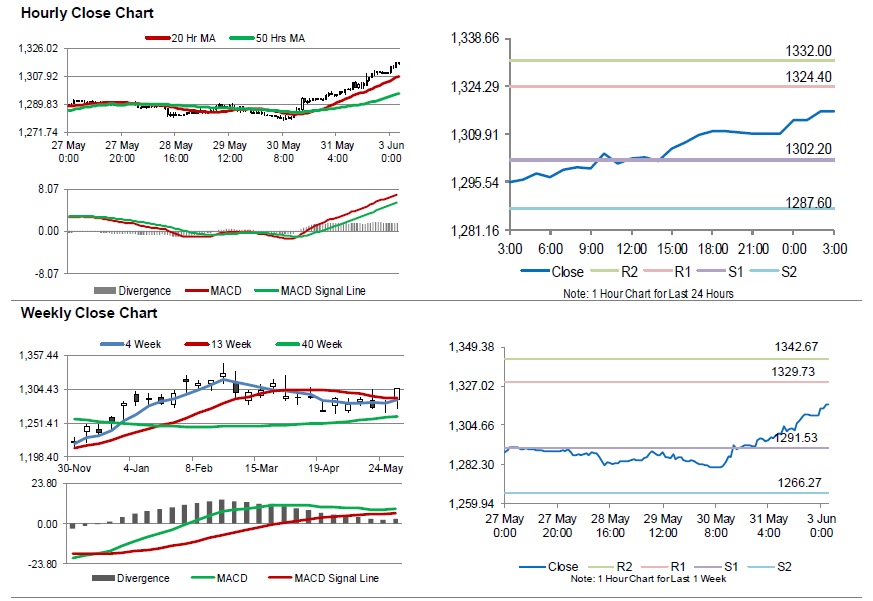
For the 24 hours to 23:00 GMT, Gold rose 1.38% against the USD and closed at USD1310.80 per ounce, amid weakness in the US dollar and US equities.
In the Asian session, at GMT0300, the pair is trading at 1316.80, with gold trading 0.46% higher against the USD from yesterday’s close.
The pair is expected to find support at 1302.20, and a fall through could take it to the next support level of 1287.60. The pair is expected to find its first resistance at 1324.40, and a rise through could take it to the next resistance level of 1332.00.
The yellow metal is trading above its 20 Hr and 50 Hr moving averages.
Silver: White Metal Trading On A Stronger Footing This Morning
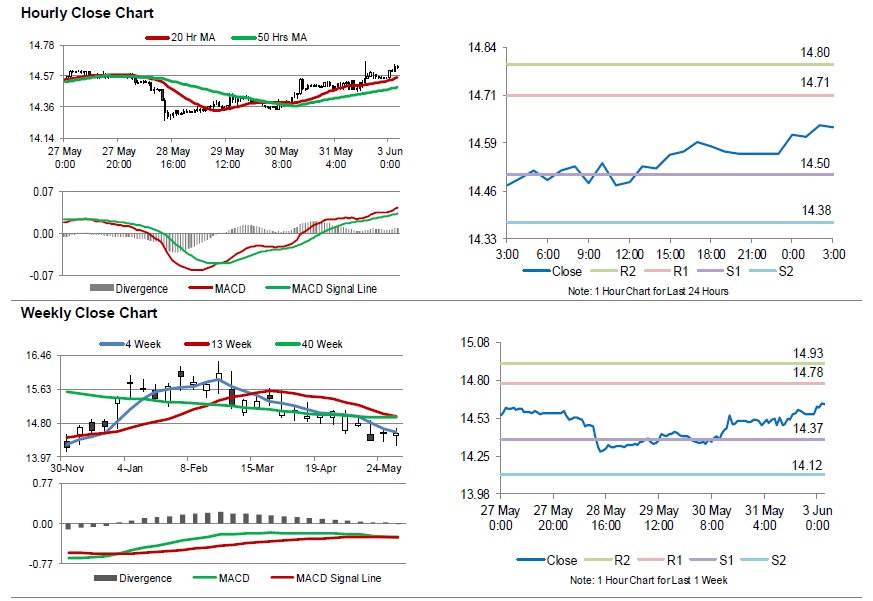
For the 24 hours to 23:00 GMT, Silver rose 0.41% against the USD and closed at USD14.56 per ounce, tracking gains in gold prices.
In the Asian session, at GMT0300, the pair is trading at 14.63, with silver trading 0.48% higher against the USD from yesterday’s close.
The pair is expected to find support at 14.50, and a fall through could take it to the next support level of 14.38. The pair is expected to find its first resistance at 14.71, and a rise through could take it to the next resistance level of 14.80.
The white metal is trading above its 20 Hr and 50 Hr moving averages.
Crude Oil: Oil Trading Extends Its Losses In The Asian Session
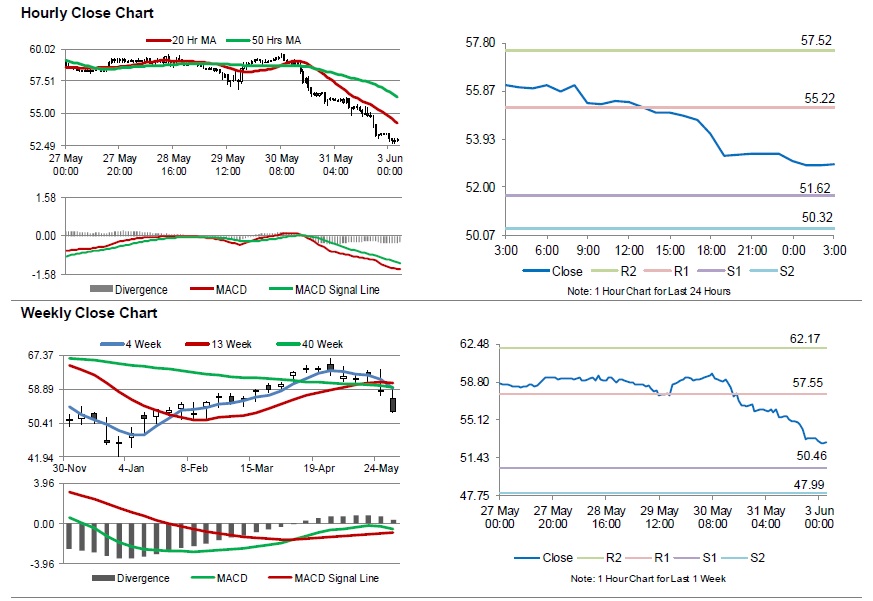
For the 24 hours to 23:00 GMT, Crude Oil declined 5.83% against the USD and closed at USD53.29 per barrel on Friday, after US President Donald Trump decided to impose tariffs on Mexico thereby raising concerns over global economy and energy demand. Additionally, fresh figures from Baker Hughes disclosed that the number of active oil rigs advanced by 3 to 800 in the week ended 31 May 2019.
In the Asian session, at GMT0300, the pair is trading at 52.93, with oil trading 0.68% lower against the USD from Friday’s close.
The pair is expected to find support at 51.62, and a fall through could take it to the next support level of 50.32. The pair is expected to find its first resistance at 55.22, and a rise through could take it to the next resistance level of 57.52.
Crude oil is trading below its 20 Hr and 50 Hr moving averages.
Market Woes Continue On Trade War Escalation
Market movers today
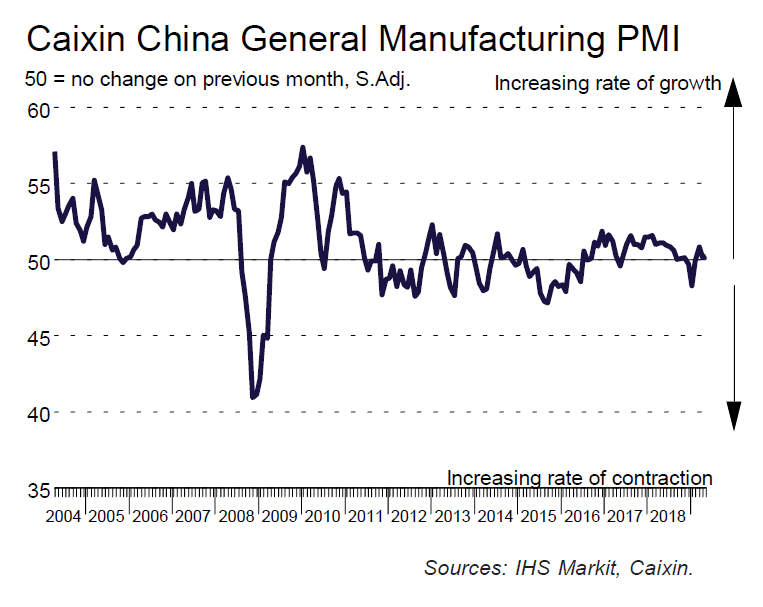
A busy week already kicked off this morning with the important Chinese Caixin PMI manufacturing. It was surprisingly unchanged in May at 50.2, and with two decimals it even increased from 50.16 to 50.24 (see more below). Today we also get PMI manufacturing from the US, UK, Sweden and Norway as well as US ISM manufacturing.
Later this week, we have the Euro area inflation, GDP breakdown and the important ECB meeting (on Thursday). In the US, attention will be drawn to Powell's speech on Wednesday at the 'Fed listens' events and the labour market report on Friday.
On top of the important data and central bank events this week, the markets have to digest the recent escalation from US president Trump against Mexico/China and the general risk-off sentiment.
Selected market news
Financial markets continued in risk-off mode overnight, where Asian equity markets and the US S&P futures declined further. US bond yields also continued lower and markets are now pricing about 50bp of rate cuts from the Fed by the end of the year. We have also changed our forecast and now look for a rate cut in July or September, see FOMC Comment - Dovish policy signal to pave the way for an insurance cut , 31 May 2019.
The US-China trade war continues to escalate as China took the first steps on Friday to retaliate against the US export ban on Huawei. China announced it would create an 'unreliable entities list ' of foreign companies, organisations and individuals that it deems 'unreliable' in terms of harming Chinese companies. During the weekend, FedEx was put under investigation but it was not stated that the move was related to the new list. On Sunday, China issued a White Paper on the trade war blaming the US for the escalation and repeating that China did not want a trade war but was also not afraid of fighting one. The next key event to look out for in the trade war is the meeting between US President Donald Trump and Chinese President Xi Jinping at the G20 meeting in late June.
As if the US-China trade war wasn't enough, Trump is also launching tariffs on Mexico and he also withdrew India's preferential trade status , leading to tariff increases. Trump's tariff actions have raised fears that he may also lift tariffs on European autos later this year.
The small rise in Caixin PMI manufacturing overnight was surprising, as the official PMI manufacturing on Friday dropped sharply from 50.1 to 49.4. The truth may be somewhere in the middle, but metal markets also point to a set-back in activity in May after the sudden escalation of the trade war on 5 May. We expect Chinese activity to be under continued pressure until the trade war is resolved or at least is not escalating further. Our baseline scenario is still that we get a trade deal in H2 when the pain on both sides gets too high. But uncertainty around the timing of a trade deal is clearly elevated.
China Caixin PMI manufacturing unchanged at 50.2, some resilience with weakened confidence
China Caixin manufacturing PMI was unchanged at 50.2 in May, above expectation of 50.0. Production was broadly stable in May. Total new work and export sales both increase slightly. And, there was renewed rise in purchasing activity.
Commenting on the China General Manufacturing PMI™ data, Dr. Zhengsheng Zhong, Director of Macroeconomic Analysis at CEBM Group said:
"The Caixin China General Manufacturing Purchasing Managers' Index was 50.2 in May, unchanged from the previous month, indicating a mild expansion in the manufacturing sector.
1) The subindex for new orders edged higher, and the gauge for new export orders moved back above 50 to the same level as in January, which was the best reading since March 2018. The improvements in both indices signals stable domestic and overseas demand.
2) The output subindex declined for the second straight month, although it remained marginally in expansionary territory. Employment conditions have broadly stabilized, with the employment subindex showing only a marginal drop in staff numbers.
3) The gauge of stocks of purchased items moved back above the 50 mark that divides expansion from contraction and the measure of stocks of finished goods edged up, albeit remaining in contractionary territory, indicating that while inventories remain low, manufacturers' willingness to replenish stocks has strengthened. The subindex measuring supplier performance fell further into contractionary territory, to signal that companies are taking longer to ship orders and also a reflection of relatively low inventory levels.
4) The gauge of input prices showed a marginal increase, while that of output prices edged down to the lowest reading in four months, suggesting that while prices of manufactured goods remained relatively stable, enterprises are facing pressure from rising raw material prices.
5) The subindex measuring sentiment towards future output plunged to its lowest reading since the gauge began in April 2012, a reflection of the trade conflict between China and the U.S. and weakened business confidence.
"Overall, China's economy showed steady growth and resilience in May. The manufacturing sector saw demand rise from both overseas and domestic markets, and prices were stable. However, business confidence weakened, and manufacturers' inventory levels remained low. The trade tensions between the U.S. and China are having an impact on confidence and the best way to respond to this is to boost the confidence of enterprises, residents and capital markets by carrying out favorable reforms and to undertake timely adjustments to regulations and controls."
GBP/USD And EUR/GBP: British Pound Could Recover
GBP/USD started a decent upward move above the 1.2600 resistance. EUR/GBP is currently correcting lower towards the 0.8830 support area.
Important Takeaways for GBP/USD and EUR/GBP
- The British Pound declined recently and tested the 1.2560 support area.
- There was a break above a major bearish trend line with resistance at 1.2610 on the hourly chart of GBP/USD.
- EUR/GBP traded towards the 0.8880 resistance level before starting a downside correction.
- There is a key bullish trend line forming with support near 0.8830 on the hourly chart.
GBP/USD Technical Analysis
The British Pound remained in a strong downtrend and traded below the 1.2650 support area against the US Dollar. The GBP/USD pair broke the key 1.2600 support area to enter a bearish zone.
The pair even broke the 1.2580 support and settled below the 50 hourly simple moving average. It traded as low as 1.2560 before starting an upside correction.
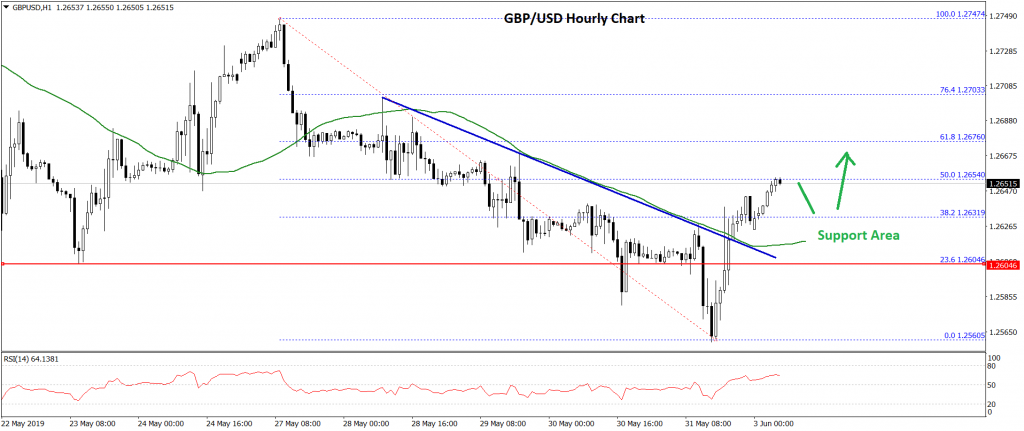
The bulls pushed the price above the 1.2600 resistance and the 50 hourly simple moving average. There was a break above the 23.6% Fib retracement level of the latest drop from the 1.2747 high to 1.2560 low.
Moreover, there was a break above a major bearish trend line with resistance at 1.2610 on the hourly chart of GBP/USD. The pair is currently testing the 50% Fib retracement level of the latest drop from the 1.2747 high to 1.2560 low.
On the upside, an initial resistance is near the 1.2670 level. If there are more gains, the pair could continue higher towards the 1.2700 level.
Conversely, if there is a downside correction, the pair could decline towards the 1.2630 support area. If the pair fails to stay above the 1.2620 support, there is a risk of a downside break in the near term.
The next key support is near the 1.2600 level, below which GBP/USD could revisit the 1.2560 support area. Overall, the pair remains supported on dips and it could move towards 1.2700.
EUR/GBP Technical Analysis
The Euro started a strong upward move from the 0.8800 support area against the British Pound. The EUR/GBP pair traded above the 0.8840 resistance level to move into a positive zone.
The upward move was strong since the pair traded above the 0.8850 and 0.8860 levels. There was also a close above the 50 hourly simple moving average. The pair traded close to the 0.8880 level before starting a downside correction.
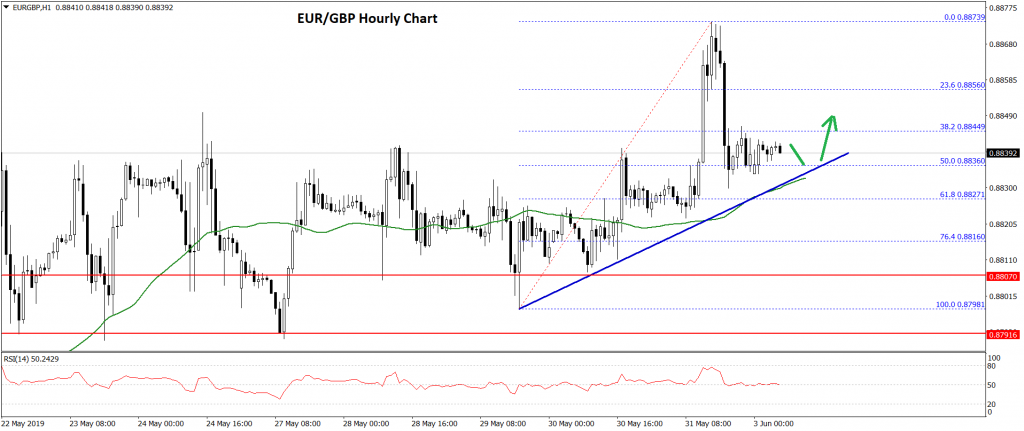
It broke the 23.6% fib retracement level of the recent wave from the 0.8798 low to 0.8873 high. On the downside, there are many supports near the 0.8830 level and the 50 hourly SMA.
There is a key bullish trend line forming with support near 0.8830 on the hourly chart. The 50% fib retracement level of the recent wave from the 0.8798 low to 0.8873 high is also near the 0.8835 level.
Therefore, the pair is likely to find a strong buying interest near the 0.8830 level. If there is a downside break below 0.8830, the pair could move back in a negative zone.
On the upside, an initial resistance is near the 0.8850 level. If there is an upside break above 0.8850 level, the pair could start a fresh increase towards the 0.8880 level.
Japan PMI manufacturing finalized at 49.8, potential banana skins lie ahead
Japan PMI manufacturing was finalized at 49.8 in May, revised up from 49.6, down from 50.2 in April. Markit noted that domestic and external demand conditions deteriorate. Firms slow the rate of hiring amid production cutbacks. And, output expectations turn negative for first time since November 2012.
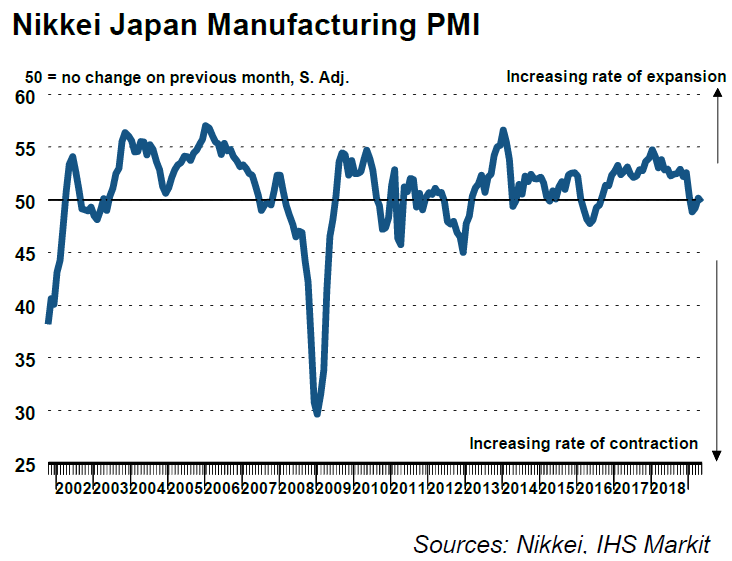
Joe Hayes, Economist at IHS Markit: "There were no signs a let-up in the recent manufacturing downturn during May, as output and new orders both slipped for fifth successive months. Weak demand from Japan's key trade partner, China, as well as signs of an increasingly sluggish domestic economy, have impacted sales volumes.... Given the importance of capital goods to Japan's foreign trade, it would suggest further difficulties lie ahead for Japanese exporters.
"With the upcoming sales tax hike and upper house elections in July, there lies ahead potential banana skins for Japanese firms to avoid. Re-escalated trade tensions between China and the US merely add to existing concerns for manufacturers. Subsequently, businesses cast a downbeat assessment for the year ahead for the first time in six-and-a-half years."
Also from Japan, capital spending rose 6.1% in Q1, beat expectation of 2.6%.
Australia AiG PMI dropped to -2.1, wage index at lowest since Mar 2017
Australia AiG Performance of Manufacturing Index dropped -2.1 pts to 52.7 in May, suggesting a slower rate of growth. Looking at the details, production dropped sharply by -6.9 to 51.2. New orders dropped -3.3 to 52.3. exports dropped -3.6 to just 40.3. Employment index staged a strong rebound and rose 4.1 to 55.6. But average wages dropped -2.2 to 55.5. Input prices rose 3.6 to 68.3 but selling prices dropped -2.8 to 52.1.
In particular, on wages, 55.5 is the lowest monthly results since March 2017 and is well below historical average of 59.2. This index has been trending lower since its recent peak in September 2018. It indicates that fewer manufacturing businesses are now implementing wage rises, compared to the recent peak in Q3 of 2018.
Also from Australia, TD Securities inflation rose 0.0% mom in May. Company operating profit rose 1.7% qoq in Q1.