

Sample Category Title
Switzerland’s KOF Economic Barometer Declined In May
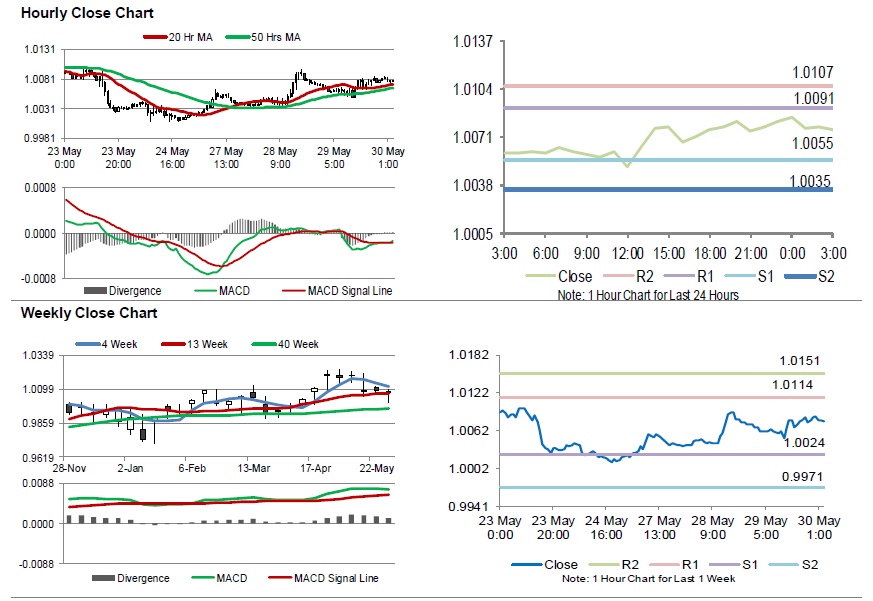
For the 24 hours to 23:00 GMT, the USD rose 0.10% against the CHF and closed at 1.0082.
Data showed that Switzerland's KOF economic barometer dropped to a level of 94.4 in May, more than market consensus for a fall to a level of 96.0. The KOF economic barometer had recorded a level of 96.2 in the prior month.
In the Asian session, at GMT0300, the pair is trading at 1.0076, with the USD trading 0.06% lower against the CHF from yesterday's close.
The pair is expected to find support at 1.0055, and a fall through could take it to the next support level of 1.0035. The pair is expected to find its first resistance at 1.0091, and a rise through could take it to the next resistance level of 1.0107.
With no macroeconomic releases in Switzerland today, investors would look forward to global macroeconomic releases for further direction.
The currency pair is trading above its 20 Hr and 50 Hr moving averages.
BoC Opted To Leave Its Interest Rate Steady At 1.75%
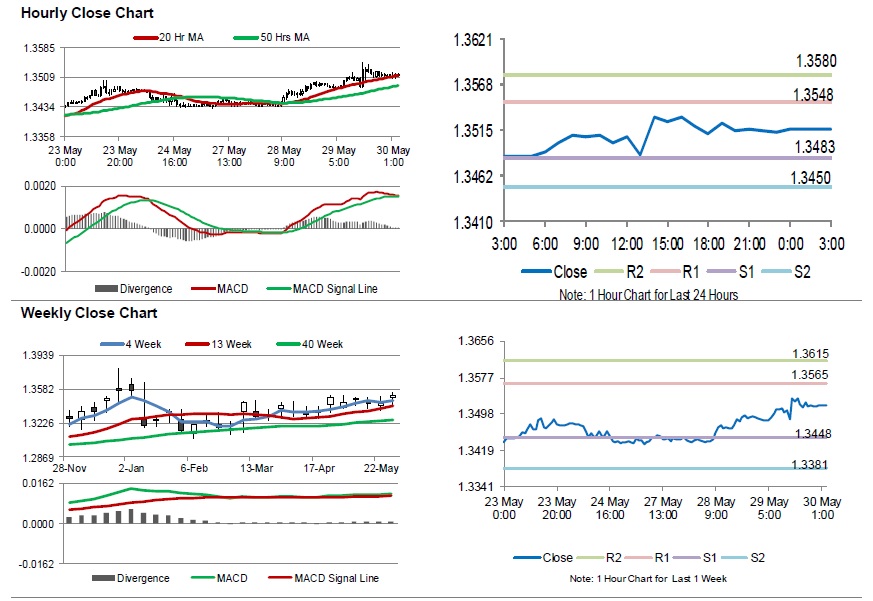
For the 24 hours to 23:00 GMT, the USD rose 0.16% against the CAD and closed at 1.3514.
The Canadian dollar fell against the US dollar, following the Bank of Canada’s (BoC) rate decision. The BoC, in its May monetary policy meeting, kept its key interest rate unchanged at 1.75%, as widely expected and citing that economic slowdown was temporary. The central bank stated that inflation was expected to remain around the bank’s 2% target in coming months and projected that economic momentum would stimulate in second quarter 2019.
In the Asian session, at GMT0300, the pair is trading at 1.3516, with the USD trading marginally higher against the CAD from yesterday’s close.
The pair is expected to find support at 1.3483, and a fall through could take it to the next support level of 1.3450. The pair is expected to find its first resistance at 1.3548, and a rise through could take it to the next resistance level of 1.3580.
Looking ahead, traders would await Canada’s CFIB business barometer for May and current account balance for 1Q, set to release in later in the day.
The currency pair is showing convergence with its 20 Hr moving average and trading above its 50 Hr moving average.
Australia’s Building Approvals Tumbled Beyond Estimates In April
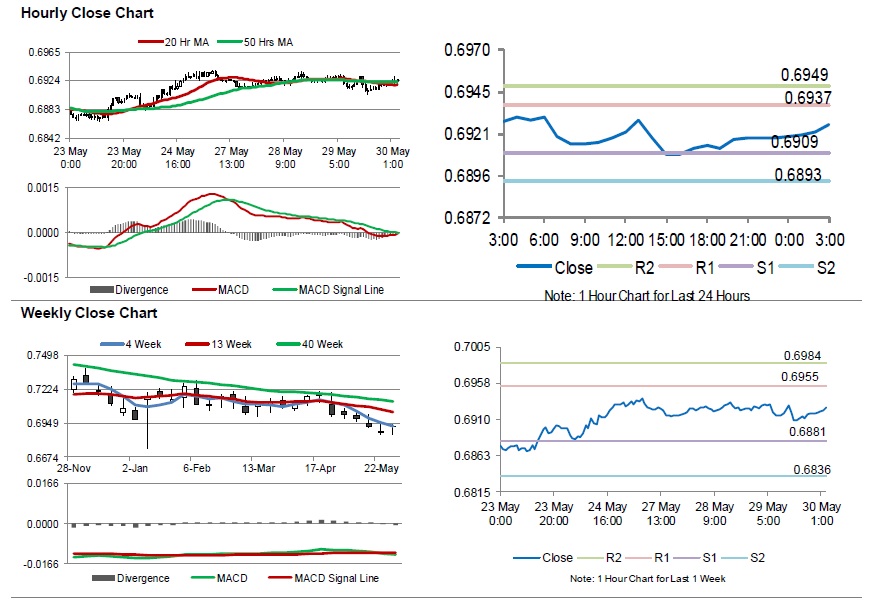
For the 24 hours to 23:00 GMT, the AUD declined 0.06% against the USD and closed at 0.6918.
LME Copper prices declined 1.5% or $92.0/MT to $5864.5/MT. Aluminium prices declined 0.2% or $3.0/MT to $1770.0/MT.
In the Asian session, at GMT0300, the pair is trading at 0.6926, with the AUD trading 0.12% higher against the USD from yesterday’s close.
Overnight data revealed that Australia’s seasonally adjusted building approvals plunged 24.2% on an annual basis in April, surpassing market expectations for a drop of 22.4%. In the previous month, building approvals had recorded a revised fall of 25.4%.
The pair is expected to find support at 0.6909, and a fall through could take it to the next support level of 0.6893. The pair is expected to find its first resistance at 0.6937, and a rise through could take it to the next resistance level of 0.6949.
Moving ahead, investors would keep an eye on Australia’s private sector credit demand for April, scheduled to release overnight.
The currency pair is showing convergence with its 20 Hr and 50 Hr moving averages.
Gold: Yellow Metal Reverses Its Gains In The Asian Session
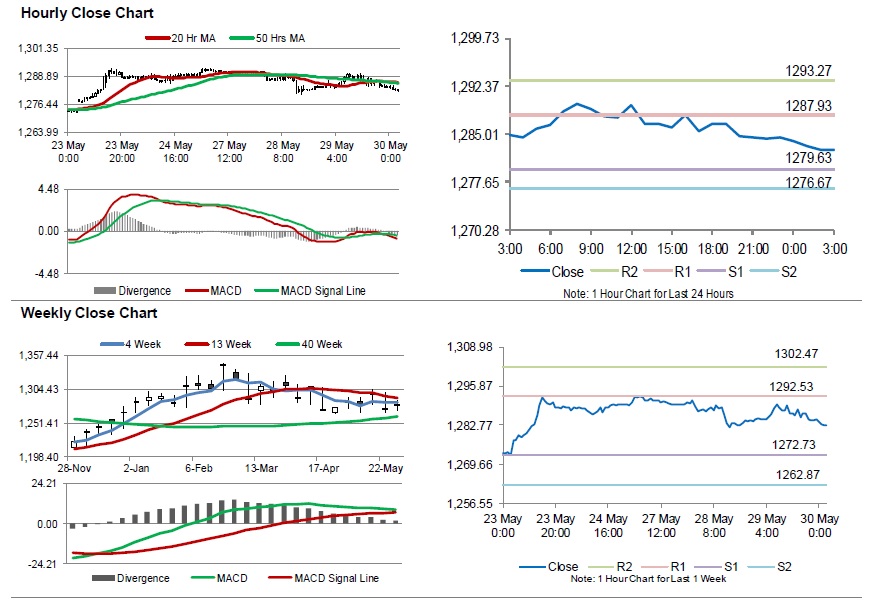
For the 24 hours to 23:00 GMT, Gold slightly rose against the USD and closed at USD1284.30 per ounce, amid weakness in the US equities.
In the Asian session, at GMT0300, the pair is trading at 1282.60, with gold trading 0.13% lower against the USD from yesterday’s close.
The pair is expected to find support at 1279.63, and a fall through could take it to the next support level of 1276.67. The pair is expected to find its first resistance at 1287.93, and a rise through could take it to the next resistance level of 1293.27.
The yellow metal is trading below 20 Hr and 50 Hr moving averages.
Silver: White Metal Trading On A Weaker Footing This Morning
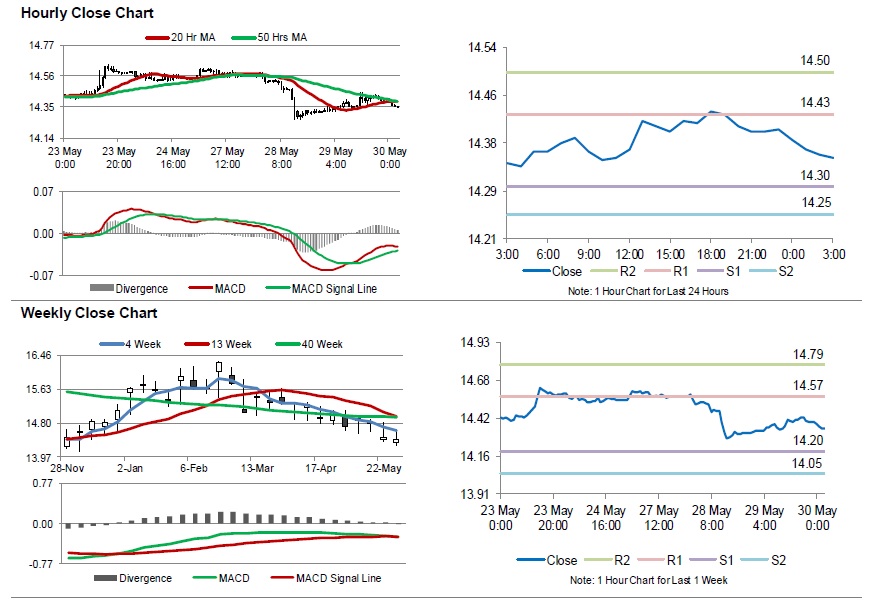
For the 24 hours to 23:00 GMT, Silver rose 0.56% against the USD and closed at USD14.40 per ounce, tracking gains in gold prices.
In the Asian session, at GMT0300, the pair is trading at 14.35, with silver trading 0.35% lower against the USD from yesterday’s close.
The pair is expected to find support at 14.30, and a fall through could take it to the next support level of 14.25. The pair is expected to find its first resistance at 14.43, and a rise through could take it to the next resistance level of 14.50.
The white metal is trading below its 20 Hr and 50 Hr moving averages.
Crude Oil: Oil Trading Lower, Ahead Of EIA’s Weekly Crude Oil Stockpiles Data
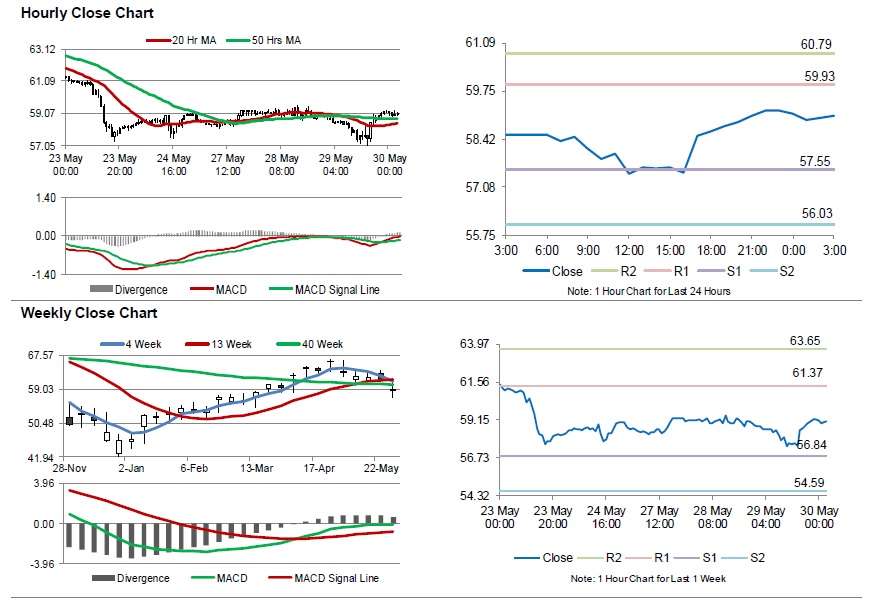
For the 24 hours to 23:00 GMT, Crude Oil rose 0.51% against the USD and closed at USD59.20 per barrel, after the American Petroleum Institute (API) reported that US crude oil inventories declined by 5.3 million barrels to 474.4 million barrels in the week ended 24 May 2019.
In the Asian session, at GMT0300, the pair is trading at 59.08, with oil trading 0.20% lower against the USD from yesterday's close.
The pair is expected to find support at 57.55, and a fall through could take it to the next support level of 56.03. The pair is expected to find its first resistance at 59.93, and a rise through could take it to the next resistance level of 60.79.
Crude oil is trading above its 20 Hr and 50 Hr moving averages.
Elliott Wave View: Further Downside In Dow Jones Futures
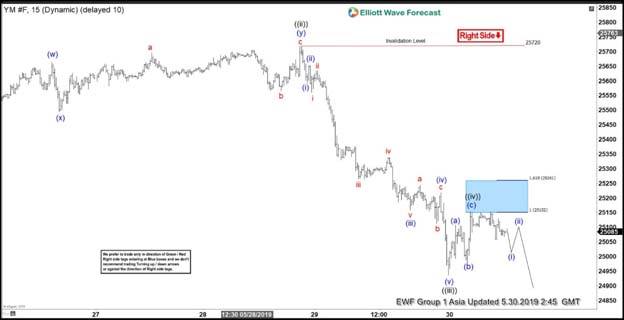
Elliott Wave view on Dow Jones Future (YM_F) suggests that the sequence from April 24, 2019 high (26694) remains incomplete and Index can see further downside. Short term, the rally to 25720 ended wave ((ii)) and wave ((iii)) ended at 24937. Internal of wave ((iii)) unfolded as Elliott Wave impulse structure. Down from 25720, wave (i) ended at 25592, wave (ii) ended at 2554, wave (iii) ended at 25159, wave (iv) ended at 25219, and wave (v) ended at 24937.
Index has resumed lower and broken the previous low on May 14 (25215), suggesting the next leg lower has started. Wave ((iv)) bounce appears complete at 25154 at the blue box area after a 3 waves bounce. Index still needs to break below wave ((iii)) at 24937 at this stage to avoid a double correction in wave ((iv)). We don’t like buying the index, and short term, while rally fails below 25720, expect Index to extend lower. If Index breaks above 25154 instead, then wave ((iv)) still remains in progress as a double zigzag Elliott Wave structure. In this alternate scenario, Index should still resume lower as far as the rally fails below 25720.
Dow Jones Future (YM_F) 1 Hour Elliott Wave Chart
Australian Capex: 2019/20, an Uncertain Investment Outlook
Q1 real capex: -1.7%, equipment -0.5% 2018/19 plans: Est 6 $122bn 2019/20 plans: Est 2 $99bn
- In Q1, capex spending disappointed, declining by 1.7%.
- Falls were evident across assets: building & structures, -2.8% and equipment, -0.5%. By industry, falls were broadly based: mining, -1.3%; services, -1.2%; and manufacturing, -7.4%.
- Estimate 6 of capex plans for 2018/19 is $122bn, which is 3.8% above Est 6 a year ago. This is broadly consistent with Est 5 of 3 months earlier.
- For the 2018/19 year, Est 6 implies capex spend will be 4% above that in 2017/18 ~ we calculate, based on average realisation ratios (RRs).
- Turning to 2019/20, Estimate 2 of capex plans is $99bn, which is 12.8% above Est 2 a year ago.
- This is a modest upgrade on Est 1 of 3 month ago (Est 1 on Est 1 was +11%). The main upgrade is a slightly less negative view on equipment – but it is still weak (in our view).
- We assess that the Est 2 on Est 2 figure of +12.8% is flattered by weak base effects. The Est 2 of a year ago was relatively weak compared with the likely outcome for the 2018/19 year.
- For the 2019/20 year, Est 2 implies capex spend will be 1.3% above that in 2018/19 ~ we calculate, based on average realisation ratios (RRs). This figuring suggests that the nearterm investment outlook is relatively subdued with a flat profile for the service sectors.
- By way of context, in the Federal Budget of April 2, the government forecast that business investment will rise by 5% in 2019/20.
- Est 2 for 2019/20 implies by industry, based on avg RRs: mining +6%; services +0.5%; manufacturing, -7%. By asset, based on avg RRs, Eest 2 implies: building & structures, +4%; and weakness in equipment, at -5%.
- We note that these calculations are sensitive to the choice of average realisation ratio. With that in mind, it may be better to describe the investment outlook as uncertain.
- For 2019/20, the capex survey suggests that: investment in the mining sector is set to turn the corner, advancing after a number of years of decline; and for the service sectors, investment in building & structures is likely to rise but spending on equipment is likely to fall.
- The timing of this survey, conducted in April and May, in the countdown to the May 18 Federal Election, was a period of heightened uncertainty. The next update may provide a clearer guide to the investment outlook.
Mining investment fell further early in 2019, with the wind-down of the investment boom now largely complete. Mining investment in the quarter is now 70% below the peak of mid-2012.
Investment by the service sectors expanded by 4.3% over the past year, despite a 1.2% dip in the March quarter. The uptrend is evident across both building & structures and equipment.
Looking to 2019/20, the investment outlook remains uncertain. We will be interested to see how investment plans are updated now that the Federal election is behind us. Uncertainty ahead of the election may have seen some firms reluctant to commit to new spending.
Estimate 2 of plans for the year is $99bn. This headline figure appears to be positive, being some 12.8% above Est 2 of a year ago.
However, we assess that this result is flattered by weak base effects. We estimate that Est 2 implies that capex spending in 2019/20 will be only 1.3% above the likely outcome for 2018/19. The weak spot is plans by the service sectors for equipment spending, which we calculate to be -5%. That contrasts with a near 3% rise for building & structures investment by the service sectors.
We see three key near-term trends in business investment.
Mining investment has likely turned the corner and will advance modestly in 2019/20, following many years of decline (post the earlier boom). Miners (notably for iron ore) are responding to higher commodity prices.
Non-mining investment in infrastructure is trending higher, with a focus on transport projects (a spill-over from the upswing in public investment) and a focus on renewable energy. This is largely locked-in. A key dynamic is the population boom of recent years. Both governments and businesses need to lift investment to meet the needs of this fast growing population.
Non-mining investment in equipment is likely to be relatively soft near-term given the weakening of consumer spending. By contrast, those commentators with a more upbeat take on the outlook would likely be looking for a lift in such spending.
Australia building approvals dropped -4.7% mom, capital expenditure dropped -1.7%
Australia dwelling approvals contracted by -4.7% mom in seasonally adjusted terms in April. That's well below expectation of 0.0% mom. Regionally, the decline was driven by falls in Tasmania (19.1%), Victoria (16.1%), Western Australia (6.7%) and South Australia (3.3%). Private dwellings excluding houses fell 6.5% while private house approvals decreased 2.6%.
Seasonally adjusted new capital expenditure dropped -1.7% in Q1, also way below expectation of 0.5% qoq. Buildings and structures fell -2.8% while equipment, plant and machinery fell -0.5%
China: US Provoking trade dispute is naked economic terrorism, economic homicide, economic bullying
Rhetorics from Chinese officials regarding trade war with US continued to be hard-line. The ruling Communist Party is clearly preparing their citizens for the "new long march" in prolonged trade war.
Chinese Vice Foreign Minister Zhang Hanhui said today "we oppose a trade war but are not afraid of a trade war." He went further to accuse the US that "this kind of deliberately provoking trade disputes is naked economic terrorism, economic homicide, economic bullying."
He added: "This trade clash will have a serious negative effect on global economic development and recovery... We will definitely properly deal with all external challenges, do our own thing well, develop our economy... At the same time, we have the confidence, resolve and ability to safeguard our country's sovereignty, security, respect and security and development interests."
Yesterday, stock markets were rocked by news that China is going to weaponize its rare earths in the trade war. The state-run China Daily newspaper said today "it would be naive to think that China does not have other countermeasures apart from rare earths to hand". "As Chinese officials have reiterated, they have a 'tool box' large enough to fix any problem that may arise as trade tensions escalate, and they are ready to fight back 'at any cost'."