Sample Category Title
BoJ Sakurai: Shouldn’t recklessly seek to hit price target with additional easing
BoJ board member Makoto Sakurai said the central bank "shouldn't recklessly seek to achieve our price target with additional easing". Instead, the best monetary policy approach was to "patiently maintain" the current stimulus program. He acknowledged that "achievement of our price target is being delayed". But that's because "the relationship between monetary policy and price moves are changing and becoming more complex."
Sakurai also said BoJ should be very mindful of the negative effects of the ultra-loose monetary policy. He added, "while financial institutions' capital-to-asset ratios are sufficient from a regulatory standpoint, what's important to note is that they are declining as a trend." Hence, "the BoJ must make appropriate policy decisions by scrutinizing the merits and demerits, including the risk our policy is building up financial imbalances."
Market Morning Briefing: Dollar Index Has Risen Above 98
STOCKS
Risk aversion is increasing in the market on fears of the global economy slowing down and a possible recession. As a result the equities are witnessing a strong money outflow which are in turn flowing into the bond market. Dow and DAX has declined below their key supports and can fall further. The weakness in global equities could delay the expected rally in India's Sensex and Nifty. They can see an intermediate dip before a fresh rally.
Dow (25126.41, -221.36, -0.87%) has declined below 25250 thereby confirming a near-term top. The bearish outlook is intact to 24792 (38% Fibonacci retracement support) immediately. An interim bounce from there to 25250 cannot be ruled out before the index moves further lower to our preferred targets of 24500 and 24000.
As expected, DAX (11,837.81, -189.24, -1.57%) has declined below 12000 and keeps our bearish view intact for a test of 11800 and 11600.
Nikkei (20835.25, -168.12, -0.80%) has declined below 20900 as expected. The bearish view is intact to test 20500 on the downside. The region between 20900 and 21000 will now act as a good resistance.
Shanghai (2888.08, -26.62, -0.91%) has come-off from its high of 2935. While below 2900, a test of 2850-2835 (the lower end of the 2835-2950 sideways range) is possible.
Nifty (11861.10, -67.65, -0.57%) has declined below 11900 and can test 11800 or even 11700. This in turn would delay our expected rally to 12150 and higher levels.
Similarly, Sensex (39502.05, -247.68, -0.62%) can test 39000 before we see a fresh rally to 40200.
COMMODITIES
Commodities broadly remain weak. Gold is not gaining safe haven amid a sharp sell-off in equities. Gold and Silver can fall in the near term. Copper keeps our bearish view intact has resumed its downtrend. Oil has bounced. But the key resistance region in both Brent and WTI are likely to cap the upside and drag the prices lower. The US Crude inventory data due for release today will need a watch to see if the resistances can hold in line with our expectation or not.
Gold (1278.10) remains subdued and is vulnerable to test 1270. As mentioned yesterday, a head and shoulder pattern (continuation pattern in this case) is getting formed with the neckline support around 1270. A break/decisive close below 1270 can drag gold below 1265 targeting 1250-1240.
Silver (14.38) continues to trade below the resistance at 14.50. The outlook remains bearish for it to test 14.25 and 14.
As expected the resistance at 2.72 has held well and Copper (2.66) has resumed its downtrend. A break below 2.65 will accelerate the fall to our preferred targets of 2.62 and 2.60.
Brent (69.65) dipped to 68 as expected yesterday and has bounced from there. We expect the 70-71 resistance region to cap the upside and keep the bearish view intact for a fall to 66 and 64. A sideways consolidation between 68 and 71 cannot be ruled out in the near term before we see an eventual fall.
WTI (59.10) has bounced sharply from its low of 56.89. A test of the 60-61 resistance region looks likely before we see the overall downtrend resuming towards 56-54.
FOREX
US Dollar trades strong and could pull up Dollar Yen with itself. Euro is headed towards support at 1.11. Aussie and Pound could face near term supports but look weak. Dollar Rupee could trade below 70.
Dollar Index (98.14) has risen above 98 and is likely to head towards 98.50, the immediate daily resistance. A possible rejection from 98.50-99.00 region looks likely within the next 2-3 sessions.
Euro (1.1135) is also headed towards 1.11 in the near term while immediate resistance near 1.1215 is holding. Near term is bearish towards 1.11 before a corrective bounce from there is seen.
Euro-Yen (121.98) has broken below 122 but could get support at 121.50 from where a bounce to 122.50 is possible in the near term. Thereafter, we could see another leg of dip towards 121.50-121.20 before the pair resolves on either side of the 121.20-122.50 region.
Dollar Yen (109.54) is up a bit but has been overall stable above 109. While the dollar Index moves up, Dollar Yen could see a small upmove in the next 2-3 sessions followed by a fall in the medium term. Next week could see a test of 109 (max extension to 108.50) on the downside.
Aussie (0.6923) is stable without any major movement in the last 2-3 sessions. Trade within 0.6950-0.6960 looks possible in the near term before breaking out on either side.
Pound (1.2626) has support coming up at 1.26 on the daily and 3-day candles and a bounce from 1.26 looks likely in the near term. However, on the downside there is room for a test of 1.25/24 which would come into the picture on a break below 1.26. Watch price action near 1.26 from where a short bounce is expected.
USDCNY (6.9125) needs to come down from current levels towards 6.87 or lower. While the pair trades below resistance at 6.92, it could be ranged for the week before falling.
USDINR (69.83) tested 70 yesterday breaking above our expected upper range of 69.75/80. Note that 70 is an important resistance on the near term and while that holds, we could see trade within 69.50-70.00 in the near term.
INTEREST RATES
The US 30YR (2.69%) is trading below our expected support at 2.70% while the 10YR (2.27%) and 5Yr (2.08%) has bounced from above support levels of 2.20% and 2% respectively. A short corrective bounce is likely for the near term taking the yields up by 2-3bps. The 3-mnth traded near 2.36% and the yield curve is indicative of a warning on the economic growth sentiments for the US increasing fears of recession. The market is now pricing in 3-rate cuts by the end of next year.
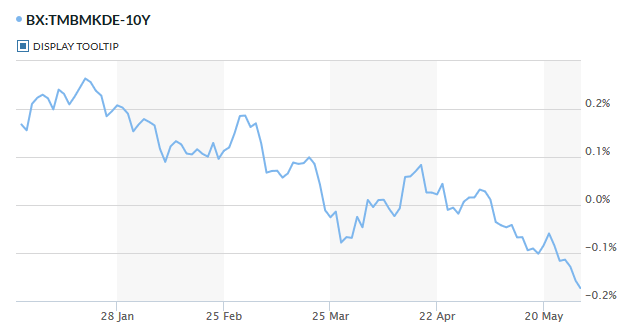
The German 10yr (-0.176%) is falling as expected and could test -0.2% before bouncing back from there. Near term looks weak.
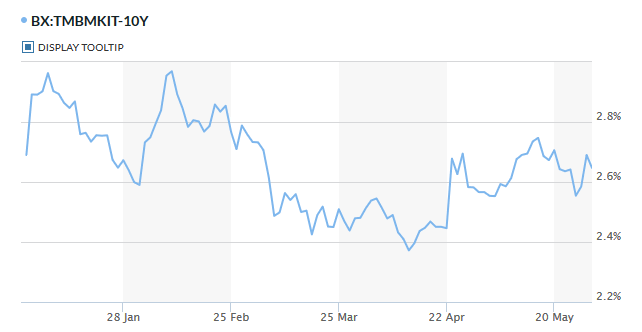
The US-Japan 10YR (2.35%) has bounced from trend support and could move up towards 2.4% in the near term. There is enough room on the upside for the coming week.
The 10Yr GOI (7.2617%) is stable but needs to bounce back above 7.30% to avoid further fall towards 7.20%. While the yield trades lower, it could be supportive of Rupee strength in the near term.
Market Not Convinced by BOC’s Intentionally Neutral Tone
Despite BOC’s effort to temper the need of a rate cut, the market is obviously unconvinced. Market participants continue to price in about 30% chance of rate cut later this year and USDCAD surged to the highest level since January. The key message from the meeting is that the slowdown in the beginning of the year was driven by temporary factors and members saw improvements in the economy since the previous meeting. Yet, while staying positive about domestic outlook, risks in the external environment heightened. Current momentary stance is appropriate against this backdrop while the policy decisions in the future are data-dependent. BOC in May left the policy rate unchanged at 1.75%.
The central bank remained confident about the domestic economic outlook. As noting the policy statement, the members suggested that “recent Canadian economic data are in line with the projections” in April with “accumulating evidence that the slowdown in late 2018 and early 2019 is being followed by a pickup starting in the second quarter”. They expect to “a pickup in both consumers spending and exports” in 2Q19 and acknowledged that “overall growth in business investment has firmed”. On a no-so-positive note, “inventories rose sharply in the first quarter, which may dampen production growth in coming months”. There was little reference to inflation, which BOC judged as “evolved in line with the Bank’s April projection”. It continued to expect inflation to “remain around the 2% target in the coming months” while “core inflation measures all remain close to 2%”.
Globally, the key uncertainty comes from US-China trade war. BOC suggested that “trade restrictions introduced by China are having direct effects on Canadian exports”. On a positive noted, “the removal of steel and aluminum tariffs and increasing prospects for the ratification of CUSMA” would be helpful for exports and investment in Canada.
The forward guidance came in largely in line with our expectations. While refraining from the comment that interest rate would need to increase, BOC also attempted to temper market speculations that a rate cut would be needed. BOC concluded that recent slowdown in the economy was driven by "temporary" factor, while "global trade risks" have undeniably increased". Policymakers judged the "degree of accommodation being provided by the current policy interest rate remains appropriate", while they pledged to monitor incoming data on future adjustment of the monetary policy.
Equities Lose Their Bonding
Equities lose their bonding
The cracks in global equity markets threatened to grow wider still as relentless haven-buying of sovereign bonds overnight pushed key yields even lower and sent recession fears through stocks. Global stock markets were lower with the bellwether S&P 500 breaking 2800 and its 200-day moving average at 2773 in imminent danger. A weekly close below this level would be a strong technical signal of darker days ahead. The moving average itself is not a line in the sand, rather it tends to act as a pivot point, limiting corrective gains and sell-offs depending on which side of the line the index is lurking.
The bond market itself, of course, has been telling us all year that a global slowdown was on the way as yields continue to fall across the sovereign developed market bonds. This was reinforced in Q1 by a stampede of central banks moving to a neutral or outright easing bias led by the Federal Reserve. The US-China trade frictions had the potential to deepen the gloom substantially but were only priced as a preliminary skirmish by financial markets until very recently. With the skirmish on the cusp of escalating into a more extensive drawn-out attritional campaign, the fall in bond yields has accelerated, forcing global growth bastions of optimism such as stocks and oil to rethink their strategies.
Asia is unlikely to feel much relief today either with both the Nikkei 225 and the ASX 200 down over 0.50% in early trading. Australian Building Permits were released at 0930 Singapore time (SGT) with the street looking for a rebound of last month’s disastrous Building Permits data to between 0-3%. With Australian Commonwealth Bonds yielding record lows already, a poor reading could heap more pressure on the currency and increase RBA easing calls to screams at their meeting next month.
The US GDP and Initial Claims this evening will give us an insight into whether the US economies big block V-8 engine is still running smoothly. The street has priced in GDP growth at 3.10% annualised and 215,000 new jobless claims. With sentiment quite fragile at the moment, a lower GDP or higher jobless claims could spark another rush to the exit door for equities and oil. A better print is likely to consolidate rather than turn the tide of the recent sell-off.
Currencies
The US dollar continues its march higher against most of its trading partners, buoyed by investor flows into the bond market. This sentiment has even overwhelmed buying of Japanese yen (JPY) with USD/JPY approaching resistance at 109.70. Regional currencies will be vulnerable to the same fate today, as emerging markets bear the brunt of the flight to safety.
Equities
With both Sydney and Tokyo markets already well in the red this morning, the scene is set for another potentially tough day for Asian equities. The S&P 500 fell 0.70%, the Nasdaq fell 0.80%, and the Dow Jones fell 0.90% overnight following a troubled European and Asian session. It is hard to see anything other than a positive US-China trade headline turning regional stock markets from their southerly course today.
Oil
Brent Crude fell 1% to USD69.40 a barrel and WTI dropped 0.40% to USD57.00 a barrel overnight as global economic sentiment soured. Having been one of the primary beneficiaries of the global optimism surrounding a US-China trade agreement, oil is, of course, one of the most vulnerable markets to any potential agreement running aground and spilling its contents. Geopolitics, unfortunately, does not come with double hulls.
Brent crude has traced out a series of lower highs throughout May with each rally fading sooner than the previous one and resistance around USD72.00 a barrel holding just recently. WTI broke its 200-day moving average at USD60.00 a barrel last week, and subsequent rallies have all faded at the USD59.00 region, meaning the technical picture for both oily cousins remains dim.
Gold
Gold rallied above USD1,285.00 an ounce initially overnight as the equity sell-off gathered pace. The rally faded as soon as it began though and gold fell to finish almost unchanged at USD1,280.00 an ounce. It appears clear that sustained haven flows from investors in 2019 are heading towards sovereign bond markets and not the yellow metal.
Although it holds its own in the face of a stronger dollar overnight, gold’s inability to rally or find sustained buying interest as the economic and geopolitical pictures darken is troubling. For now, gold remains marooned in a USD1,270.00-1,290.00 range with long-term support at USD1,265.00 an ounce.
Australian Dwelling Approvals: Weakness Continues
April –4.7%mth, –24.2%yr (vs mkt flat). Non high rise driving latest declines; holiday timing a compounding factor?
Dwelling approvals fell 4.7% in April, a significantly weaker than expected result – consensus was looking for a flat month, Westpac a small 1% decline. Note that revisions softened the choppy Jan-March profile with last month's 15.5% drop pared back to a 13.4% decline.
The timing of holidays this year may have exacerbated the decline - with Easter falling into April and a weak prior to the ANZAC day long weekend many workers may have opted to take leave through this period, reducing the number of 'effective working days' in the month. While the ABS tries its best to control for seasonal anomalies, the rarity of this conjunction makes the task difficult.
Notably, the detail shows weakness outside 'high rise' segments. Detached house approvals fell 2.6%mth to be down over 20%yr, the pace of declines accelerating slightly in early 2019. Private units recorded a large 6.5% fall but the detail here points to 'low rise' was the driver this month rather than 'high rise'. Total approvals ex high rise (covering both detached houses and mid-low rise) looks to be down 3.5% in the month.
The state detail shows gains in Qld (+11%mth) and NSW (+4.8%) were more than offset by sharp falls in Vic (–16.1%mth) and WA (–6.7%mth). Excluding high rise approvals, the picture is of more uniform weakness with 8-10%mth declines in NSW, Vic, WA and SA, Qld holding up a bit better with just a 1% fall.
The total value of renovation approvals fell 5.4%mth but is still up slightly by 2.3%yr on a rolling 3mth average basis with trend approvals about flat.
The total value of non res building approvals rose 16.1%mth but is still down 2.1%yr on a rolling 3mth basis.
Overall the update again points to weakening momentum, the composition pointing to a weaker construction profile through the middle of the year. The main caveat is around the timing of public holidays which may mean April figures are overstating weakness. Certainly the weakness in non-high rise approvals runs counter to what has been a firmer tone from construction-related finance approvals in recent months, usually a reasonably good guide to this segment.
Of course, the April data predates several positive developments for housing – a clearer signal that the RBA is prepared to lower interest rates; the Federal election result, which has removed the threat of tax policy changes around negative gearing and capital gains tax; the announcement of additional Federal support for first home buyers and indications that APRA is seeking to relax some loan serviceability assessment guidelines. More timely market measures suggest the combined effect has given some lift to activity – auction clearance rates lifting notably in Sydney and Melbourne over the first weekend after the election (albeit not quite as strongly as preliminary estimates had suggested).
Crude Oil Price Likely To Extend Losses Below $57.00
Key Highlights
- Crude oil price declined heavily and broke the key $60.50 support area against the US dollar.
- There was a break below a major ascending channel with support at $61.40 on the 4-hours chart of XTI/USD.
- The Richmond Fed Manufacturing Index in May 2019 increased from 3 to 5.
- The US GDP in Q1 2019 (Preliminary) could grow 3.1%, less than the last 3.2%.
Crude Oil Price Technical Analysis
After multiple rejections near the $64.00 level, crude oil price started a strong downward move against the US Dollar. The price broke the key $61.20 and $60.50 support levels to enter a bearish zone.
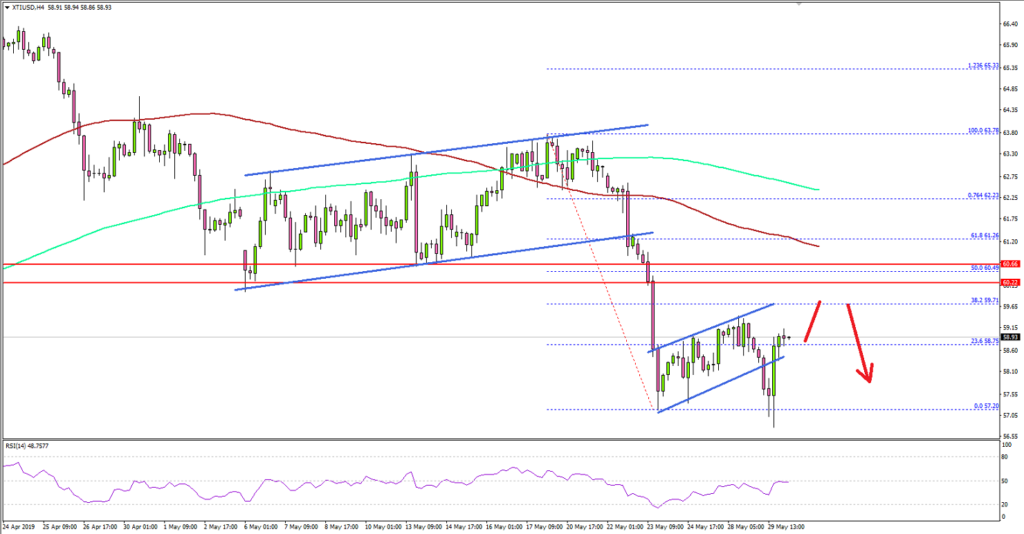
Looking at the 4-hours chart of XTI/USD, the price settled below the $60.00 pivot level, the 100 (red) simple moving average (4-hours), and the 200 (green) simple moving average (4-hours).
The price traded as low as $57.20 before starting an upside correction. There was a recovery above the $58.80 level and the 23.6% Fib retracement level of the decline from the $63.78 high to $57.20 low.
However, the price failed to gain pace above the $59.50 level and recently broke an ascending channel. The current technical structure seems bearish and there are chances of more losses below the $57.00 and $56.00 support levels.
The next main support level is near the $55.00 level. On the upside, an initial resistance is at $59.20, above which the price could recover towards the $60.00 resistance level.
Fundamentally, the Richmond Fed Manufacturing Index for May 2019 was released by Federal Reserve Bank of Richmond. The market was looking for an increase from 3 to 6.
The actual result was lower than the forecast, as the Richmond Fed Manufacturing Index increased to 3 to 5. Shipments and new orders were mostly flat, and employment remained positive.
The report added:
Firms continued to struggle to find workers with the necessary skills as this index dropped from −8 in April to −20 in May.
Looking at major pairs, EUR/USD and GBP/USD declined heavily below key supports and they might continue to slide in the near term.
Economic Releases to Watch Today
- US Initial Jobless Claims – Forecast 215K, versus 211K previous.
- US Gross Domestic Product Q1 2019 (Preliminary) – Forecast 3.1% versus previous 3.2%.
Daily Markets Broadcast
Wall Street slides on persistent growth fears
US indices fell for a second day yesterday as the flight from equities in to safe-haven bonds continued. The moves pushed 10-year US benchmark yields below 2.25% for the first time since September 2017.
US30USD Daily Chart
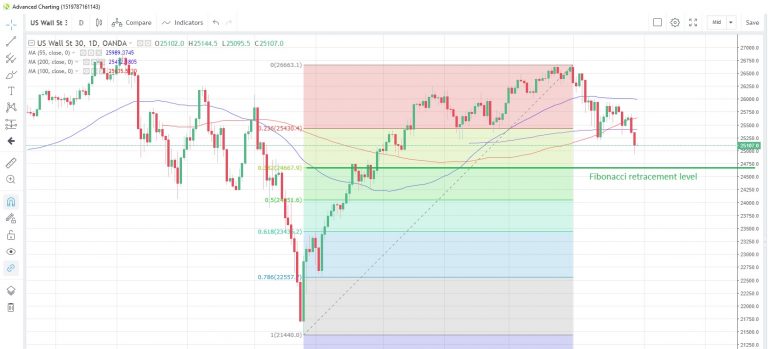
The US30 index touched the lowest since February 8 yesterday, falling for a second straight day, but closed off the intraday lows
The index is falling toward the 38.2% Fibonacci retracement of the December to May rally at 24,668
Annual growth in the US economy is expected to slow to +3.1% in Q1, according to the latest survey of economists. That compares with 3.2% growth in Q4.
DE30EUR Daily Chart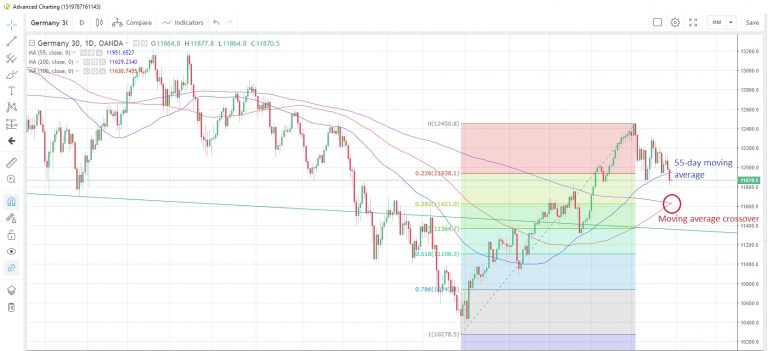
The Germany30 index fell for a second consecutive day yesterday, touching the lowest since April 3 at one point
The index closed below the 55-day moving average at 11,946 for the first time since February 8. The 100-day moving average at 11,630 is above the 200-day moving average at 11,629 for the first time since May last year
It’s a public holiday in Germany today so liquidity may be diminished. There are no data releases scheduled.
WTICOUSD Daily Chart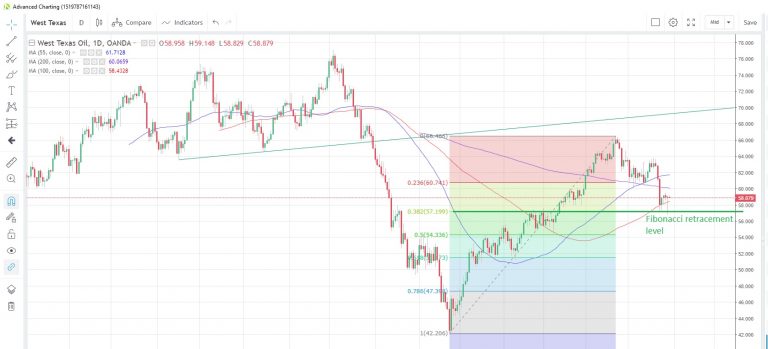
Crude oil prices spiked lower to 11-week lows yesterday amid growth/demand concerns, but recovered in to the close to finish marginally in the red.
The index is holding above the 38.2% Fibonacci retracement of the December-April rally at $57.20 on a closing basis
EIA crude oil inventories are expected to show a drawdown of 800,000 barrels in the week to May 24, according to the latest poll of analysts. That would be the first reduction in three weeks.
GOLD Pressure Builds Up On The Downside
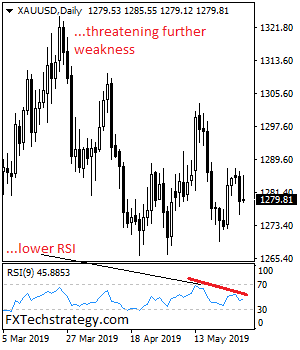
GOLD pressure builds up on the downside with the commodity closing lower on Wednesday. On the downside, support comes in at the 1,270.00 level where a break will turn attention to the 1,260.00 level. Further down, a cut through here will open the door for a move lower towards the 1,250.00 level. Below here if seen could trigger further downside pressure targeting the 1,240.00 level. Conversely, resistance resides at the 1,290.00 level. Further out, resistance resides at the 1,300.00 level where a break will aim at the 1,310.00 level. A turn above there will expose the 1,320.00 level. Further out, resistance stands at the 1,330.00 level. All in all, GOLD pressure builds up on the downside as it looks to decline further medium term.
Eco Data 5/30/19
[php_everywhere instance="1"]
US update: Trade war overshadows Italy debt, stocks and yields dive
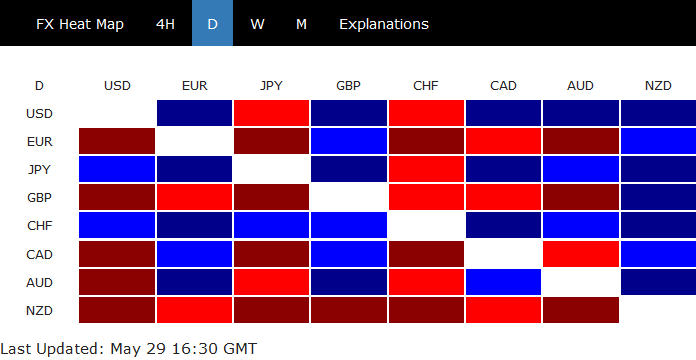
Swiss Franc, Yen and Dollar are the stars today as risk aversion intensifies in US session. DOW hits as low as 24938.24 and is currently down more than -300 pts. 10-year yield drops to as low as 2.210 and stays week. Most importantly, all major indices drop through recent support level, suggesting the declines started back in late April have resumed and are extending.
In our views, the reactions to news that China is weaponizing its rare earths in trade war with US are exaggerated. Though, it's clear that there is no end in sight and the relationship will only get worse. Bigger risks to market sentiments lie ahead with China PMIs release on Friday. Probably even more so, US ISMs could show deep deterioration next week, as with Market US PMIs indicated last week.
In Europe, FTSE closed down -1.15%. DAX dropped -1.57%. CAC lost -1.70%. German 10-year yield is down -0.0173 at -0.175.
EU Finance Commissioner Valdis Dombrovskis and EU Economic Commissioner Pierre Moscovici have formally sent a letter to Italian Economy Minister Giovanni Tria, requesting explanation that the country hasn't "made sufficient progress towards compliance with the debt criterion" of EU rules.
This is the first step the so-called excessive deficit procedure, which could result in request for "non-interest bearing deposit" of up to 0.2% of gross domestic product, or around EUR 3.5B. If Italy refuses to comply with the request as Deputy Prime Minister Matteo Salvini signalled, that would lead to a further breach of EU law.
Italian 10-year yield, currently down -0.043 at 2.647, suggests that investors are more overwhelmed by broader risk aversion.