

Sample Category Title
FTSE – Slide Continues as China Threat Spooks Investors
The FTSE index has plunged in the Wednesday session. Currently, the FTSE index is trading at 7,185, down 1.15% on the day. There are no British events on the calendar. On Wednesday, the U.S. releases second estimate GDP for the first quarter.
Reports that China has raised the ante in a bitter trade dispute have rocked global equity markets on Wednesday. Chinese media has reported that China is threatening to curb the supply of rate metals to the U.S. These products are used in the production of items such as cell phones and electric cars, so any interruption in supply could hurt U.S. technology companies. Technology company listings on the FTSE are down sharply – Micro Focus has declined 4.25% and Vodafone has fallen 1.82%. Investors remain jittery over escalating tensions between the U.S. and China, and this latest salvo from China has exacerbated risk apprehension.
The U.S. economy continues to perform well, and first-quarter economic growth is expected to remain above the 3% level. Preliminary GDP will be released on Thursday and is expected to post a healthy gain of 3.1%. In April, the initial release came in at 3.2%, easily beating the estimate of 2.2%. If the revised reading also beats expectations, risk appetite could improve and boost the FTSE.
1990’s Reloaded? Clues On The Fed’s Path To “Insurance Cuts”
Highlights
- Slowing global growth, rising trade tensions and soft inflation have led to expectations that the Federal Reserve's next move will be a rate cut.
- Rate cuts have typically coincided with recessions, but not always. The Fed cut rates by 75 basis points in 1995 and again in 1998, taking out "insurance" against the possibility of an economic deterioration that ultimately proved successful in avoiding it.
- These two instances offer some lessons as to what factors may push the central bank toward "insurance cuts." In the first case (1995), the catalyst was domestic economic deterioration following a relatively swift tightening in policy. In the second (1998), global factors and an extreme bout of risk aversion in financial markets led the Fed to cut rates.
- Of the two episodes, the latter experience shows more parallels to today. U.S. economic activity has held up relatively well, but global conditions are fragile and financial markets remain on edge in response to trade wars. Should a policy shock tip the scale, the Fed is one of the few central banks that can respond by easing policy, and the most likely to do so.
When the Federal Open Market Committee (FOMC) raised the federal funds rate in December 2018, its preferred inflation metric sat at the 2.0% target.1 It has since softened to 1.6%. This slowdown, along with comments by a handful of Fed members, has raised market expectations that the Fed's next move will be a rate cut.
The notion of "insurance cuts" harkens back to the mid-1990s, which was the last time the Federal Reserve adjusted policy in what – with hindsight – proved to be outside of a recession. Faced with softer-than-expected economic growth, the FOMC cut the federal funds rate by a cumulative 75 basis points from July 1995 to January 1996. It did so again in late 1998 due to deterioration in the global economy and a rapid tightening of financial conditions (Chart 1).
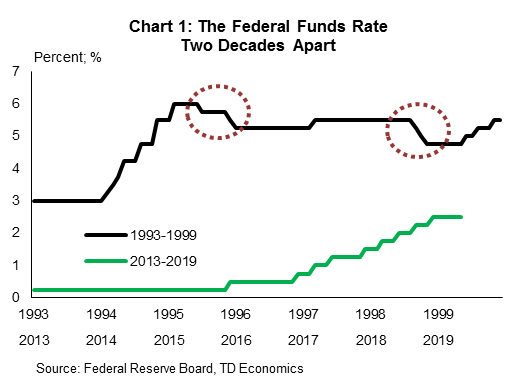
Our baseline expectation is for the Federal Reserve to remain on hold over the remainder of this year, but the notion of insurance cuts cannot be readily dismissed should policy or external shocks prompt further economic deterioration, or should financial conditions tighten significantly. Today's international backdrop sits on a thinner growth cushion relative to past years, leaving it more susceptible to forecast misses or policy shocks, even if modest in nature. Likewise, the U.S. domestic economy has come down from its 2018 cloud, as leading indicators on business sentiment show some convergence to global peers. Simply put, unintended outcomes today carry more risk than those of yesterday.
Insurance cut versus trial-and-error process
There was a clear distinction between the two non-recessionary periods where the Fed cut 75 basis twice over in the 1990s. The 1994-1995 period can be characterized as part of the trial-and-error process of the Federal Reserve searching for the appropriate neutral rate. We've written extensively on this topic, noting that there's theory but not precise science backing the setting of a neutral rate.
Between January 1994 and February 1995, the federal funds rate had risen a steep 300 basis points to 6.0%. This was an aggressive response that included rate hikes of 50 basis points (two meetings) and 75 basis points (two meetings). Based on the data the Fed had on hand at that time, the American economy was expanding at an average rate of roughly 4.0% through 1994. Theory supported an economy pushing swiftly into excess demand territory, where inflationary pressures would threaten the stability of the expansion if left unchecked.
Following the rapid adjustment, the Fed went into wait-and-see mode to gauge economic activity and inflation. By July of 1995, it become clear that a more rapid deceleration was materializing relative to the Fed's forecasts. The FOMC minutes from that meeting noted sluggish consumer spending, decelerating business investment, and a "substantial" decline in nonfarm payroll employment in May (-101k) "after a small decline in April." Adding to the body of evidence was a rising unemployment rate and a swiftly plummeting leading indicator: The ISM manufacturing index moved deeply into contraction territory, falling nearly 13 percentage points in less than eight months (Chart 2).
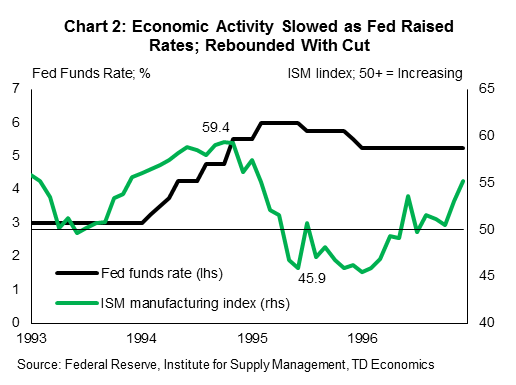
There was clear supportive evidence that the Fed's rate-setting exercise may have overreached and this motivated an adjustment to rates, with a 25-basis point cut in July. Thereafter, the Fed returned to wait-and-see mode, monitoring the data. Although the economy stabilized, a subsequent deceleration in inflation opened the debate on whether the economy had more room to run. Six months after the first cut, the Fed followed through with a second noting:
Since the last easing of monetary policy in July, inflation has been somewhat more favorable than anticipated, and this result along with an associated moderation in inflation expectations warrants a modest easing in monetary conditions.
The FOMC cut a final 25 basis points in January 1996. At the time, a government shutdown had resulted in the delay of several key economic data releases (sound familiar?). Still, what data was available pointed to somewhat slower growth and weaker inflation, enough for one last cut.
Lower rates, better job market today
There are a few obvious differences between the mid-1990s experience and today. First, today's Fed has lifted rates cautiously, at roughly one-third the pace seen then. This leaves the real (inflation adjusted) rate at a mere 1.0%, compared to 3.9% at the height of the 1995 episode.2 Even after cutting rates during that period, the real fed funds rate was 225 basis points above where it is today.
Second, the pullback in labor demand factored materially into the Fed's decision to edge down the policy rate. In contrast, the labor market of today seems to repeatedly defy expectations on the upside. Looking past typical month-to-month data volatility, the year-to-date trend is holding at 190k jobs, slightly below the pace set this time last year with an economy that produced 3% GDP growth for the year. Recent upward movements in the unemployment rate have had more to do with an influx of workers being enticed back into the market, than weakness in labor demand. Still, the unemployment rate of 3.6% in April sits 70 basis points below the FOMC's median long-run estimate.
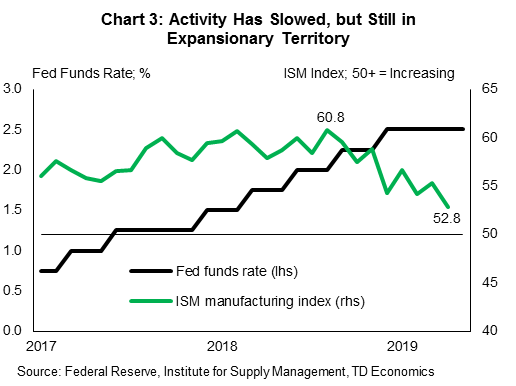
While the economic backdrop differs today from 1995, the period offers a glimpse of the Fed's willingness to be flexible when data deviates from their prior assumptions in the trial-and-error exercise of setting monetary policy. Indeed, there have been some unfavorable data trends unfolding today that could prompt a cut should further deterioration become apparent. Take the manufacturing ISM index. This leading indicator has come off the boil, falling eight points in eight months. However, it remains in expansion territory at 52.2. A sustained breach below the 50 threshold alongside softening labor demand or inflation could trigger a red flag at the Fed, as it did before (Chart 3).
Clear parallels to 1998 in global backdrop
However, we are more intrigued by the late 1990s experience, where there are several interesting parallels to today's environment. In 1998, the domestic economy was relatively stable, with only some pockets of softness, as we see today. But, the global environment had become precarious and financial conditions had weakened considerably in the lead up to rate cuts.
As it was then, the greater concern today is a kick-up of market anxiety due to the intersection of escalating trade wars and an already weakened global economy. Risk-averse behavior can reignite emerging markets woes through currency fluctuations and capital flight. In turn, these forces would reach the real economy through deteriorated confidence and income channels.
Here is the situation that led to a series of cuts during 1998. That summer, volatility spiked and stock markets declined precipitously over the course of a month, with the S&P 500 losing almost 20% of its value (Chart 4). At the same time, yields on long-term U.S. government debt plummeted, with movement concentrated at the long-end that swiftly compressed the entire curve.
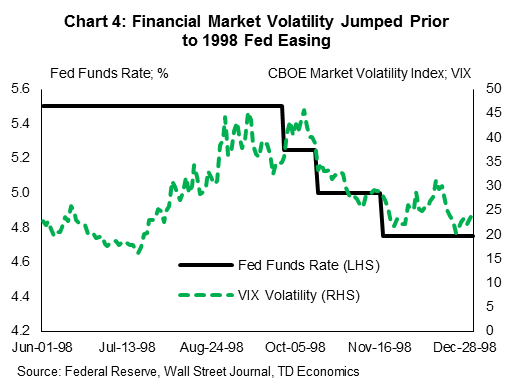
The decline in financial market sentiment was largely due to events abroad – the Asian financial crisis, which began in 1997 was still fulminating and was joined in August 1998 by the Russian debt crisis. In the same month, Moody's Investment Services threatened to downgrade Japan's bond rating.3 Flight to safety caused the trade-weighted U.S. dollar to rise by over 20% from the beginning of 1997.
Domestic economic data began to show some cracks, but nowhere of the magnitude of the mid-1990s. However, inflation slowed with core CPI at just 2.2% and falling energy prices pulling down headline inflation to just 1.7%. The Fed's expectation that a tight labor market would put upward pressure on inflation had failed to materialize (much like we see today).
In response to the international storm clouds, the Fed employed the first of three 25 basis point insurance rate cuts in September of 1998. This first cut helped to initially shore up market confidence, but lacked staying power. By early October, the S&P 500 had returned to within a hair of its pre-rate cut nadir and the yield curve went briefly negative. The carnage was enough for the Fed to announce a rare intermeeting 25 basis point cut in October (less than three weeks after the first one). Analysts expected the Fed would cut rates again when it met officially in November, and it did exactly that, bringing the fed funds rate to 4.75%. This was enough to stabilize financial market sentiment and thwart the threat of strong negative wealth effects passing through the economy and, eventually, undermining real economic activity. By June of the following year, the Fed regained the confidence to hike rates again.
Financial conditions matter
Fast forward to today and we find some similarities that could prompt the Fed to ease policy under a deteriorating global landscape. But, it would likely require an acute and sustained deterioration in financial market conditions on escalating trade disputes that threaten the health of the American economy. Cutting the policy rate on subdued inflation dynamics alone seems like a long shot, absent other transmissions from global and domestic strain.
In some ways, we already saw a glimpse of the Fed's reaction function at the start of the year, with its pivot to patience following the deterioration in financial conditions in late 2018. In response to this shift in Fed communication, financial conditions improved dramatically, with stock prices rallying and corporate bond spreads narrowing.
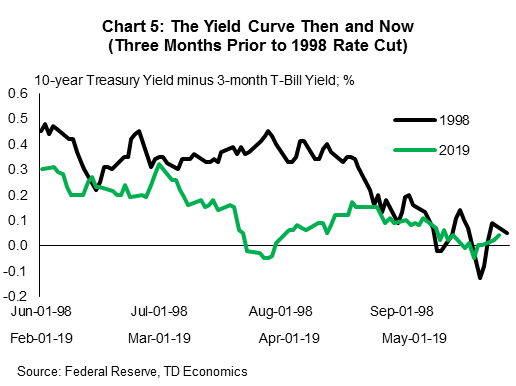
However, without rate cuts, the yield curve has remained on the cusp of inversion, with the spread between 3-month T-bills and 10-Year Treasuries flirting with negative territory on any given day. Should a second wave of trade-related fears sweep over financial markets, the impact could be both a steep sell off in equity markets, rise in risk spreads and a yield curve that moves further into inversion territory than it did in 1998 (Chart 5). Should this take place, in an environment of soft inflation (as in 1998) the Fed may indeed decide the balance of risks warrants some insurance via a cut to interest rates.
Bottom line
The two periods of insurance cuts in the 1990s may not predict exactly how the FOMC will respond to changing economic conditions today, but they do provide examples of the Fed's reaction function and the circumstances that could lead to a change in policy stance.
As in the 1990s, debates about the level of economic slack and the seeming disconnect between a tight labour market and soft inflation remain as pertinent as ever. Perhaps the most notable difference on this front is that at that time lower inflation was viewed as a positive rather than a sign of failure.
Ultimately, the data to-date does not meet the bar for the Fed to move off its current patient stance. With respect to data, economic growth is still running above FOMC members' long-term (trend) assumptions, the unemployment rate is a hair away from historical nadir and the job market has shown few signs of slowing down. Inflation excluding food and energy has slowed, but other core measures have been much more stable around the Fed's (now explicit) 2% target.
While the bar is high for a rate cut, the outcome cannot be dismissed given the asymmetric risks created by escalating trade tensions and a weaker economic backdrop (both global and domestic) relative to a year ago. A test of market confidence that places the economy at risk could move the notion of insurance cuts from the history books to the playbook.
End Notes
- The year-on-year change percent change in the PCE price index excluding food and energy.
- Deflated by core PCE deflator.
- http://money.cnn.com/1998/07/23/markets/marketwrap/
New Zealand Dollar Drops as China Raises Ante in Trade War
After a quiet start to the week, the New Zealand dollar has dropped considerably in the Wednesday session. In North American trade, NZD/USD is trading at 0.6508, down 0.53% on the day. On the release front, there are no major data releases out of the U.S. or New Zealand. In the U.S., the Richmond Manufacturing Index improved to 5 points, shy of the estimate of 6 points. In New Zealand, ANZ Business Confidence improved to -32.0. Later in the day, the government releases the annual budget.
Reports that China has raised the ante in a bitter trade dispute have rocked global equity markets and hurt risk currencies such as the kiwi. Chinese media reported on Wednesday that China is threatening to curb the supply of rate metals to the U.S. These products are used in the production of items such as cell phones and electric cars, so any interruption in supply could hurt U.S. technology companies. With the trade war between the U.S. and China in full swing, it’s no surprise that the business sector is deeply pessimistic about economic conditions. China is a major trading partner, with some 25% of New Zealand exports going to the Asian giant. The ANZ Business Confidence survey remains mired deep in negative territory. Still, the indicator moved slightly higher in May, good enough for a 3-month high. Meanwhile, the semi-annual RBNZ Financial Stability Report stated that financial risks had not increased since the last report in November. The bank circled high consumer debt and New Zealand’s exposure to global developments as the main points of concern.
The U.S. consumer remains very optimistic about the economy, according to the latest CB consumer confidence index. The index jumped to 134.1 in May, up from 129.2 in the April release. This score easily beat the estimate of 130.1 and is close to 18-year highs. Retail sales were soft in April, but the sharp improvement in consumer confidence has raised hopes that retail sales data will improve in May.
The U.S. economy continues to perform well, and first-quarter economic growth is expected to remain above the 3% level. Preliminary GDP will be released on Thursday and is expected to post a healthy gain of 3.1%. In April, the initial release came in at 3.2%, easily beating the estimate of 2.2%. If the revised reading also beats expectations, traders can expect the greenback to move higher against its rivals.
ECB Research: Walking a Tightrope
- At the coming ECB meeting we expect a continuation of the recent 'delayed, not derailed' communication entailing a continued easing bias and downside growth risk assessment and no change in forward guidance.
- We expect the changes to the updated staff projections to be relatively minor and, therefore, still point to an upward trend on both core inflation and the growth outlook.
- We expect the ECB to announce (favourable) TLTRO modalities, potentially with an incentive structure to a rate of the current deposit rate of -40bp. Further, we expect it to put the tiering discussion in the background.
- In terms of the financial market implications, we see short-end rates markets suffering initially, although we expect the low for longer/hunt for carry narrative to continue to prevail beyond next week's meeting. The EUR/USD has not reacted much to ECB policy changes at past meetings, so we do not expect this meeting to be a game changer.
Communication – walking a tightrope…
Financial market participants are much anticipating next week's ECB meeting. Since the ECB watchers conference in late March, when speculation about a potential tiering system caught significant attention, ECB officials have been silent on policy signals. In our view, the new updated staff projections will gain traction, as hard data have been holding up, while survey data have been on a weaker footing in certain jurisdictions. Combined with lingering risks to the growth outlook, the ECB faces a difficult exercise to communicate confidence in the baseline projections, albeit acknowledging downside risks (intensification of trade war, Brexit and China).
…as market-based inflation expectations deteriorate
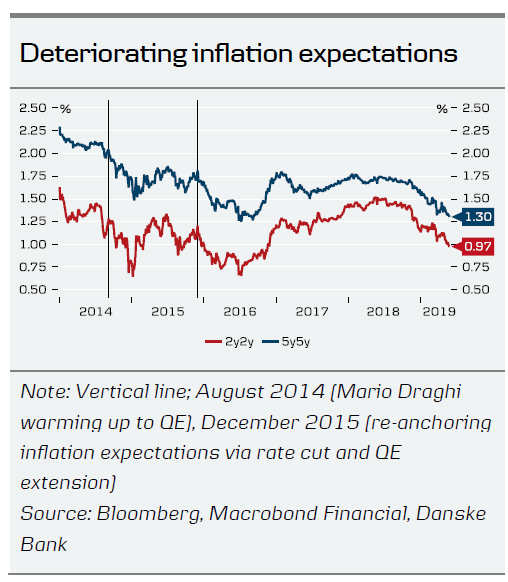
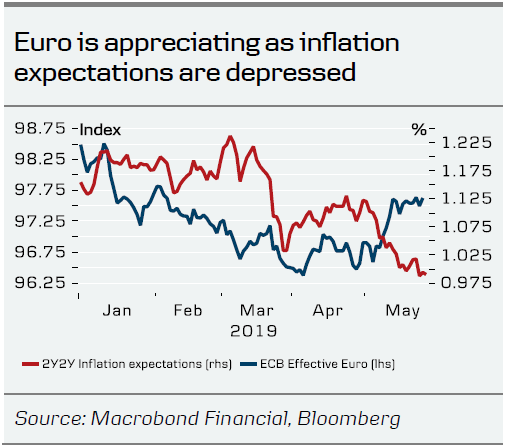
Since the end of 2018, market-based inflation expectations have deteriorated markedly. The decline has intensified over the past few weeks. The 5Y5Y and 2Y2Y inflation swap is trading close to an all-time low. As the ECB has previously stepped up its policy stimuli when inflation expectations declined from much higher levels, markets have recently been speculating increasingly about the next stimuli measure. Most prominently, the inflation expectation for the 5Y5Y was just below 2% when Mario Draghi warmed up to do QE in August 2014, which is well above the 1.32% at the time of writing. However, as growth and realised spot inflation are still holding up, we find new stimuli measures premature. Should further stimuli be needed in a risk scenario, we expect the ECB to restart QE (see Guns (and not bazookas) dominate ECB's crisis arsenal, 9 January).
Policy measures – TLTRO3 modalities announced, no tiering
We expect the ECB to announce (favourable) TLTRO3 modalities at next week's meeting. We have previously heard Governing Council members, such as Finland's Olli Rehn, calling for an announcement at the June meeting. As we argued in ECB Research - TLTRO3: Italy to be main beneficiary, 9 November 2018, the need for new liquidity operations is due mainly to the effect on the Italian banking sector and we find no particular need in other jurisdictions. The minutes from the April meeting (as well as during the press conference) gave a clear message; the TLTRO modalities will depend on bank transmission and the economic outlook.
The most prominent outlier to otherwise relatively strong bank lending data for April was Italy and with risks to the economic outlook on the downside, we expect the ECB to announce favourable TLTRO requirements (potentially down to a deposit rate of -40bp as part of the incentive structure). With the high excess liquidity and current yield levels, we do not expect the series of operations to lead to a balance sheet expansion, as take up would be concentrated primarily in peripheral countries, which already have high take-ups.
The tiering discussion, which gained traction immediately after the 'The ECB and Its Watchers' conference (where Draghi said they should be looking into measures mitigating the side effects of negative interest rates, if any), should go into the background. Since then we have heard important Governing Council members, such as the ECB's Benoît Coeuré, Germany's Jens Weidmann (German banks stand to gain the most from tiering) and France's François Villeroy de Galhau (who originally spoke in favour of this), all sounding lukewarm on the idea. Furthermore, the April Bank Lending Survey showed a positive impact on lending volumes from the negative interest rate policy. Similarly, an ECB paper pointed to the positive impact of NIRP outweighing the negative effects. Therefore, we expect Draghi to strike a more muted tone on tiering and repeat that the ECB is always having an holistic review of its policy measures without going further into the details (see more under ECB set to disappoint the fixed income market below).
Importantly, with the tiering discussion, Draghi achieved two important goals: (1) making financial conditions easier and (2) no policy rate changes in the near future, as tiering is part of a low-for-longer narrative. Looking ahead, we do not see the ECB moving on the forward guidance next week, due to the minor changes in staff projections. We update our view so we no longer expect policy rate changes until at least the end of 2021.
A more clouded growth outlook…
At the April meeting, the ECB maintained its downside growth risk assessment and we expect it to continue to do so at the June meeting, despite the better-than-expected Q1 growth rate of 0.4% q/q. One important uncertainty on the updated forecasts is whether they will still show a pickup in economic momentum towards the end of this year. Since March, hard data has generally outperformed soft data. However, despite signs of strengthening domestic demand, business surveys point to continued headwinds in the manufacturing sector, with the risk of these broadening out to the service sector. In recent months, the ECB has increasingly become concerned about the negative impact of persistent political uncertainty on business confidence and investments and, in light of the re-escalating US-China trade war, this risk has become even more pressing. Note that staff projections will not include the effects of tariffs that have not taken effect.
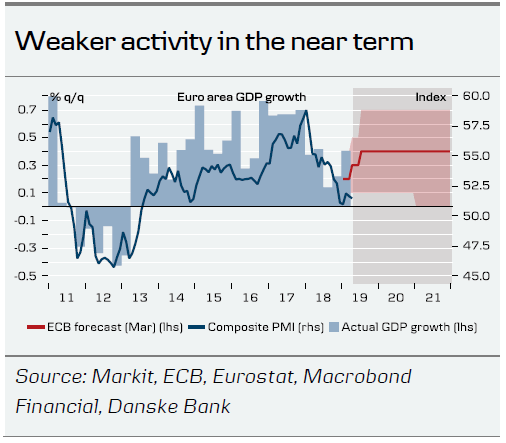
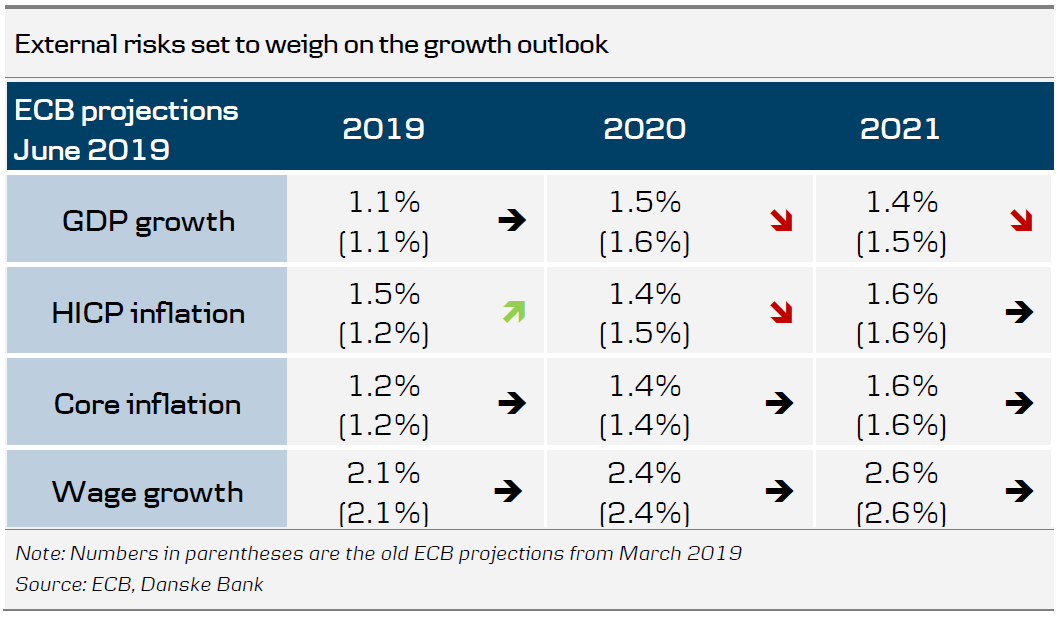
Some Governing Council members were already losing confidence in the projected upturn at the April meeting as the minutes revealed. Hence, in the updated ECB projections, we expect to see a more cautious growth message, with a downward revision of the growth forecasts for 2020 and 2021 to 1.5% and 1.4%, respectively (see table below). That said, we expect Draghi to emphasise that the economy remains some way off recessionary territory and, therefore, does not yet warrant further policy measures beyond favourable TLTRO3 terms.
…leaves markets sceptical about any pickup in core inflation
Despite an increase in oil prices of almost 40% since the start of the year and core and headline inflation surprising on the upside at 1.3% and 1.7%, respectively, in April, inflation market pricing has remained subdued. As fears about a cyclical downturn in the economy have intensified, market-based inflation expectations have continued to slide, with 2Y2Y falling below 1%, the lowest rate since 2016.
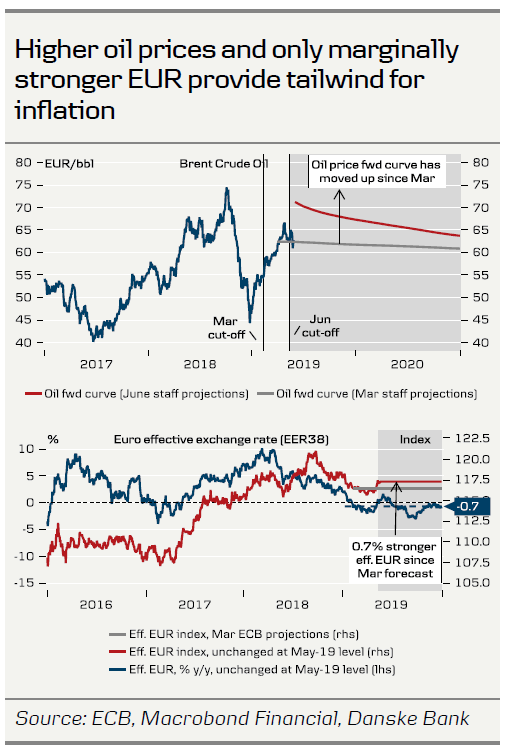
The ongoing fall in inflation expectations is an obvious worry for the ECB but we expect it to hold on to its narrative that rising wages will eventually push up underlying inflation pressures. Technical assumptions of higher oil prices and a broadly unchanged effective euro, plus easier financial market conditions, should, on balance, lift the ECB's inflation profile. However, we expect a weaker growth outlook and energy price base effects exerting a stronger drag in 2020 due to the steeper slope of the oil forward curve to offset this.
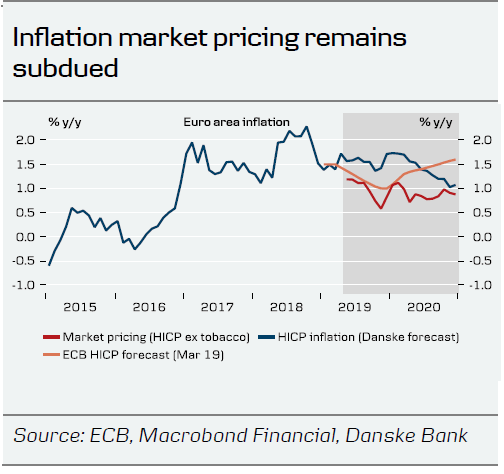
Since March, the ECB's narrative has stressed that the inflation pickup has been delayed, not derailed. We agree with Draghi that the structural conditions for pass-through from wages to prices remain in place and we still see strong arguments for core inflation to reach 1.3-1.4% by year-end. However, in light of the slowing expansion pace, core inflation rates at 1.6% on average in 2021 as the ECB is likely to predict still seem optimistic to us (see also Euro Area Research - Inflation under the microscope: simmering, not boiling, 13 May).
We do not think the appointment of Philip Lane as the ECB's new Chief Economist will have impact on the economic outlook or assessment.
ECB set to disappoint the fixed income market
ECB set to price lower probability of a rate cut
The European fixed income market might be in for at least a short-term disappointment if the ECB delivers the message we expect. In particular, the short-end could see upward pressure. Over the past month, the market has started to price in 5bp of accumulated rate cuts over the next 12 months. This compares with the end of April, when very little was priced in the curve. We find the pricing stretched if the ECB does not open the door for further easing.
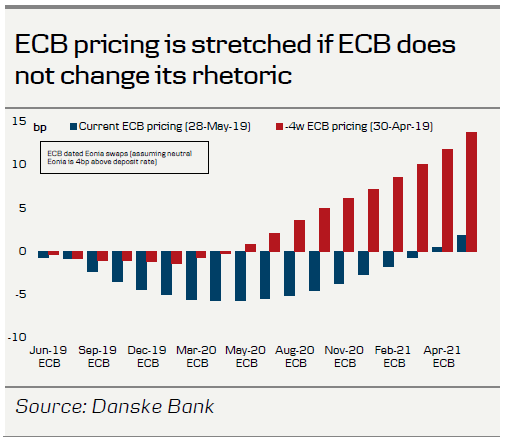
For the current market pricing to materialise (on a 12-month horizon), we would have to see either (1) a discussion on rate cuts as a stimuli tool or (2) a stepping up of the discussion on a tiered rates system, including a cut in the lower-bound rate. We do not see an extension of the current forward guidance at this stage due to the only minor changes to staff projections. Furthermore, note that the current guidance of 'at present levels' means neither cut nor hike in the forward guidance period. Recall that the ECB removed 'at present or lower levels' from its guidance in June 2017. Therefore, should markets put weight on Draghi's words, the confirmation or potential extension of forward guidance may put a mark in the front of the curve, at least initially. It is still too early for markets to remove completely the probability that the next move might be a cut but as we doubt the ECB will opt for any of these options as its policy response toolbox, we repeat our recommendation from Government Bonds Weekly, 16 May, to pay 9M3M EONIA
Little impact on 10Y yields expected
Bunds have seen support over the past couple of weeks and the 10Y yield has fallen to -15bp. If our expectations are correct, we should expect to see a modest repricing of ECB expectations. However, the result should be a modest bearish flattening of the 2s10s German curve. We strongly doubt the market will move forward ECB hike expectations. In addition, as a disappointment would tend to weigh on risk appetite and support Bunds, we are reluctant to call for any significant move higher in 10Y yields after the ECB meeting.
FX market isn't buying ECB's easing bias
Contrary to the rates markets, the FX market does not share the general perception of fixed income markets. In other words, the FX market is calling the ECB's bluff. Following all three ECB meetings this year, the market has bought EUR/USD – in particular, this was the case after the first two meetings, when the ECB made its policy shift (see chart below left).
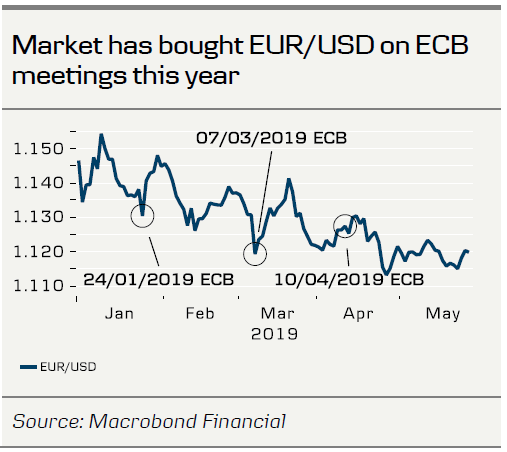
We envisage a broader trend emerging this year: inflation expectations are declining to worryingly low levels and the euro has started to appreciate recently (see chart below right). The FX market seems to be concluding that the ECB is about to fall to the liquidity trap and it needs action, not words, before selling the euro. Since, we do not expect any news from the ECB at the upcoming meeting, we see small upside risks to EUR/USD around the meeting given that the market already prices in the rather bleak outlook for inflation.
Oil Rout Resumes as Gold Struggles to Shine
Oil
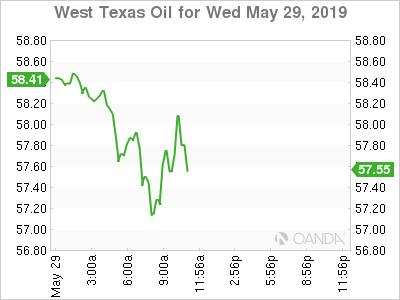
It is getting ugly out there and despite a backdrop of geopolitical risks that could squeeze supplies, the latest trade war threats from China could cripple global growth and thus take down oil prices. West Texas Intermediate crude is down 2.1% off its worse levels, while Brent’s decline is closer to 1.6% as no end appears in sight for the trade war. Crude is falling through key support levels and is quickly erasing the effects of the OPEC + production cuts. WTI’s end of year rally to mid-April has seen price give back roughly 40% of those gains.
US stockpiles are expected to decline this week, but that may not matter if we do not see some constructive news that trade talks between the two largest economies are poised to resume. The oil market and all risk assets remain very vulnerable here and we should not be surprise if we see another 5% lower across on the board on further risk aversion flows.
West Texas Intermediate crude is tentatively below the 100-day SMA, which trades at $58.29. Consecutive daily closes below this level could see further downward momentum target $54.48, which is the 50% Fibonacci retracement of the Christmas eve low to April high.
Gold
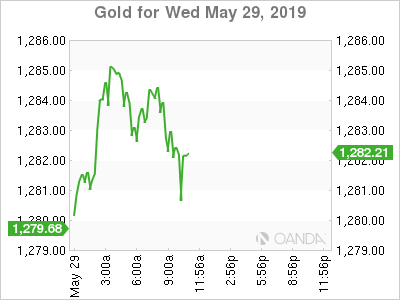
Gold rises on trade angst but remains the least preferred safe-haven as investors flee to bonds. The yellow metal has delivered limited gains on growing recessionary concerns, but that could change on the break of $1,300 an ounce. The dollar’s run will also hamper gold, but we could see that be coming to an end, or at least a break, when the Fed admits the recent dip with inflation was not transitory. Rate cuts are priced in by the financial markets, the Fed just needs to capitulate.
The precious metal is also seeing key resistance from the 50-day SMA at 1,290.60. To the downside, the 200-day SMA which is at 1,260.20 remains key support.
British Pound Steady on Lack of Fundamentals, Investors Look ahead to U.S. GDP
After starting the week with slight losses, GBP/USD has paused in the Wednesday session. Currently, GBP/USD is trading at 1.2650, down 0.02% on the day. On the release front, there are no British events. In the U.S., the sole event is the Richmond Manufacturing Index, which is projected to climb to 6 points. On Thursday, the U.S. releases Preliminary GDP and unemployment claims.
Inflation in the U.K. has been moving higher. Consumer inflation pushed above the 2% level in April, with a gain of 2.1%. This marked a 4-month high. The upward trend has continued with shop price inflation, which accelerated to 0.8% in May, up from 0.4% in the previous release.
The U.S. consumer remains very optimistic about the economy, according to the latest CB consumer confidence index. The index jumped to 134.1 in May, up from 129.2 in the April release. This score easily beat the estimate of 130.1 and is close to 18-year highs. Retail sales were soft in April, but the sharp improvement in consumer confidence has raised hopes that retail sales data will improve in May.
The U.S. economy continues to perform well, and first-quarter economic growth is expected to remain above the 3% level. Preliminary GDP will be released on Thursday and is expected to post a healthy gain of 3.1%. In April, the initial release came in at 3.2%, easily beating the estimate of 2.2%. If the revised reading also beats expectations, traders can expect the greenback to move higher against its rivals.
Bank of Canada Holds as Domestic Improvement Plays Against Building International Uncertainty
- Meeting market expectations, the Bank of Canada left its overnight interest rate unchanged at 1.75% today. The statement that came with the decision had a 'business as usual' tone, suggesting that there remains no impetus to move the policy interest rate. The Bank of Canada judges that "the degree of accommodation being provided by the current policy interest rate remain appropriate"
- The Bank sees a lot to like in its updated assessment of economic conditions, noting "accumulating evidence that the slowdown in late 2018 and early 2019 is being followed by a pickup". The statement pointed to recovering oil production, a more stable housing market, and continued strong job growth. The Bank sees signs of a pickup of consumer spending and exports in the second quarter, as well as business investment that has "firmed".
- Unsurprisingly, the downsides stem from the external environment. The global economy is characterized as moving in line with the Bank's expectations, but trade conflicts have driven uncertainty higher. Chinese trade restrictions are impacting Canadian exports, although the removal of steel and aluminum tariffs and better prospects for making CUSMA law may serve to counterbalance the negatives.
- In terms of inflation, there is little to report, with CPI inflation expected to remain around the 2% target in coming months.
Key Implications
- No surprise here. Friday's GDP report is a possible wildcard, but so far it appears that economic growth in the first half of the year is likely to meet the Bank of Canada's expectations. On its face, this should provide the Bank confidence in its outlook, but two things bear remembering. First, the outlook for the first half of the year sees quarterly growth averaging just 0.8% annualized, hardly a robust performance. Secondly, the Bank's forecast sees a more robust second half performance, but this is a 'pure' forecast that will not be confirmed (or denied) in the data for some time yet.
- On that note, the uncertainty surrounding the second half of the year remains elevated. Even as we've received some 'wins' in the form of the end of steel and aluminum tariffs, other trade conflicts are maintaining a haze over the economic outlook. Against this backdrop, a neutral stance that maintains optionality in the form of data dependence seems appropriate.
- Overall, today's short statement appears to have been built with tempering market expectations in mind. Carefully balancing near-term positives with longer-term risks and maintaining data dependency suggests that markets may be getting ahead of themselves in skewing the odds towards a rate cut later this year (implied odds stood at about 30% following the statement, roughly unchanged). It seems that we'll need to see a deterioration in the economic data to spur easing, which, for the time being, is not in the cards – neither in the Bank's view, nor ours.
Bank of Canada Puts Improving Domestic Data ahead of Rising Trade Risks
- The overnight rate was held at 1.75% for a fifth consecutive meeting
- The bank’s neutral policy bias was unchanged; accommodative monetary policy remains warranted
- Once again, developments in household spending, oil markets, and global trade will be key to any future moves
The five weeks since the BoC’s last rate announcement were action-packed with improving domestic data but rising global trade tensions. Today’s policy statement put the former front and centre. The bank noted “accumulating evidence” that the economy’s slowdown over the last two quarters will be transitory. Early signs of recovery in the energy sector, stabilization in most housing markets, and strong hiring were seen supporting that view. Consumer spending and exports are expected to improve in Q2—perhaps the BoC’s way of telling us not to get worked up about Friday’s Q1 GDP report, which should see softness in both categories.
The statement also noted that, while global growth is evolving as expected, escalating trade conflicts are generating heightened uncertainty. The BoC has in mind both rising US-China trade tensions (including higher tariff rates) and Chinese restrictions on Canadian imports. Those development were countered by recent removal of US steel and aluminum tariffs and Canada’s retaliatory tariffs, as well as improving prospects for CUSMA ratification. It’s worth noting that global growth and trade tensions were at the top of the BoC’s April statement but were bumped lower in today’s release. While Governor Poloz has called trade conflicts a top risk to the macroeconomic outlook, the BoC doesn’t seem to be panicking about recent developments.
Senior Deputy Governor Wilkins will give an economic progress report tomorrow in Calgary.
US stocks gap lower, DOW breaks near term support
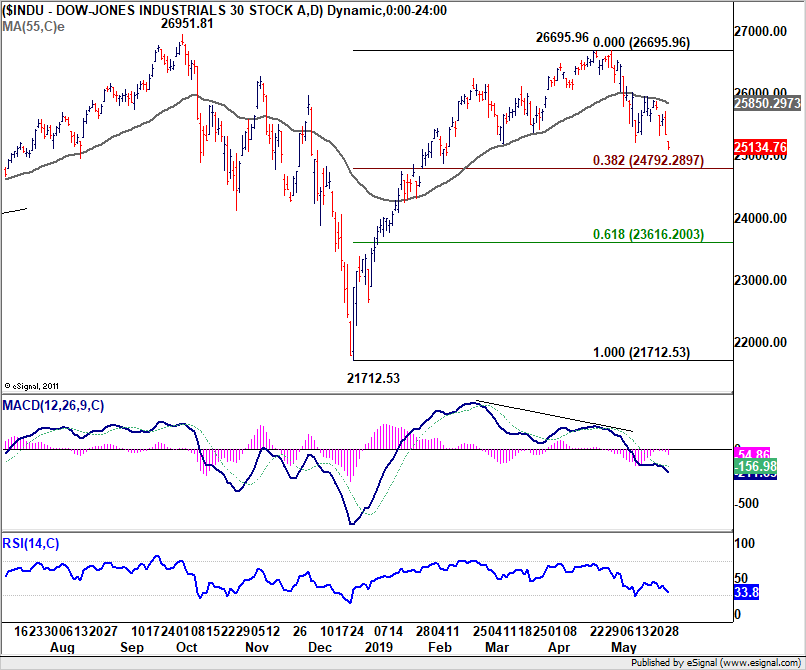
US stocks gap broadly lower today. While the decline is so far "relatively" limited, recent support levels are taken out. That is, DOW drops through, 25222.51 support and the fall from 26695.96 is resuming. Similarly, S&P 500 gaps through 2801.43 support to as low as 2778.45 so far.
Development so far is in line with our view. That is, fall from 26695.96 is the third leg of the consolidation pattern from 26951.81 historical high. Further fall should be seen in near term to 38.2% retracement of 21712.53 to 26695.96 at 24792.28. But we're looking at at least a break of 61.8% retracement at 23616.20 before bottoming.
BoC stands pat, drops no hint on rate hike, USD/CAD spikes higher
Canadian Dollar weakens notably after BoC kept overnight rate unchanged at 1.75% as widely expected. The central bank assessed that economic developments were broadly in line with the April MPR, including growth and inflation.
Also, recent slowdown in late 2018 and 2019 was "temporary" even though "global trade risks have increased". Thus, "degree of accommodation being provided by the current policy interest rate remains appropriate."
BoC also sounded noncommittal to any future rate move. It just noted that "Governing Council will remain data dependent and especially attentive to developments in household spending, oil markets and the global trade environment". That is, for the near term, there is still no chance of a rate hike.
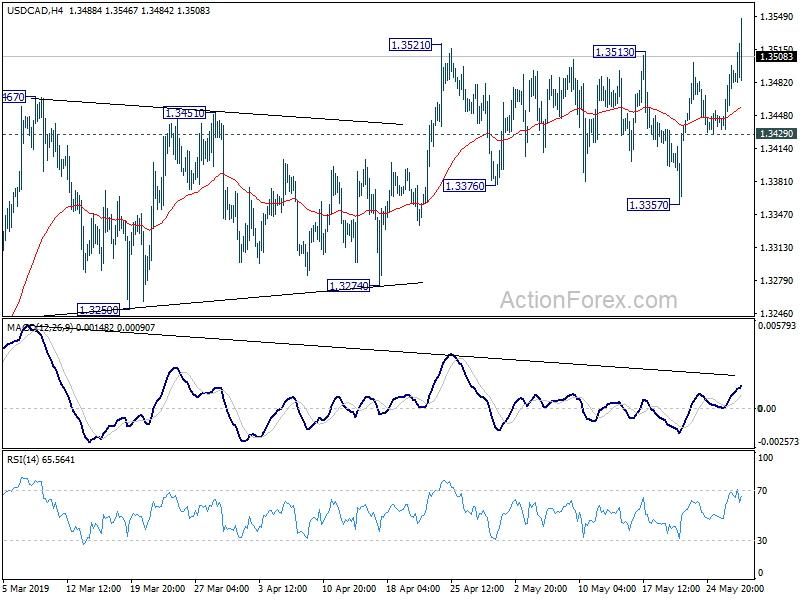
USD/CAD spikes higher to 1.3546 after the release, through 1.3521 resistance. But there is no follow through buying yet. Further rise is in favor as long as 1.3429 support holds.
Full statement here:
Bank of Canada maintains overnight rate target at 1 ¾ per cent
The Bank of Canada today maintained its target for the overnight rate at 1 ¾ per cent. The Bank Rate is correspondingly 2 per cent and the deposit rate is 1 ½ per cent.
Recent Canadian economic data are in line with the projections in the Bank's April Monetary Policy Report (MPR), with accumulating evidence that the slowdown in late 2018 and early 2019 is being followed by a pickup starting in the second quarter. The oil sector is beginning to recover as production increases and prices remain above recent lows. Meanwhile, housing market indicators point to a more stable national market, albeit with continued weakness in some regions.
Continued strong job growth suggests that businesses see the weakness in the past two quarters as temporary. Recent data support a pickup in both consumer spending and exports in the second quarter, and it appears that overall growth in business investment has firmed. That said, inventories rose sharply in the first quarter, which may dampen production growth in coming months.
The global economy is also evolving largely as expected since April, although the recent escalation of trade conflicts is heightening uncertainty about economic prospects. In addition, trade restrictions introduced by China are having direct effects on Canadian exports. In contrast, the removal of steel and aluminum tariffs and increasing prospects for the ratification of CUSMA will have positive implications for Canadian exports and investment.
Inflation has evolved in line with the Bank's April projection. The Bank expects CPI inflation to remain around the 2 per cent target in the coming months. Core inflation measures all remain close to 2 per cent.
Overall, recent data have reinforced Governing Council's view that the slowdown in late 2018 and early 2019 was temporary, although global trade risks have increased. In this context, the degree of accommodation being provided by the current policy interest rate remains appropriate. In taking future policy decisions, Governing Council will remain data dependent and especially attentive to developments in household spending, oil markets and the global trade environment.