Sample Category Title
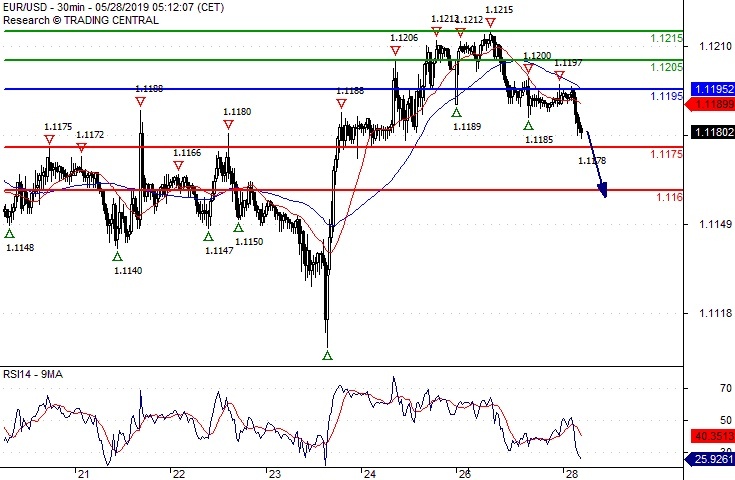
EUR/USD 1.1160 Expected
Pivot (invalidation): 1.1195
Our preference Short positions below 1.1195 with targets at 1.1175 & 1.1160 in extension.
Alternative scenario Above 1.1195 look for further upside with 1.1205 & 1.1215 as targets.
Comment The RSI has broken down its 30 level.
GBPUSD Bears Remain Into Play Around 4½-Month Low
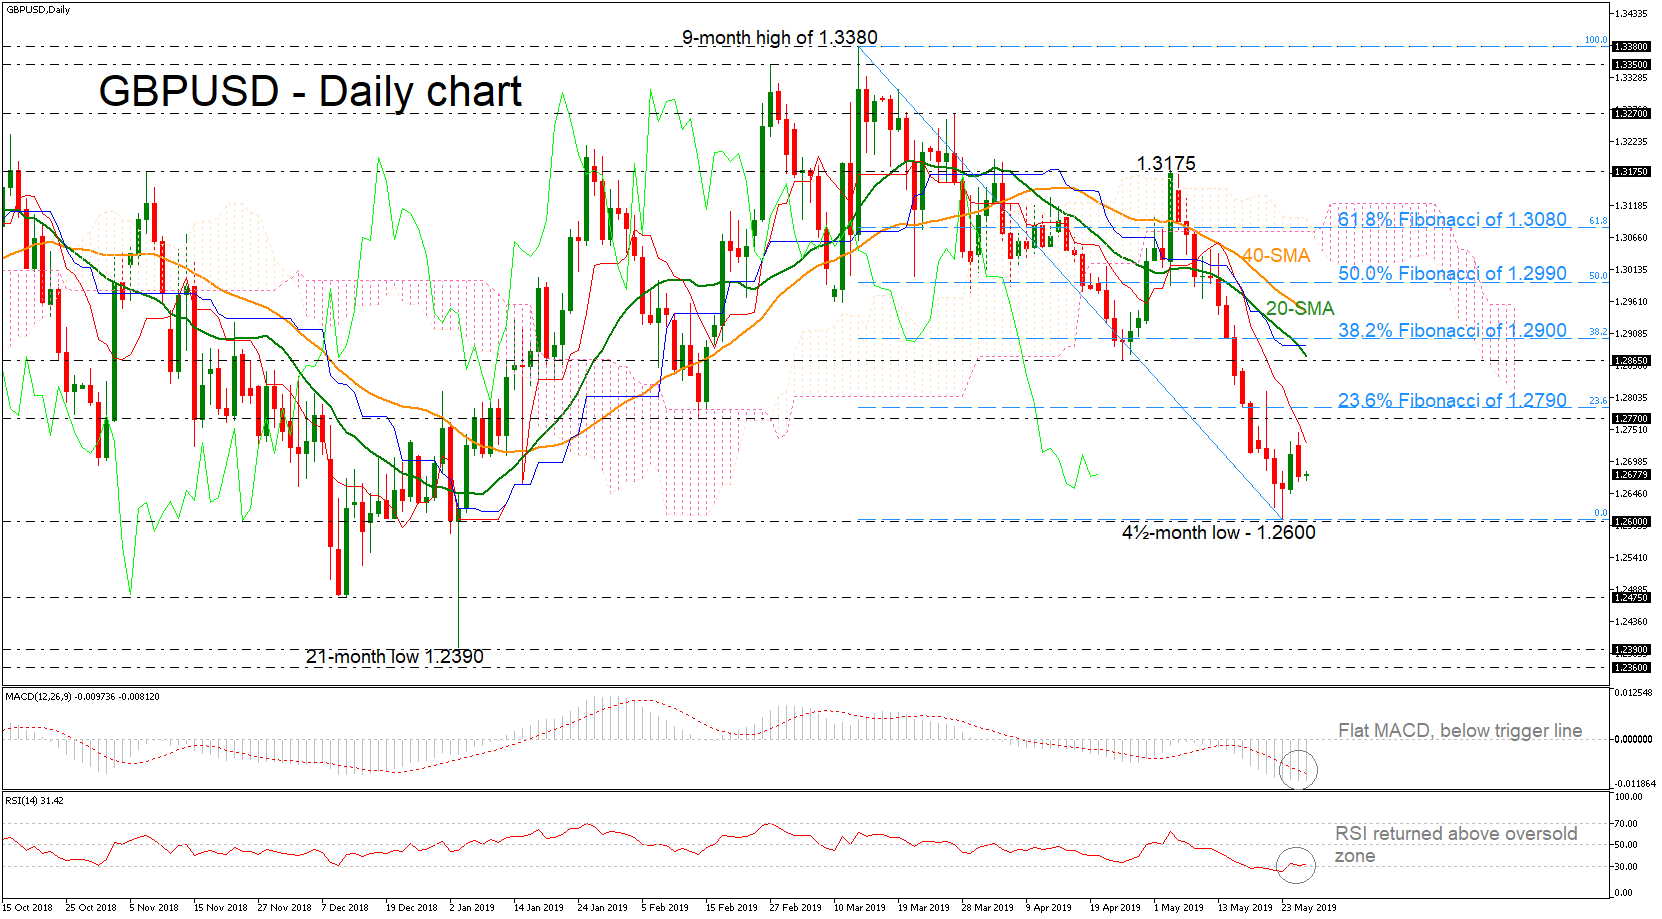
GBPUSD is remaining under pressure during this month and it completed a fresh four-and-a-half-month low around 1.2600 in the preceding week. Currently, the pair has been holding beneath the red Tenkan-sen line as well as below the 23.6% Fibonacci retracement level of the downfall from 1.3380 to 1.2600, near 1.2790, suggesting more losses in the market.
However, turning attention to the technical indicators, the RSI seems to be overstretched as it returned above the overbought zone but is still flattening in negative territory. The MACD is moving sideways below its red trigger and zero lines.
If prices continue to edge sharply lower, support should come from the multi-month low of 1.2600, while a successful penetration of this level could reinforce the short-term strong downward movement and open the way towards the 1.2475 hurdle.
On the other side, should an upside correction take place, immediate resistance could be faced near the 1.2770 barrier and the 23.6% Fibonacci near 1.2790. If there is a break above this significant area, the price could jump towards 1.2865, which coincides with the 20-day simple moving average (SMA).
Concluding, the decline beneath the 1.3175 obstacle has endorsed the bearish run in the short-term and traders can now turn their focus to critical levels to the downside.
Gold Prices Drift Amid Lack Of Catalysts
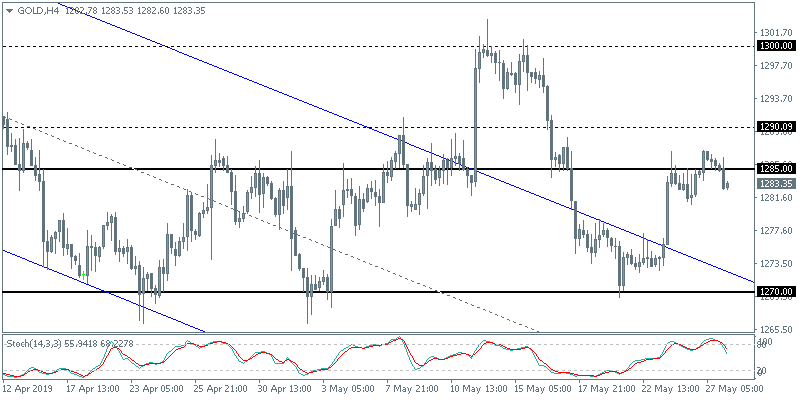
Gold prices were muted on Monday, despite price initially attempting to test intraday highs. With the US and UK markets closed and economic data from the EU staying sparse, the precious metal was seen giving up the gains by the day’s close. Gold prices advanced a meager 0.02% on the day.
XAUUSD Retreats as a Reversal Pattern Emerges
The precious metal was seen reversing gains but a lot is left to be seen how price action unfolds during the day. A bearish close following Monday’s Doji candlestick pattern could suggest some near term downside in price. The lower support at 1270 will once again become critical for gold. The evolving head and shoulders pattern remains in play still and could be validated on a break down below 1270 support.
Crude Oil Holds As Russia Oil Production Hits A Snag
Crude oil prices managed to hold on the gains, albeit near two-month lows. Production data showed that Russian crude oil was lower in May. This was primarily due to oil contamination in one of the pipelines. As part of the production cuts, Russia is expected to cut production by 230,000 bpd.
WTI Crude Oil Likely to Target $60
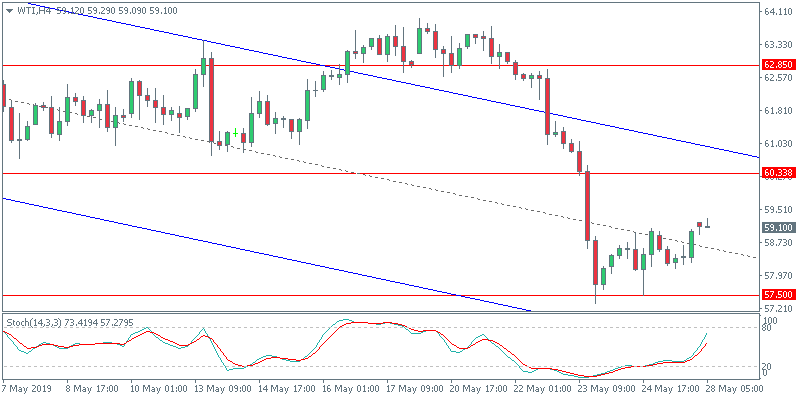
The current consolidation in oil prices has led to price action posting a potential ascending triangle pattern. With the resistance level at 58.98, a breakout above this level could push oil prices further. The initial target is seen at the 60.33 handle. Retesting this level to form resistance could potentially cap further gains. This will keep oil prices ranging within 60.33 and 57.50 levels in the near term.
Euro Muted To EU Parliament Results
The euro currency was muted as results poured in from the weekend EU wide parliamentary elections. Although populist and anti-EU parties made further inroads, the support was still lower than anticipated. This led to the European equity indexes closing higher on the day. Economic data was subdued even in the Eurozone.
EURUSD Retreats After a Two-Day Gain
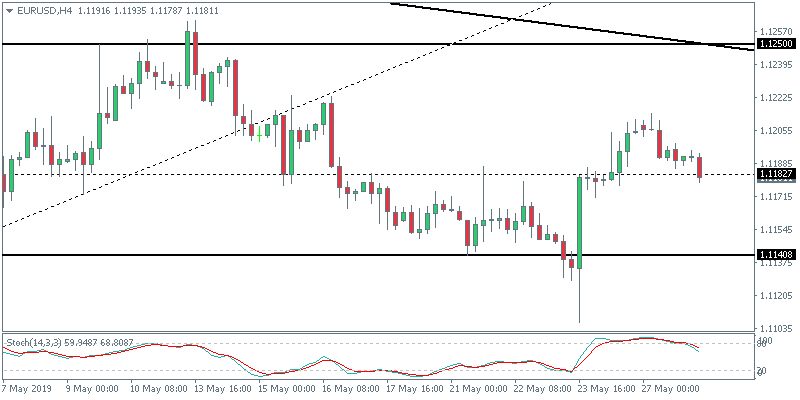
The common currency was seen extending declines in the early hours today. This follows a bearish close on Monday which comes after a solid rebound in the currency pair. The euro pared losses as it reversed off lows near 1.1106 last Thursday. Price is seen testing the support at 1.1182. A break down below this level could see the euro retesting the previous lows.
EURUSD 1.1165 Upcoming Support
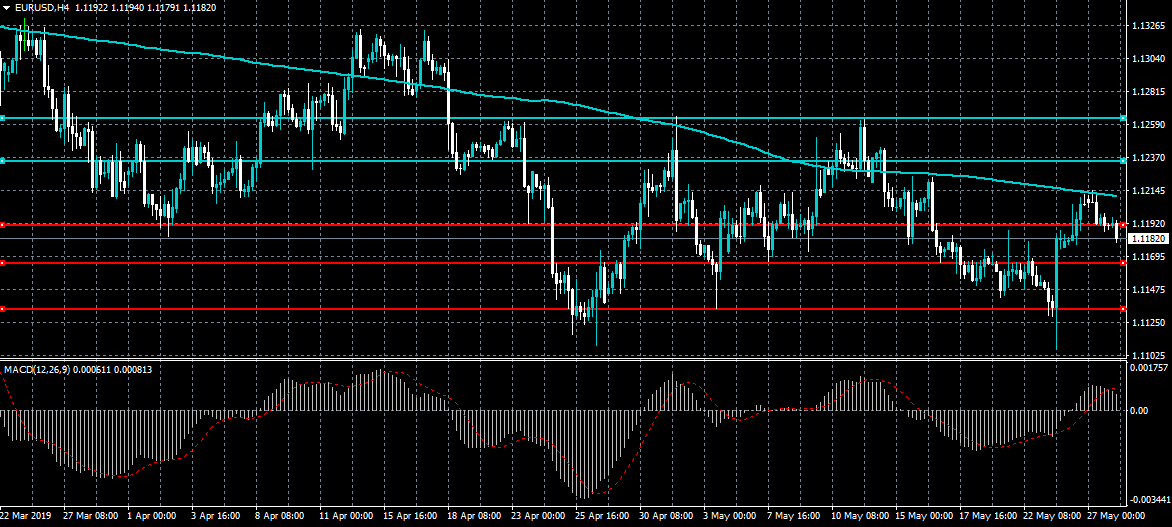
The euro is starting to retrace recent gains against the US dollar following renewed financial market fears about the Italian economy. Sustained weakness below the 1.1190 level will likely prompt a further technical test of the important 1.1165 support level. Overall, weaker than expected economic data coming from the United States economy is needed to boost the EURUSD pair higher.
The EURUSD pair is only bullish while trading above the 1.1190 level, key technical resistance is found at the 1.1235 and 1.1265 levels.
If the EURUSD pair trades below the 1.1190 level, key technical support is found at the 1.1165 and 1.1135 levels.
BTCUSD $9,000 Now Key Resistance
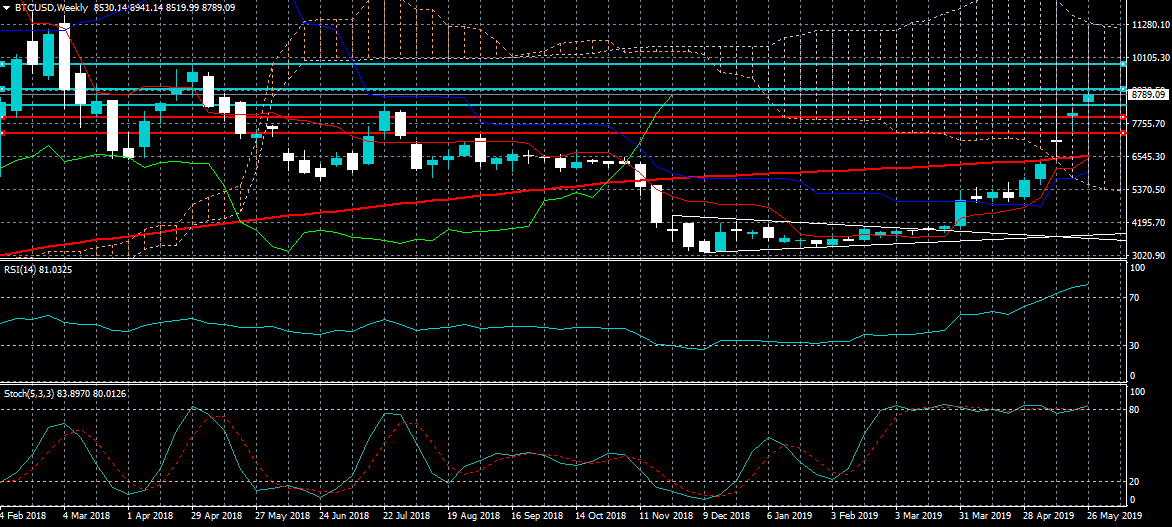
Bitcoin remains well supported above the $8,700 level after the number one cryptocurrency found interim technical resistance from just below the $9,000 level on Monday. If bulls can break above the $9,000 level the BTCUSD pair offers only limited technical resistance until the $9,600 level. To the downside, a break below the $8,500 level may expose another test of the $8,300 support level.
The BTCUSD pair is heavily bullish while trading above the $9,000 level, key resistance is found at the $9,600 and $10,000 levels.
If the BTCUSD pair trades under the $8,700 level, sellers may test towards the $8,300 and $8,000 support levels.
GBP/JPY Daily Outlook
Daily Pivots: (S1) 138.50; (P) 139.08; (R1) 139.46; More...
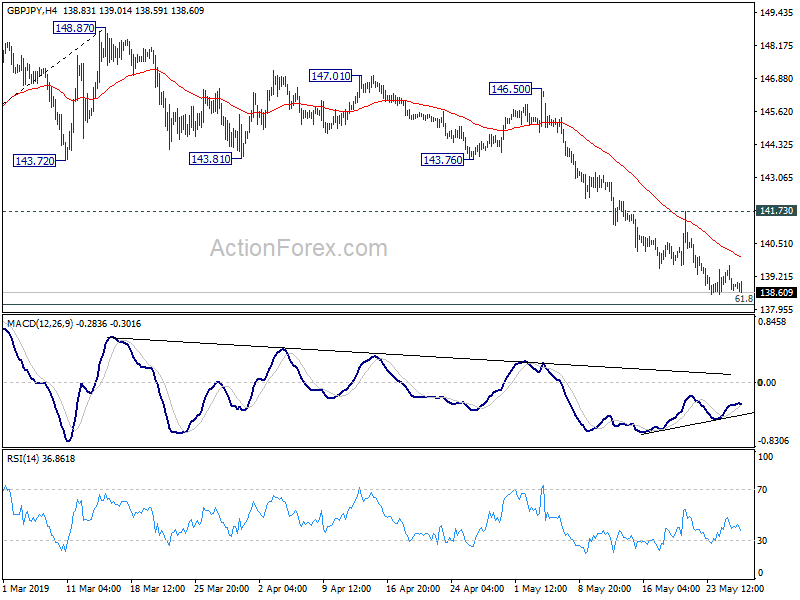
GBP/JPY is losing downside momentum ahead of 61.8% retracement of 131.51 to 148.87 at 138.14. But recovery is so far weak. And, with 141.73 resistance intact, further decline is expected. On the downside, sustained break of 138.14 will extend the fall from 148.87 top retest 131.51 low.
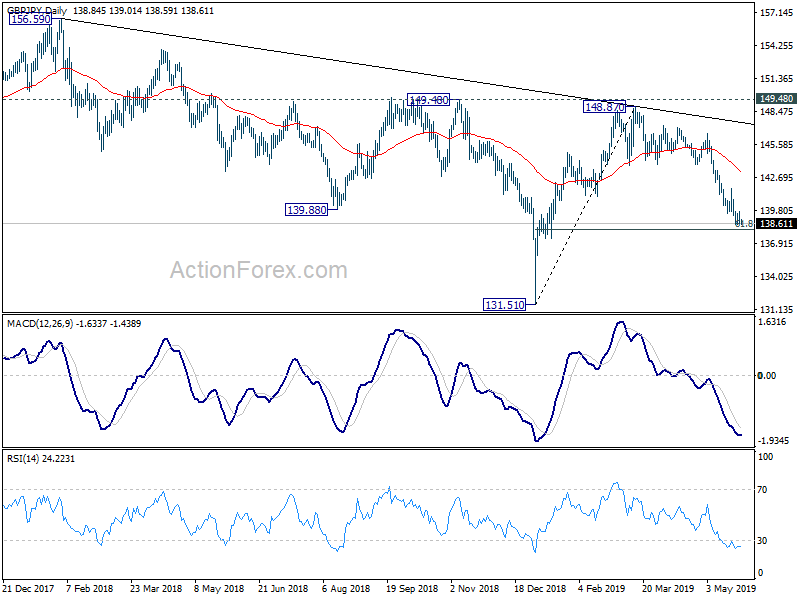
In the bigger picture, current development suggests that GBP/JPY was rejected by 149.98 key resistance. And medium term fall from 156.59 is still in progress. Break of 131.51 will target 122.36 (2016 low). On the other hand, decisive break of 149.98 should confirm that medium term fall from 156.59 (2018 high) has completed at 131.51 already. Further rally would be seen back to 156.59 resistance and above.
GBPUSD Recovery Still Possible
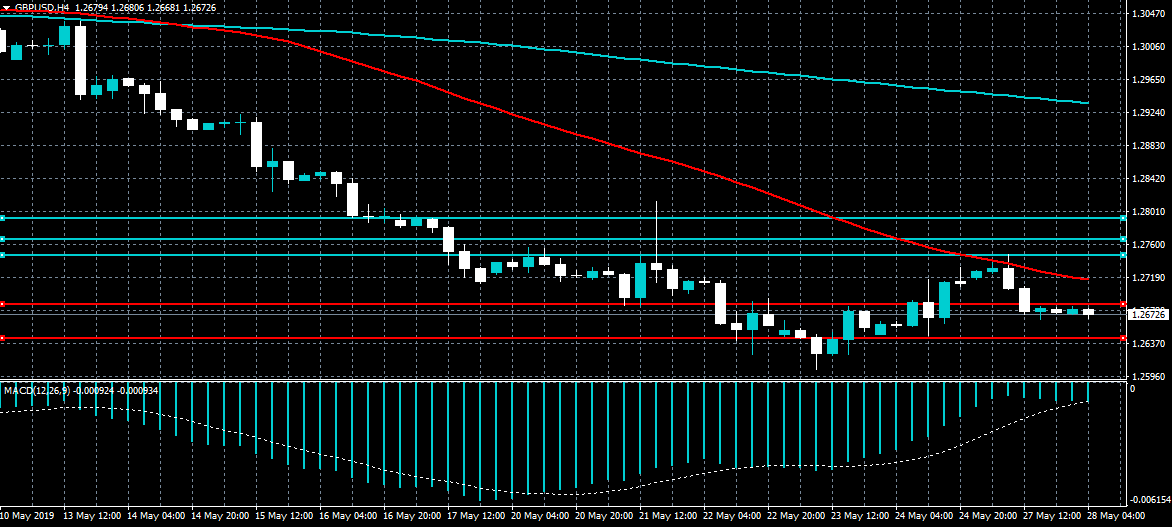
The British pound remains under slight downside pressure against the greenback in early Tuesday trade after the pair fell well below the 1.2700 level. If GBPUSD bulls can stabilize price above the 1.2679 support level the pair could eventually recover towards the 1.2765 resistance level. Continued weakness below the 1.2679 level may prompt a technical test of the 1.2640 price region.
The GBPUSD pair is only bearish while trading below the 1.2700 level, key support is located at the 1.2679 and 1.2640 levels.
If the GBPUSD pair holds above the 1.2700 level, key intraday resistance is found at the 1.2747 and 1.2765 levels.
EURO Falls As France And Germany Clash Over Next EU Leaders
The price of crude oil jumped yesterday as traders looked ahead to the upcoming OPEC meeting, which will be held in June. After the recent sell-off, investors believe that OPEC will cut supplies or retain the current production levels to avoid further declines in price. In recent weeks, the price of crude has dropped sharply as investors worried about the impact of the trade war and increasing US production.
The euro declined in overnight trading after the results of the European elections. This happened as France and Germany clashed over the leader of the Union. Nationalist, liberals, and green parties across the EU gained seats at the expense of centrists like Merkel’s CDU. In a statement yesterday, Emmanuel Macron said that the European Commission should have a ‘president candidate who can build a robust majority way beyond partisan lines.’ This was meant to alienate Manfred Weber, who has been backed by Germany. Pascal Canfin said that Weber was ‘totally disqualified today’ following the elections. In the coming days, the bickering will continue as the different countries decide on the future leadership of the region. Today, traders will receive the Germany import data and the sentiment survey results.
Sterling was relatively unchanged in the Asian session. This is as traders think about who the next Prime Minister will be. Most investors expect that Boris Johnson, the former London Mayor and Foreign Secretary will take the lead. If he does, they expect that it will raise the chances of a no-deal Brexit. In the past, he has said that he did not see an issue with the country leaving Europe without a deal. A report by the BOE a few months ago that leaving without a deal would lead to a 9% decline in the country’s GDP.
EUR/USD
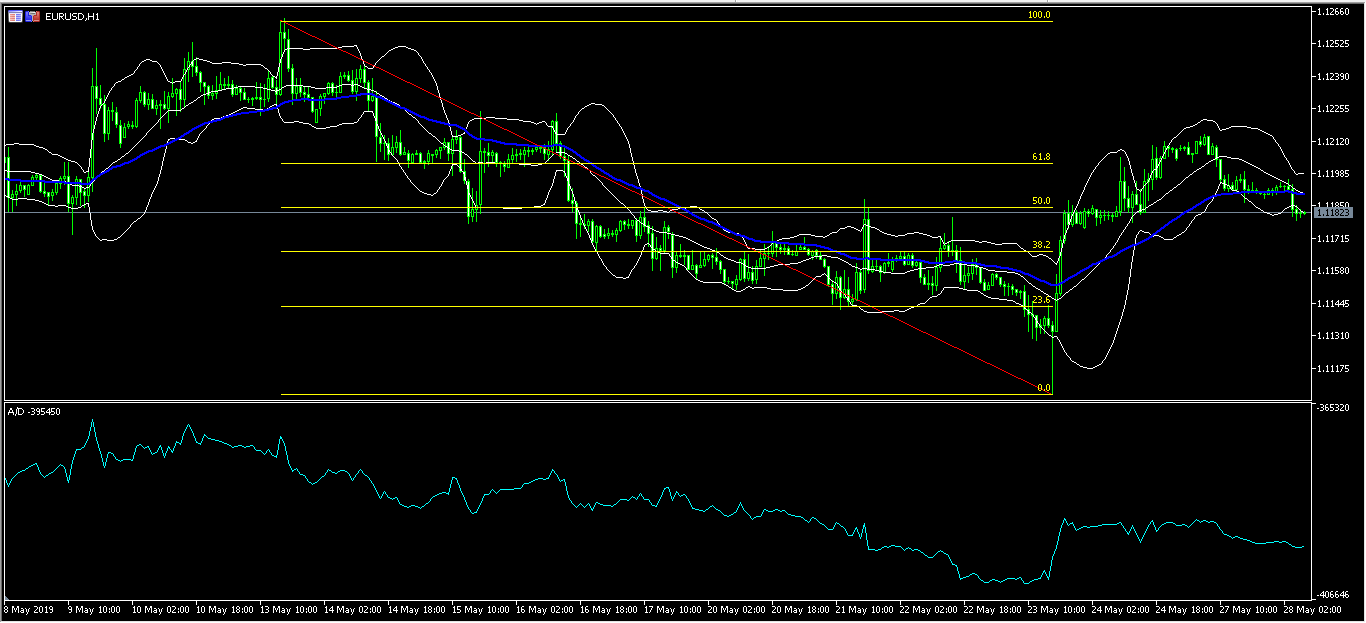
The EUR/USD pair declined slightly as conflicts happened about the future leaders of the European Union. The pair is now trading at 1.1182, which was along the 50% Fibonacci Retracement level. On the chart below, this price is along the lower line of the Bollinger Bands while the accumulation/distribution indicator has been falling. The pair will likely retest the 38.2% Fibonacci level of 1.1160 and then resume the upward trend.
GBP/USD
The GBP/USD pair was relatively unmoved as traders continued to think about the next Prime Minister. The pair is now trading at 1.2670 level. On the six-hour chart, the price appears to be headed to the previous low of 1.2600. It is also slightly below the 50-day and 25-day moving averages. If the price retests the previous low, it may accelerate the downward trend to test the next support of 1.2550.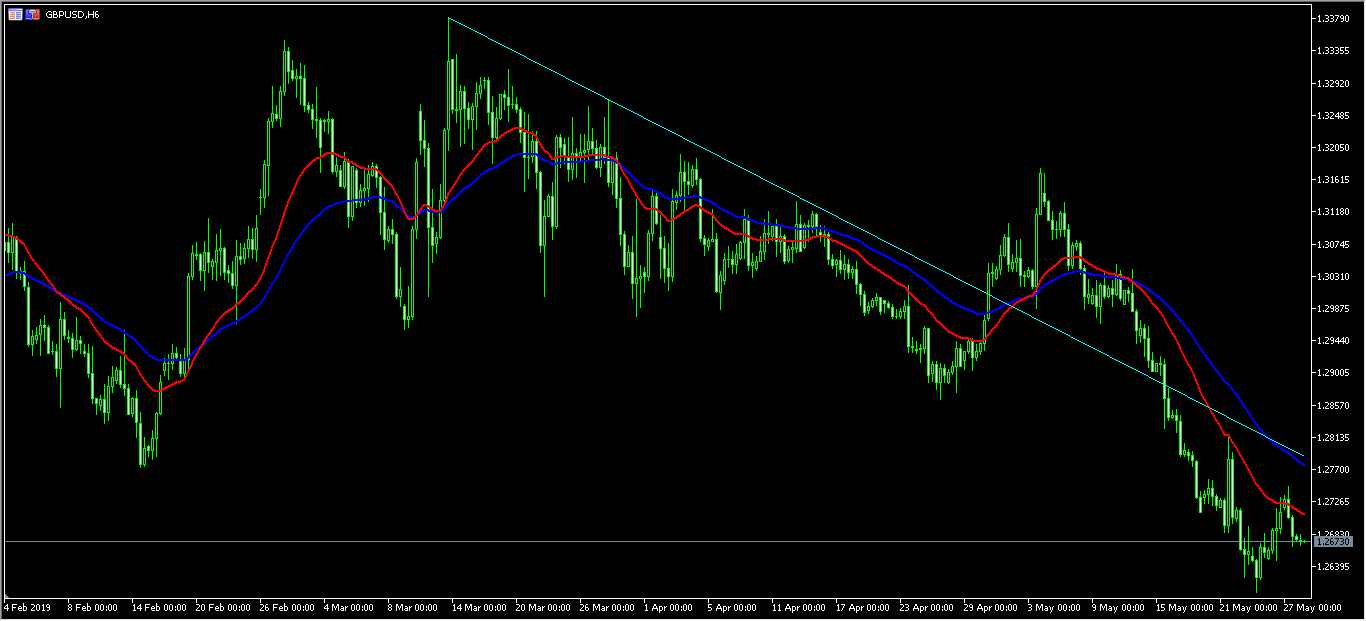
XTI/USD
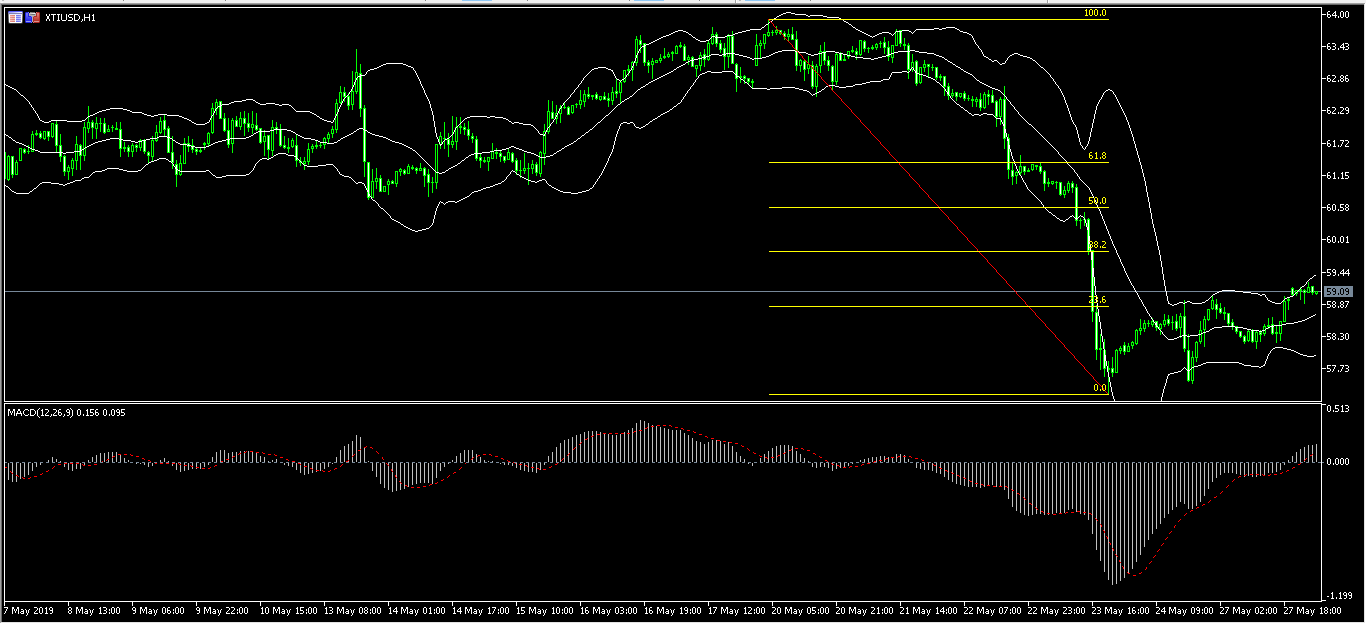
Yesterday, the price of WTI crude rose sharply as traders focused on the next actions by OPEC. In the Asian session, the XTI/USD pair was relatively unmoved. On the hourly chart below, the pair is trading at 59.08, which is slightly above the 23.6% Fibonacci Retracement level. The price is along the upper line of the Bollinger Bands while the signal line of the MACD is moving up. The pair will likely test the 38.2% Fibonacci level of 59.80.