

Sample Category Title
USD/JPY Analysis: Two Scenarios Likely
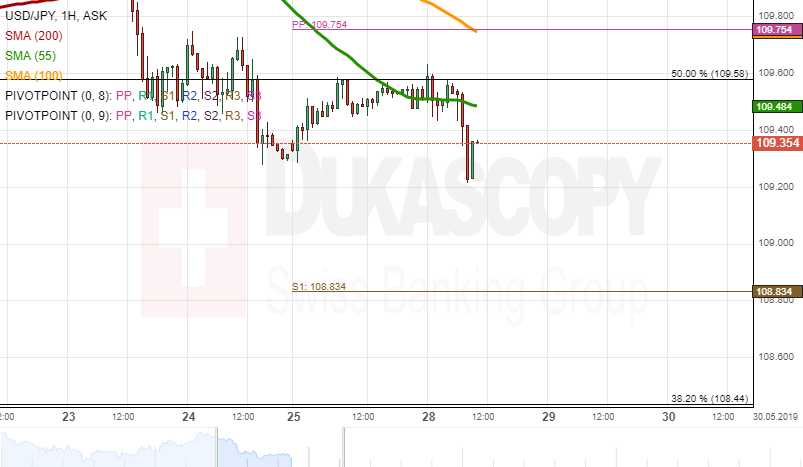
During the previous trading session, the USD/JPY currency pair tried to surpass the resistance level formed by the 55-hour SMA and the Fibonacci 50.00% retracement at 109.58.
During Tuesday's morning, the pair reversed south. It is likely, that some downside potential could prevail in the market. However, note, that the exchange rate has to surpass the monthly S3 at the 109.12 mark.
If the given support level holds, it is expected, that a reversal north could occur within the following trading hours. Otherwise, the pair could decline to the psychological level at 109.00.
Swiss GDP Accelerates, EUR Relief Over
Swiss GDP growth accelerates in the first quarter
Despite the tense situation on the international stage, the latest batch of economic data from Switzerland surprised to the upside. However, the Swiss franc failed to catch any bid as it traded sideways against the greenback around 1.0040. Even the victory of nationalist at the European elections did allow the Swissy to gain ground against the single currency as EUR/CHF remained above the 1.12 threshold.
The Swiss GDP rose by 0.6% in the March quarter, beating widely economists’ estimates of 0.3%q/q. Over the last 12 month, the economy grew 1.7%, also topping median forecast of 1% and upwardly revised figures of 1.5% previously. The acceleration of household consumption together with a pick-up in investments explain mostly this good reading. Household consumption increased by 0.4%q/q, compared to 0.3% in the previous one, while investment in capital goods surged by 1.5%q/q versus a contraction of 0.1% in the December quarter.
Despite mediocre trade data for the month of April – exports contracted by 0.6%m/m while imports rose by 1.5% - figures remained good for the first quarter as exports of goods rose 2.2%q/q (+5.8% previously), while service exports hit 1.7%q/q (+0.6% in 4Q 2018). Overall, the report showed that the Swiss did quite well, especially against the backdrop of escalating trade tensions between the US and China. Nevertheless, we believe that 2019 will be a challenging year for the Swiss economy. The latest European elections showed that the cohesion between countries continues to fall apart, which does not bode well for business. Being an outward-looking nation - i.e. highly dependent on international flow, especially with the Union – Switzerland could only suffer from this situation. Consequently, we wouldn’t be surprise to see renewed interest for safe-haven currencies such as the Swiss franc and the Japanese yen as the geopolitical uncertainty continues to rise.
EUR relief over, focus on Italian debt
The recent release of European elections results, although mostly feared by most investors, finally came in better than expected. Despite a loss of majority in the center-left and center-right coalition, it appears that anti-establishment parties’ gains came lower than anticipated while the greens and liberals also progressed, a rather good news for the single currency. Yet now that headlines are digested, it seems that investors are turning towards longer-term issues, including risk on Italian government debt, growth concerns, Brexit or potential US – EU trade war.
The EU budget monitoring process occurring along 5 June 2019 should see the Commission implementing the excessive deficit procedure against Italy as the assessment is likely to conclude that current structural deficit spending is approaching the 2.40% range instead of targeted 2% for this year and reach 3.60% by 2020 with current policy actions. Italy, the second largest debt-to-gdp bearing country within the EU after Greece could face fines that could reach as much as 0.20% of GDP, pushing interest-bearing costs higher amid rising bankruptcy risk. However, the timing of such an announcement might cause turmoil within EU parliament, as populist, eurosceptic parties could possibly hinder the period of distribution of executive powers, in a time where EU unity is essential.
Under current circumstances, we see little upside potential for the EUR, as ECB meeting is taking place on 6 June 2019. Currently trading at 1.1193, EUR/USD is heading along 1.1180 short-term
EUR/JPY Analysis: Passes 50-Hour SMA
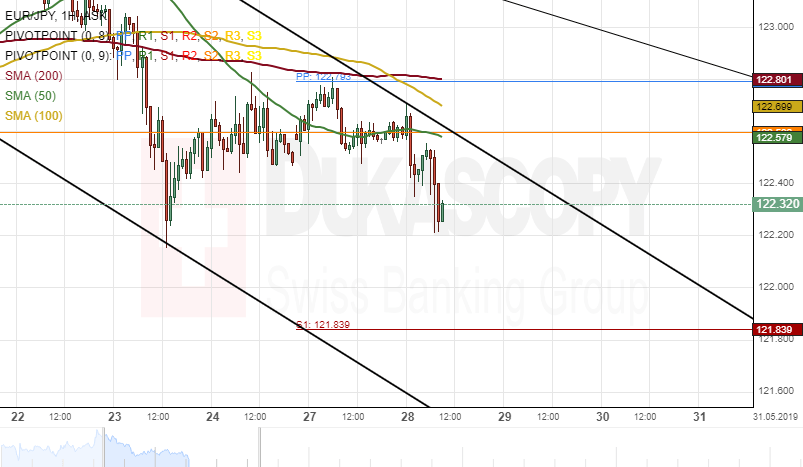
The common European currency traded sideways movement against the Japanese Yen on Monday. The 50-hour simple moving average provided support for the currency pair during yesterday's trading session.
However, today's trading session began with the bearish sentiment, and by the middle of the trading hours, the exchange rate has dashed through the support level formed by the 50-hour SMA.
Most likely, the currency exchange rate will continue its downward swing within this session. The potential target for bearish traders will be near a support level formed by the weekly S1 at 121.83.
USD/CAD Analysis: Stranded Between Fibonacci Levels
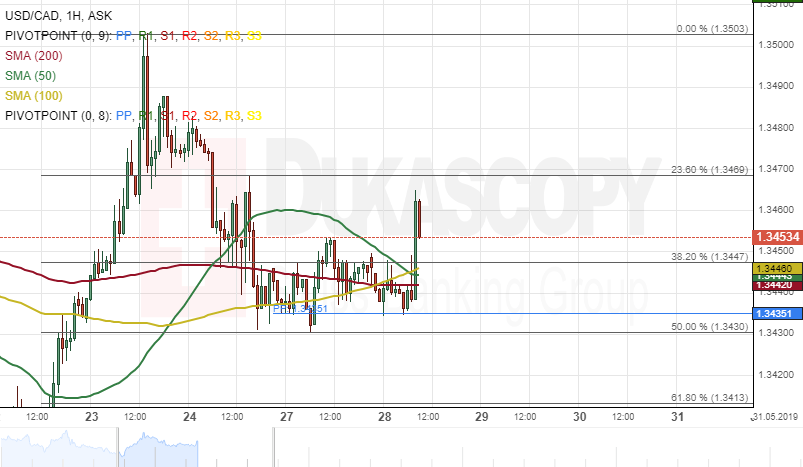
The US Dollar was stranded between the 38.2% and the 50.00% Fibonacci retracement level against the Canadian Dollar on Monday. As apparent on the 1(H) chart, the currency pair traded sideways movement during yesterday's trading session.
As for the nearest future, it is likely that the exchange rate will continue to move sideways today. A resistance cluster formed by the 50-, 100– and 200-hour SMAs could provide resistance for the pair.
However, if the USD/CAD currency exchange rate passes the resistance cluster, a surge towards the 1.3503 marks could be expected during the following trading session.
AUD/USD Analysis: Likely To Maintain Channel
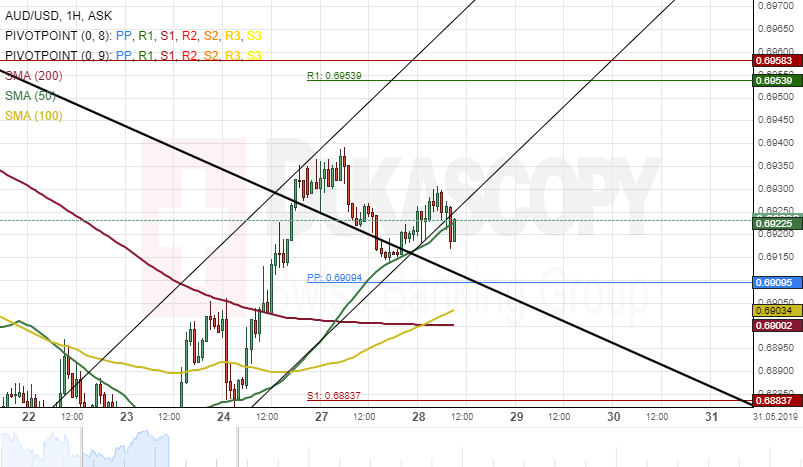
The Australian Dollar was guided up by a junior ascending channel pattern against the US Dollar during yesterday's trading session. The currency pair tested a swing high of 0.6940 on Monday.
By and large, it is likely that the AUD/USD currency pair will maintain the junior ascending channel pattern within this session. If the channel holds, the rate will aim for a resistance cluster formed by the combination of the weekly and the monthly pivot points at 0.6959 today.
However, if the currency exchange rate breaks the channel pattern, a decline towards the 100– and 200-hour SMAs at 0.6902 could follow.
NZD/USD Analysis: Sets For Breakout
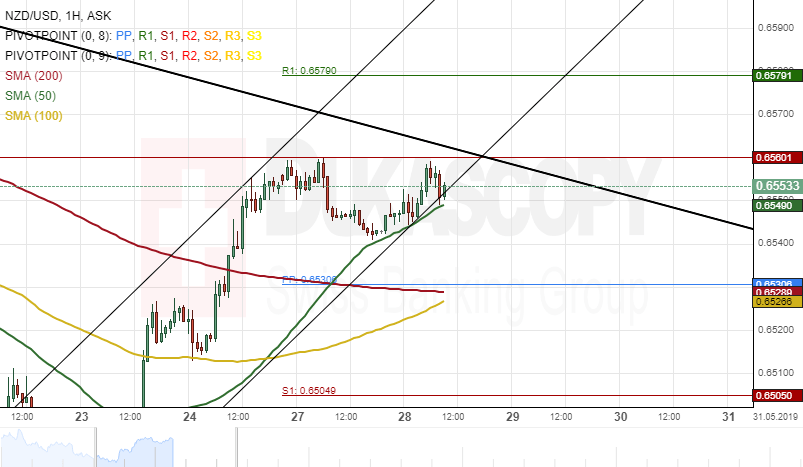
A junior ascending channel pattern guided the New Zealand higher against the US Dollar on Monday. The currency pair tested the monthly pivot point at 0.6560 during yesterday's trading session.
The exchange rate was trading near the upper boundary of a medium-term descending channel pattern at 0.6554 and could be set for a breakout.
If this breakout occurs, a surge towards a mini swing high at 0.6579 might happen within this session.
However, if the resistance level formed by the upper boundary of the descending channel holds, the pair could aim for the 0.6520 area today.
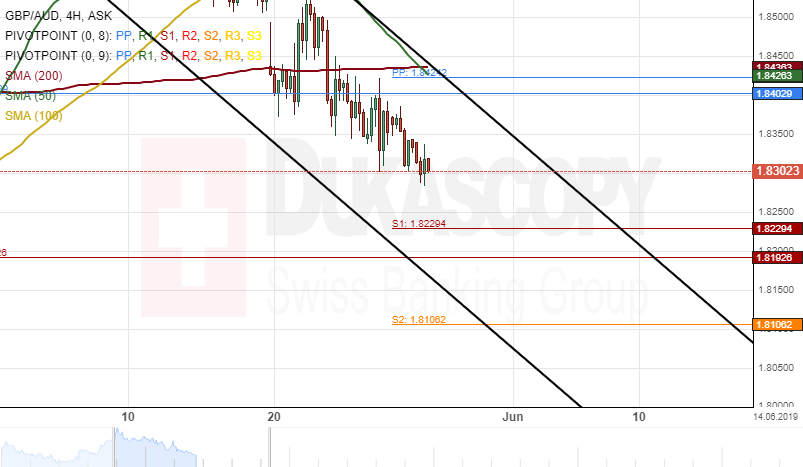
GBP/AUD 4H Chart: Decline Is Likely To Continue
The GBP/AUD currency pair made a U-turn south from the upper boundary of a junior descending channel pattern at 1.8865 on May 6.
As shown on the 4(H) chart, the 50-, 100– and 200-hour simple moving averages are above the price level. Therefore, it is likely that the British Pound could continue its decline against the Australian Dollar in the short-term. The exchange rate might aim for the weekly and the monthly pivot points at 1.8192 during the following trading sessions.
If the support cluster holds at 1.8192 holds, a reversal north could come into play in the nearest future.
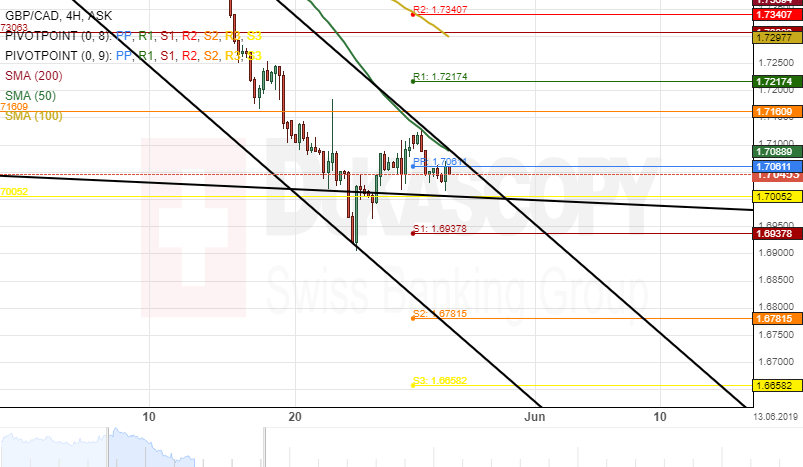
GBP/CAD 4H Chart: Pressure By 50-Hour SMA
The GBP/CAD exchange rate made a pullback from the upper boundary of a junior descending channel pattern at 1.7700 on May 6. The pair were closely guided down by the 50-hour simple moving average.
The currency pair hit a psychological support level at 1.6900 on May 22. The rate made a brief retracement north after reaching the support line as mentioned above. However, the 50-hour SMA provided resistance for the pair at 1.7097.
By and large, if the resistance level formed by the 50-hour SMA holds, the currency exchange rate will continue its southern movement during the following trading sessions.
USD/JPY Outlook: Bears Re-Take Control For Final Attack At Key Support
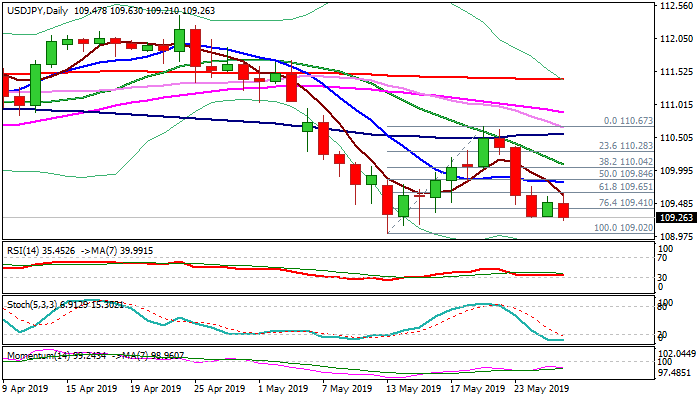
The pair holds in red on Tuesday and pressures lows of past two days (109.27) maintaining bearish near-term bias which was interrupted by brief recovery on Monday.
Bearish daily techs and last Thursday’s long red daily candle (the biggest one day fall since 22 Mar) weigh, keeping in play risk of final push towards key support at 109.01 (13 May low, the lowest since early Jan, violation of which would generate strong signal for continuation of the downtrend from 112.40 (2019 high of 24 Apr).
Broken Fibo support at 109.65 961.8% of 109.02/110.67 bull-leg) caps upside attempts, maintaining downside risk.
Only break here and above 10SMA (109.80) would sideline bears and signal stronger recovery.
Res: 109.65, 109.80, 110.08, 110.36
Sup: 109.21, 109.02, 108.72, 108.50
The Analytical Overview Of The Main Currency Pairs
The EUR/USD currency pair
Technical indicators of the currency pair:
Prev Open: 1.12090
Open: 1.11912
% chg. over the last day: -0.12
Day's range: 1.11784 – 1.11914
52 wk range: 1.1111 – 1.2009
EUR/USD has an ambiguous technical picture. The trading instrument is moving sideways. The local support and resistance levels are 1.11800 and 1.12000. The results of the EU elections brought the pro-EU parties two thirds of the seats. The quotes can recover further, you should open positions from the key levels.
At 17:00 (GMT+3:00) the US will release a customer trust index.
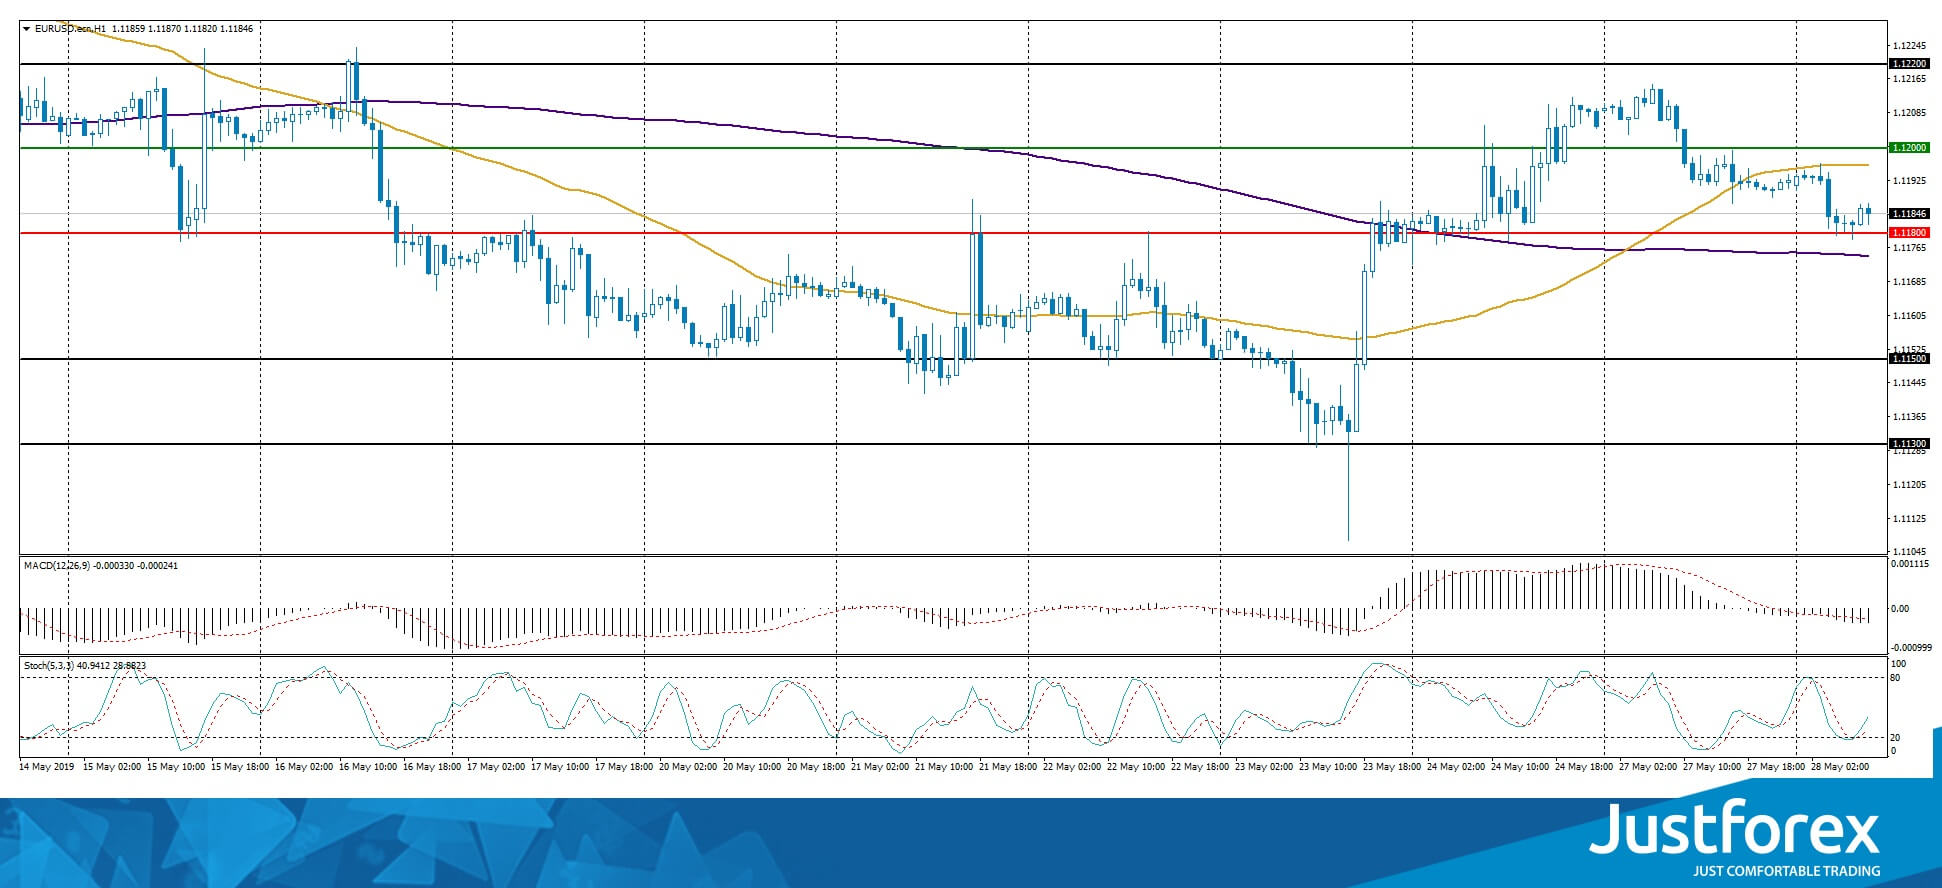
The indicators do not provide precise signals: the price fixed between 50 MA and 200 MA.
The MACD histogram is in the negative zone and below the signal line which gives a strong signal to sell EUR/USD.
The Stochastic Oscillator is in the neutral zone, the %K line is above the %D line which points to the bullish mood.
Trading recommendations
Support levels: 1.11800, 1.11500, 1.11300
Resistance levels: 1.12000, 1.12200, 1.12400
If the price fixes above the round 1.12000, expect further growth towards 1.12200-1.12400.
Alternatively, the quotes can fall towards 1.11600-1.11400.
The GBP/USD currency pair
Technical indicators of the currency pair:
Prev Open: 1.27261
Open: 1.26767
% chg. over the last day: -0.33
Day's range: 1.26636 – 1.27020
52 wk range: 1.2438 – 1.3631
GBP/USD is consolidating. The technical picture is ambiguous. The key support and resistance levels are 1.26500 and 1.27000 respectively. The investors are waiting for additional drivers. The quotes can descend due to the Brexit ambiguousness. Keep an eye on the US news feed and open positions from the key levels.
The Economic News Feed for 28.05.2019 is calm.
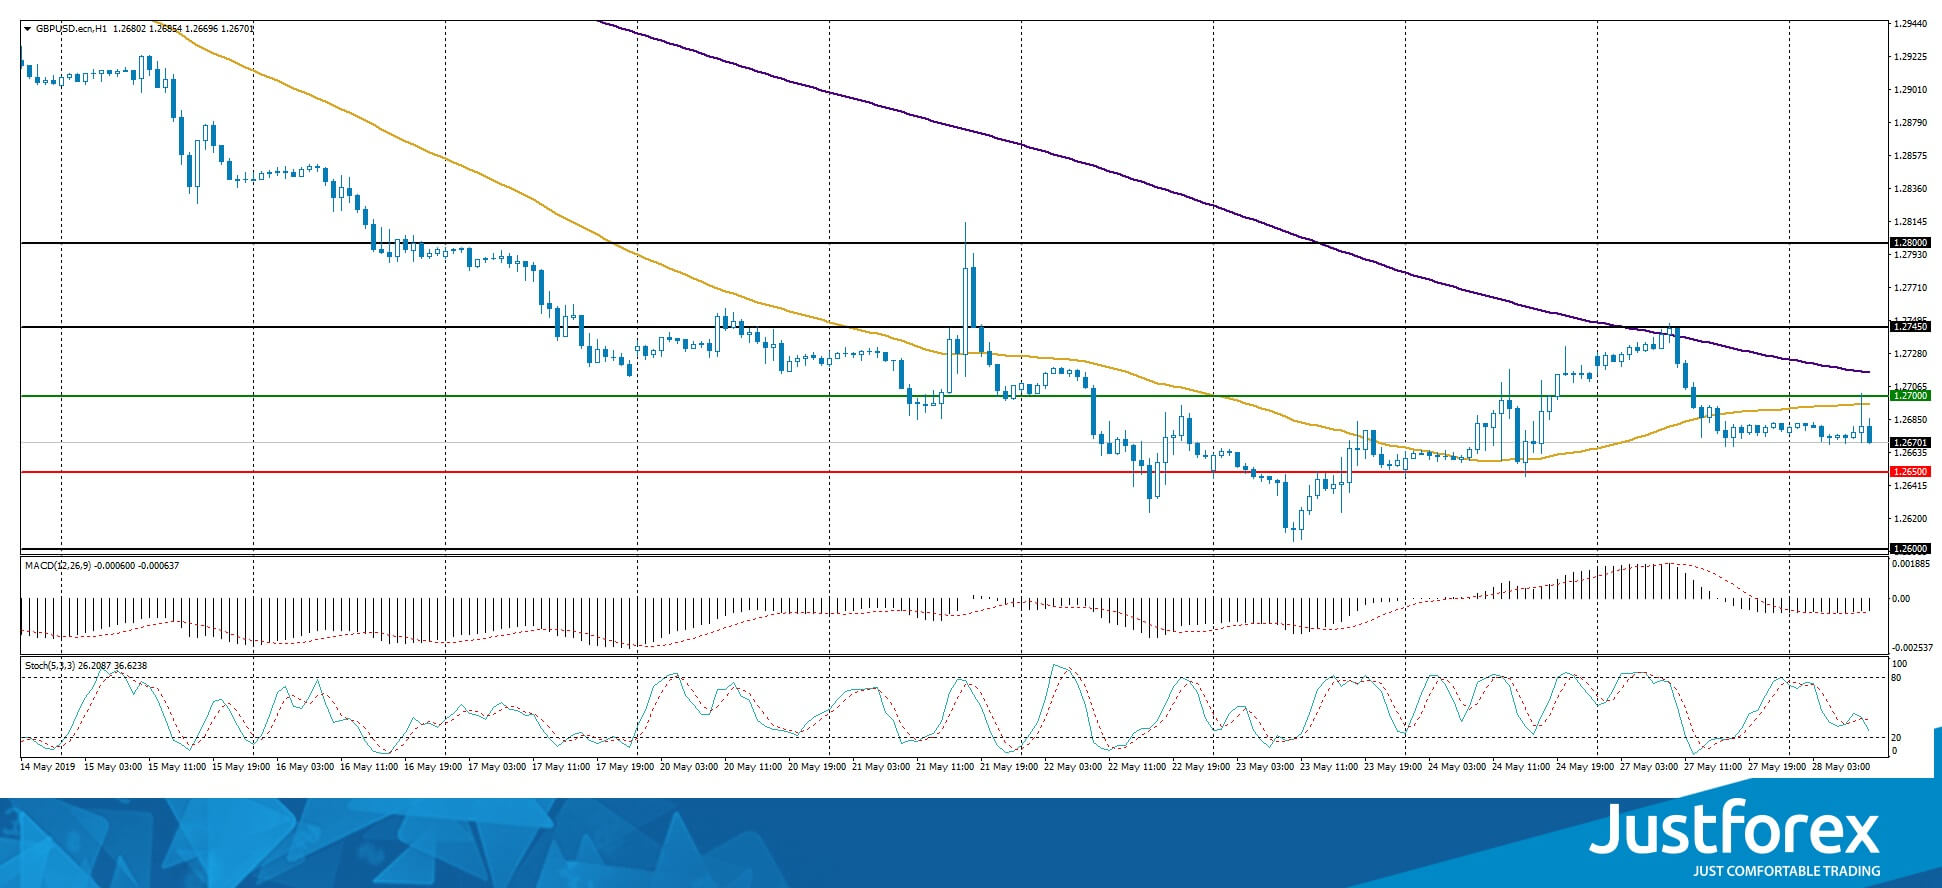
The indicators do not provide precise signals, the price has crossed 50 MA.
The MACD histogram is in the negative zone but above the signal line which provides a strong signal to sell GBP/USD.
The Stochastic Oscillator is in the neutral zone, the %K line is below the %D line which points towards the bearish mood.
Trading recommendations
Support levels: 1.26500, 1.26000
Resistance levels: 1.27000, 1.27450, 1.28000
If the price fixes below 1.26500, expect the quotes to descend towards 1.26200-1.26000.
Alternatively, the quotes may correct towards 1.27400-1.27600.
The USD/CAD currency pair
Technical indicators of the currency pair:
Prev Open: 1.34358
Open: 1.34411
% chg. over the last day: +0.03
Day's range: 1.34355 – 1.34485
52 wk range: 1.2727 – 1.3664
USD/CAD remains ambiguous. The CAD keeps consolidating. The key support and resistance levels are 1.34250 and 1.34500. The trading instrument has a tendency to descend. Keep an eye on the oil quotes and open positions from the key levels.
The Economic News Feed for 28.05.2019 is calm.
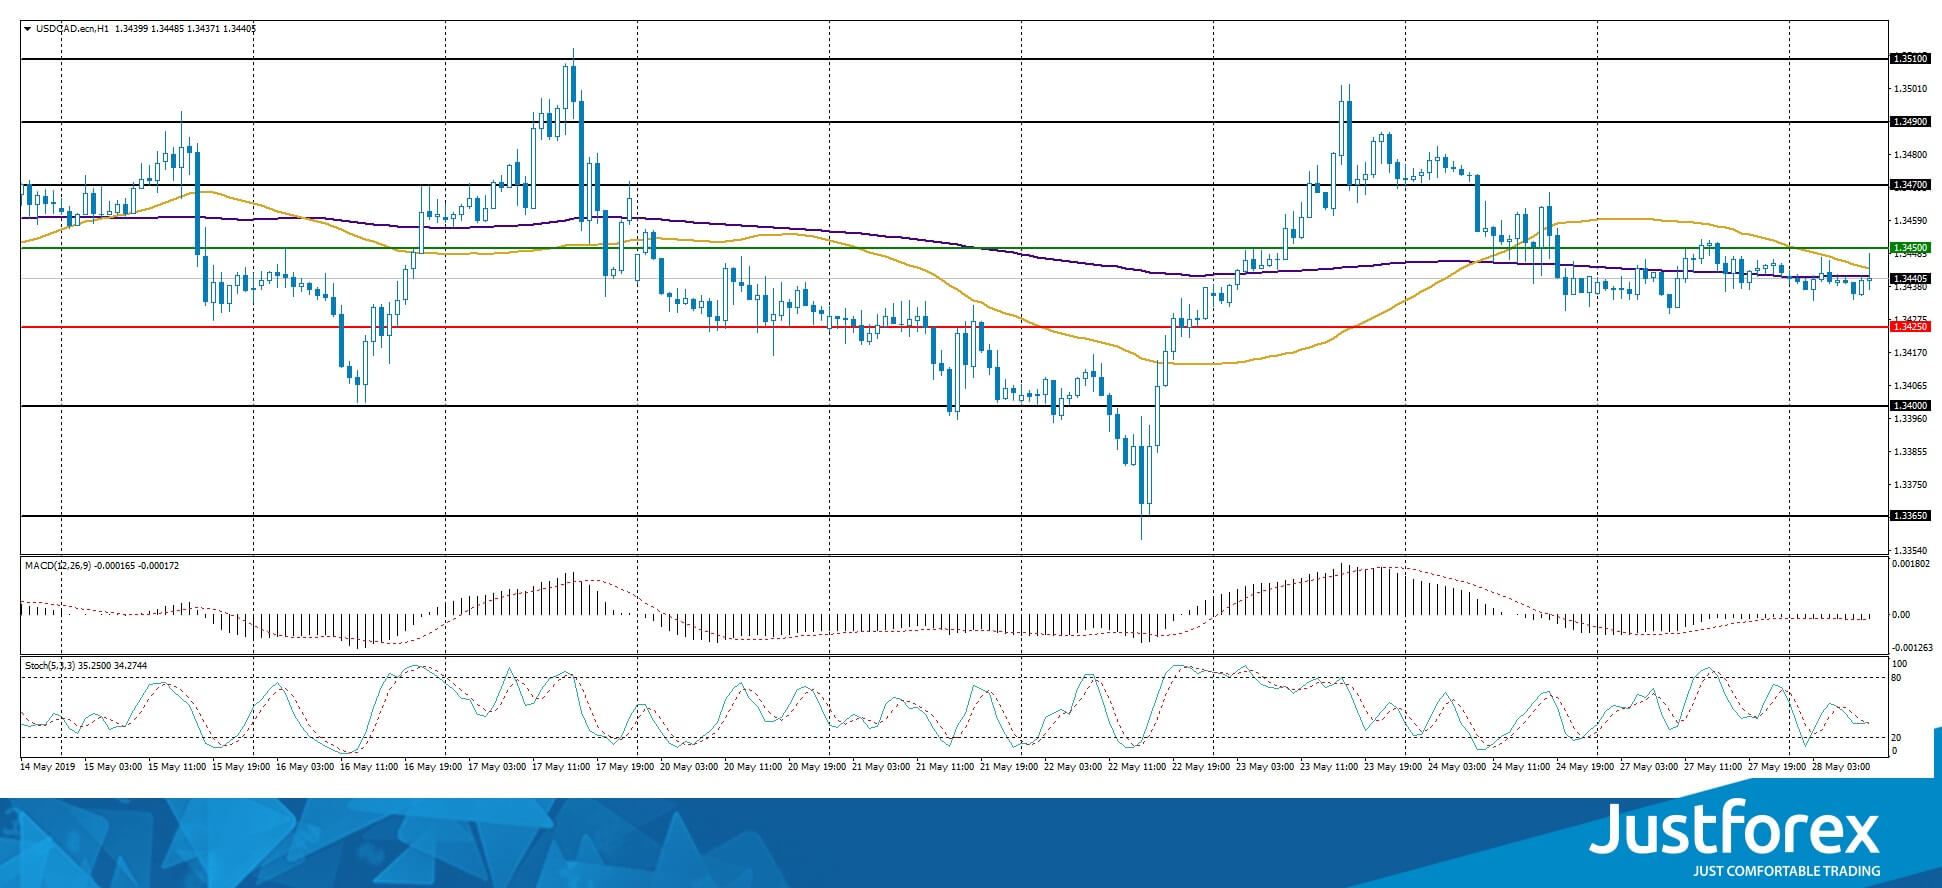
The indicators do not provide precise signals, the price has crossed 50 MA and 200 MA.
The MACD histogram is in the negative zone but above the signal line which provides a strong signal to sell USD/CAD.
The Stochastic Oscillator is in the neutral zone, the %K line has crossed the %D line. There are no signals.
Trading recommendations
Support levels: 1.34250, 1.34000, 1.33650
Resistance levels: 1.34500, 1.34700, 1.34900
If the price descends below 1.34250, expect further descend towards 1.34000-1.33700.
Alternatively, the quotes can grow towards 1.34700-1.35000.
The USD/JPY currency pair
Technical indicators of the currency pair:
Prev Open: 109.285
Open: 109.490
% chg. over the last day: +0.10
Day's range: 109.342 – 109.629
52 wk range: 104.97 – 114.56
USD/JPY keeps consolidating. There is no defined trend. The key support and resistance levels are 109.400 and 109.700. The demand for the safe assets remain relatively high. The quotes have a tendency to descend. Keep an eye on the US Treasury bonds` yield and open positions from the key levels.
The Economic News Feed for 28.05.2019 is calm.
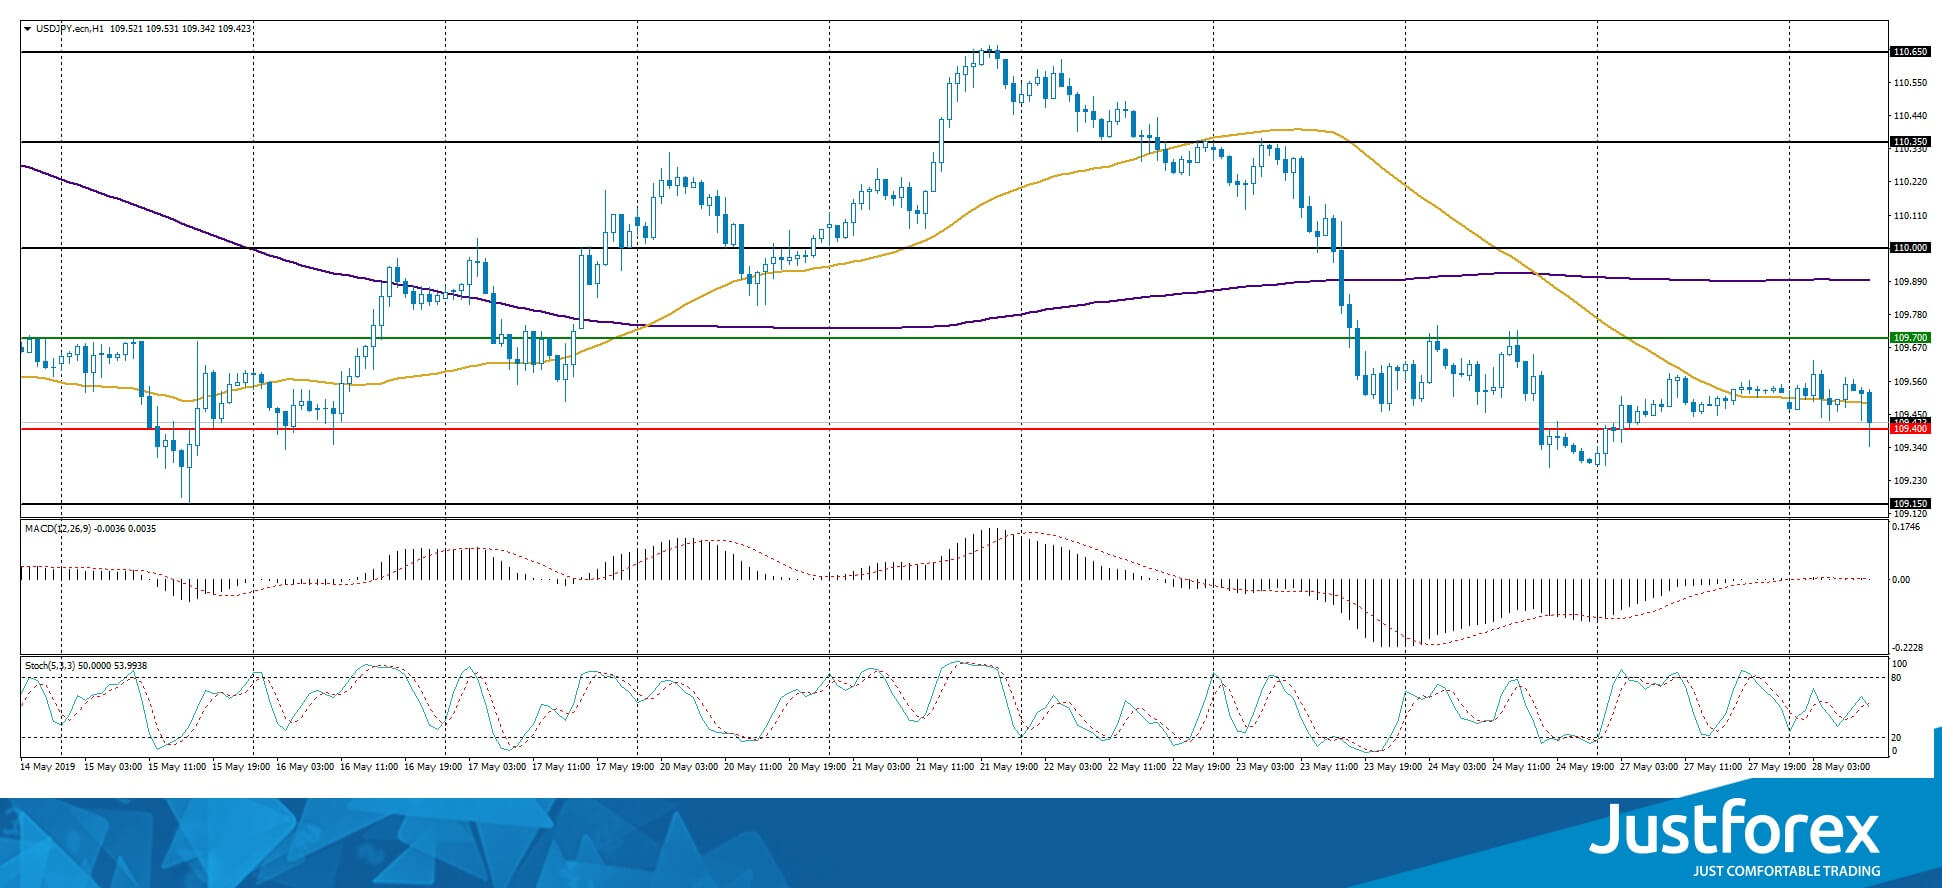
The indicators do not provide signals, the price has crossed 50 MA.
The MACD histogram is close to 0.
The Stochastic Oscillator is in the neutral zone, the %K line has crossed the %D line. There are no signals at the moment.
Trading recommendations
Support levels: 109.400, 109.150, 109.000
Resistance levels: 109.700, 110.000, 110.350
If the price fixes below 109.400, expect further descend towards the round 109.000.
Alternatively, the quotes can grow towards 109.000-110.200.