Sample Category Title
USD/JPY Daily Outlook
Daily Pivots: (S1) 109.17; (P) 109.40; (R1) 109.59; More...
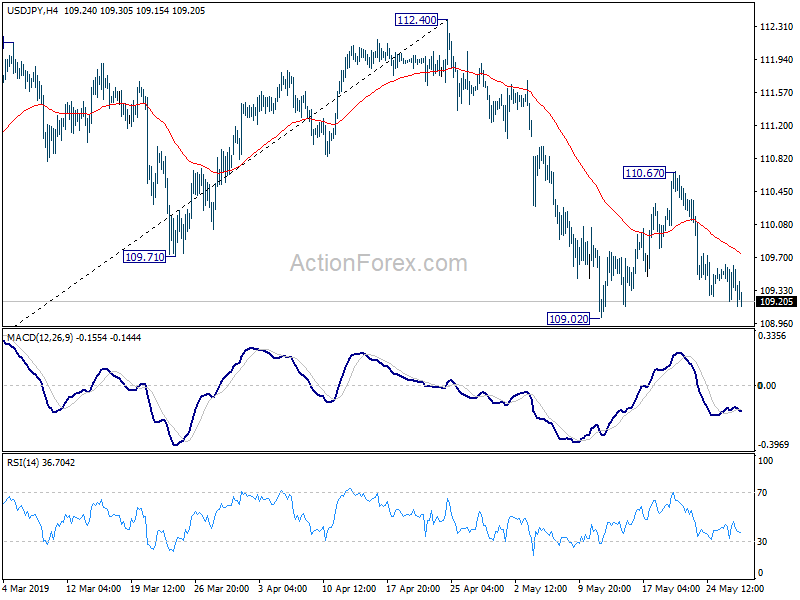
USD/JPY weakens mildly today but stays above 109.02 low. Intraday bias remains neutral and more consolidations could be seen first. In case of another rise upside should be limited below 110.67 resistance to bring fall resumption eventually. On the downside, break of 109.02 will resume the fall from 112.40 and target 61.8% retracement of 104.69 to 112.40 at 107.63 next.
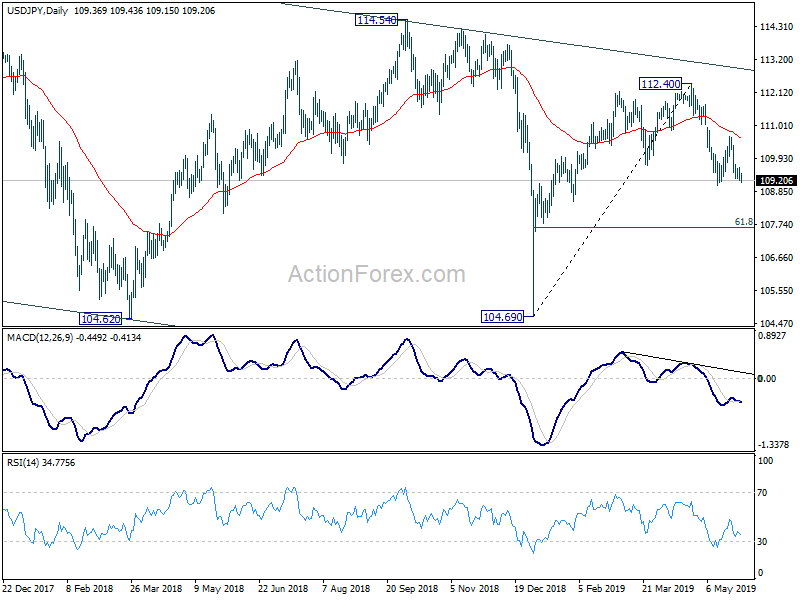
In the bigger picture, USD/JPY is staying inside falling channel from 118.65. Current development suggests that rebound from 104.69 is only a corrective move. And fall from 118.65 is not completed yet. Decisive break of 104.69 will extend the down trend towards 98.97 support (2016 low). For now, we'd expect strong support above there to bring rebound.
GBP/JPY Daily Outlook
Daily Pivots: (S1) 138.09; (P) 138.56; (R1) 138.83; More...
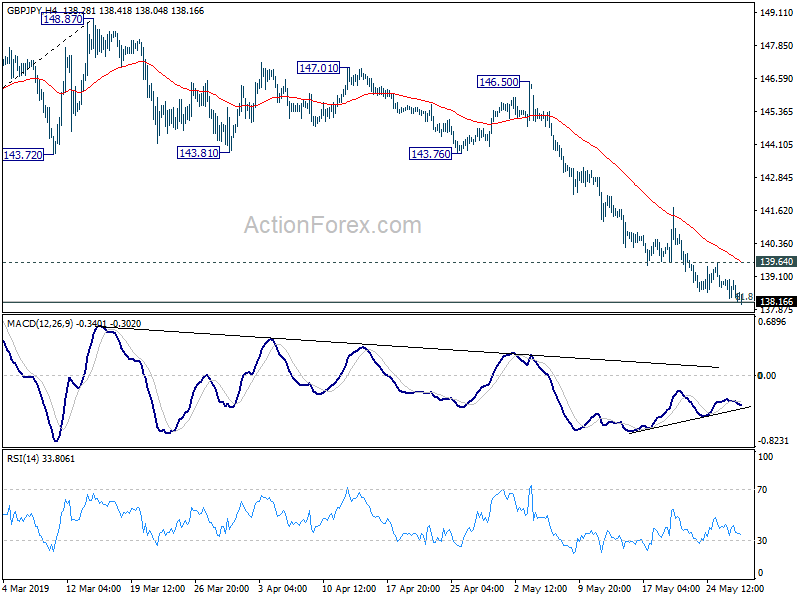
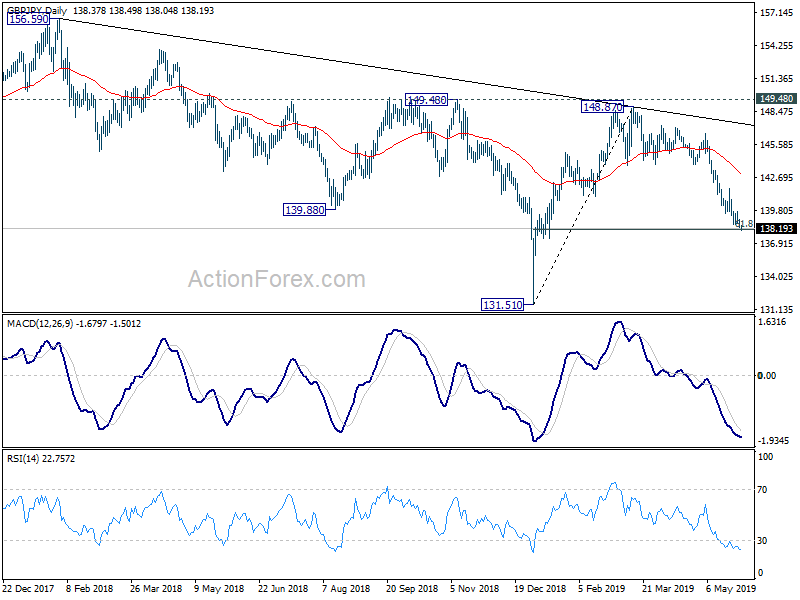
Intraday bias in GBP/JPY remains on the downside as fall from 148.87 is still in progress. Sustained break of 61.8% retracement of 131.51 to 148.87 at 138.14 will pave the way to retest 131.51 low. Though, considering loss of downside momentum as seen in 4 hour MACD, break of 139.64 resistance will indicate short term bottoming. In such case, stronger rebound and lengthier consolidation would be seen first, before more decline.
In the bigger picture, current development suggests that GBP/JPY was rejected by 149.98 key resistance. And medium term fall from 156.59 is still in progress. Break of 131.51 will target 122.36 (2016 low). On the other hand, decisive break of 149.98 should confirm that medium term fall from 156.59 (2018 high) has completed at 131.51 already. Further rally would be seen back to 156.59 resistance and above.
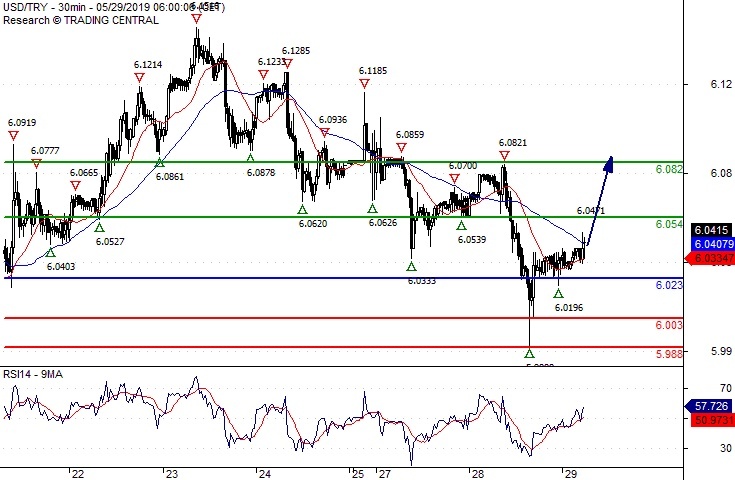
USD/TRY Continuation Of The Rebound
Pivot (invalidation): 6.0230
Our preference Long positions above 6.0230 with targets at 6.0540 & 6.0820 in extension.
Alternative scenario Below 6.0230 look for further downside with 6.0030 & 5.9880 as targets.
Comment The RSI calls for a rebound.
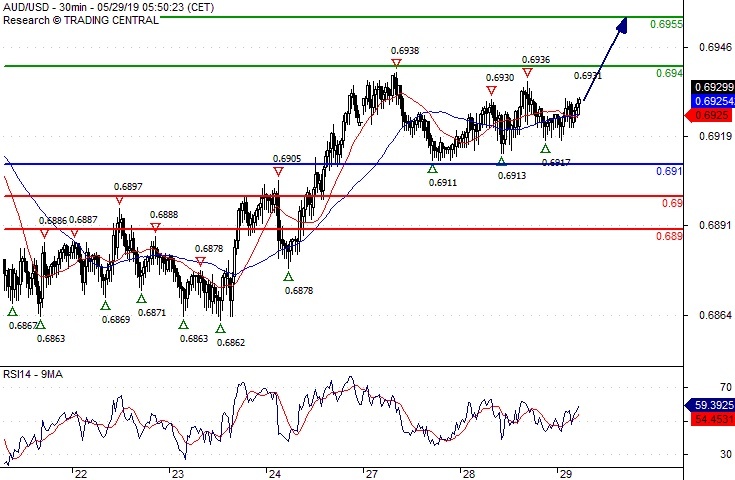
AUD/USD The Upside Prevails
Pivot (invalidation): 0.6910
Our preference Long positions above 0.6910 with targets at 0.6940 & 0.6955 in extension.
Alternative scenario Below 0.6910 look for further downside with 0.6900 & 0.6890 as targets.
Comment The RSI calls for a bounce.
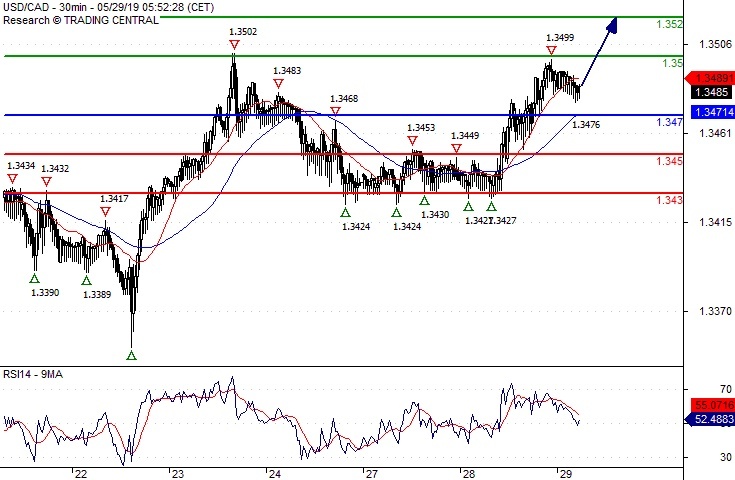
USD/CAD Bullish Bias Above 1.3470
Pivot (invalidation): 1.3470
Our preference Long positions above 1.3470 with targets at 1.3500 & 1.3520 in extension.
Alternative scenario Below 1.3470 look for further downside with 1.3450 & 1.3430 as targets.
Comment The RSI is above its neutrality area at 50%.
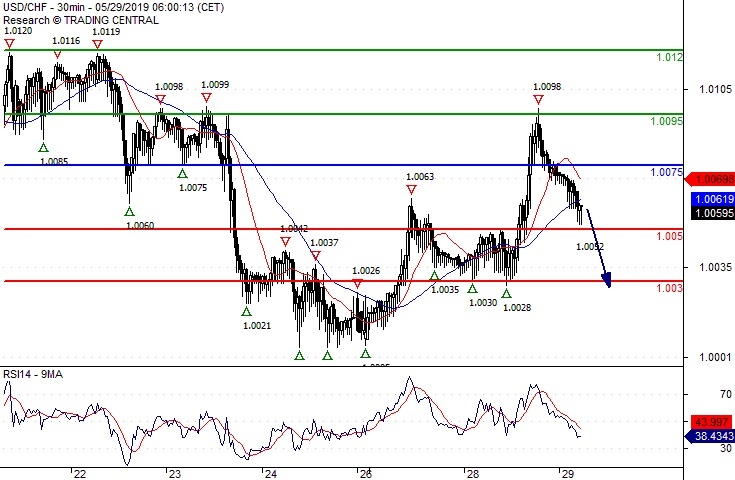
USD/CHF Turning Down
Pivot (invalidation): 1.0075
Our preference Short positions below 1.0075 with targets at 1.0050 & 1.0030 in extension.
Alternative scenario Above 1.0075 look for further upside with 1.0095 & 1.0120 as targets.
Comment The RSI calls for a drop.
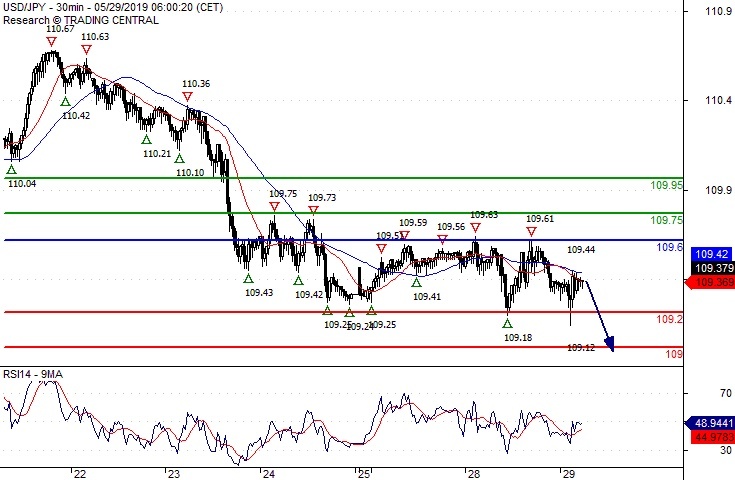
USD/JPY Towards 109.00
Pivot (invalidation): 109.60
Our preference Short positions below 109.60 with targets at 109.20 & 109.00 in extension.
Alternative scenario Above 109.60 look for further upside with 109.75 & 109.95 as targets.
Comment A break below 109.20 would trigger a drop towards 109.00.
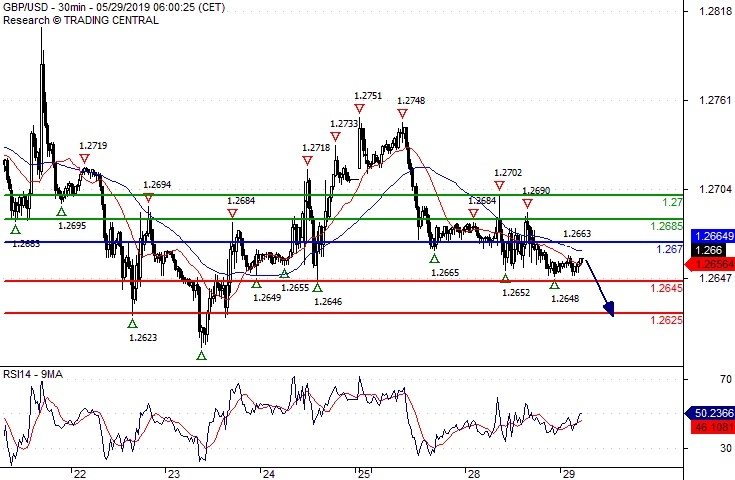
GBP/USD Key Resistance At 1.2670
Pivot (invalidation): 1.2670
Our preference Short positions below 1.2670 with targets at 1.2645 & 1.2625 in extension.
Alternative scenario Above 1.2670 look for further upside with 1.2685 & 1.2700 as targets.
Comment As Long as 1.2670 is resistance, look for choppy price action with a bearish bias.
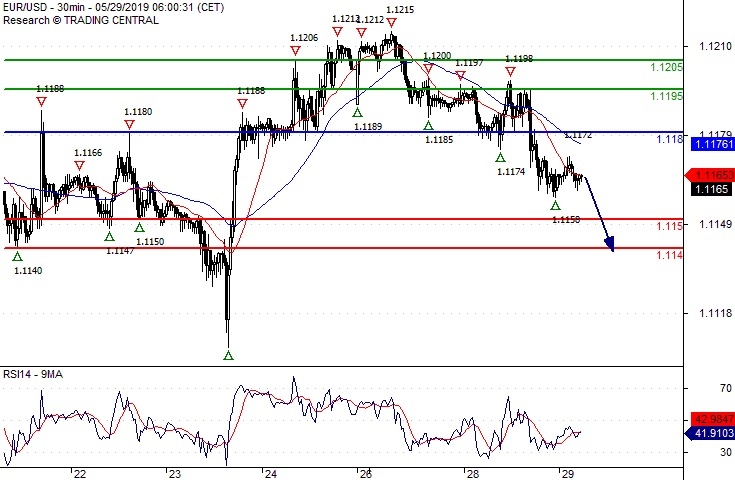
EUR/USD Under Pressure
Pivot (invalidation): 1.1180
Our preference Short positions below 1.1180 with targets at 1.1150 & 1.1140 in extension.
Alternative scenario Above 1.1180 look for further upside with 1.1195 & 1.1205 as targets.
Comment As Long as the resistance at 1.1180 is not surpassed, the risk of the break below 1.1150 remains high.
AUDUSD Regains Some Ground Above 0.69
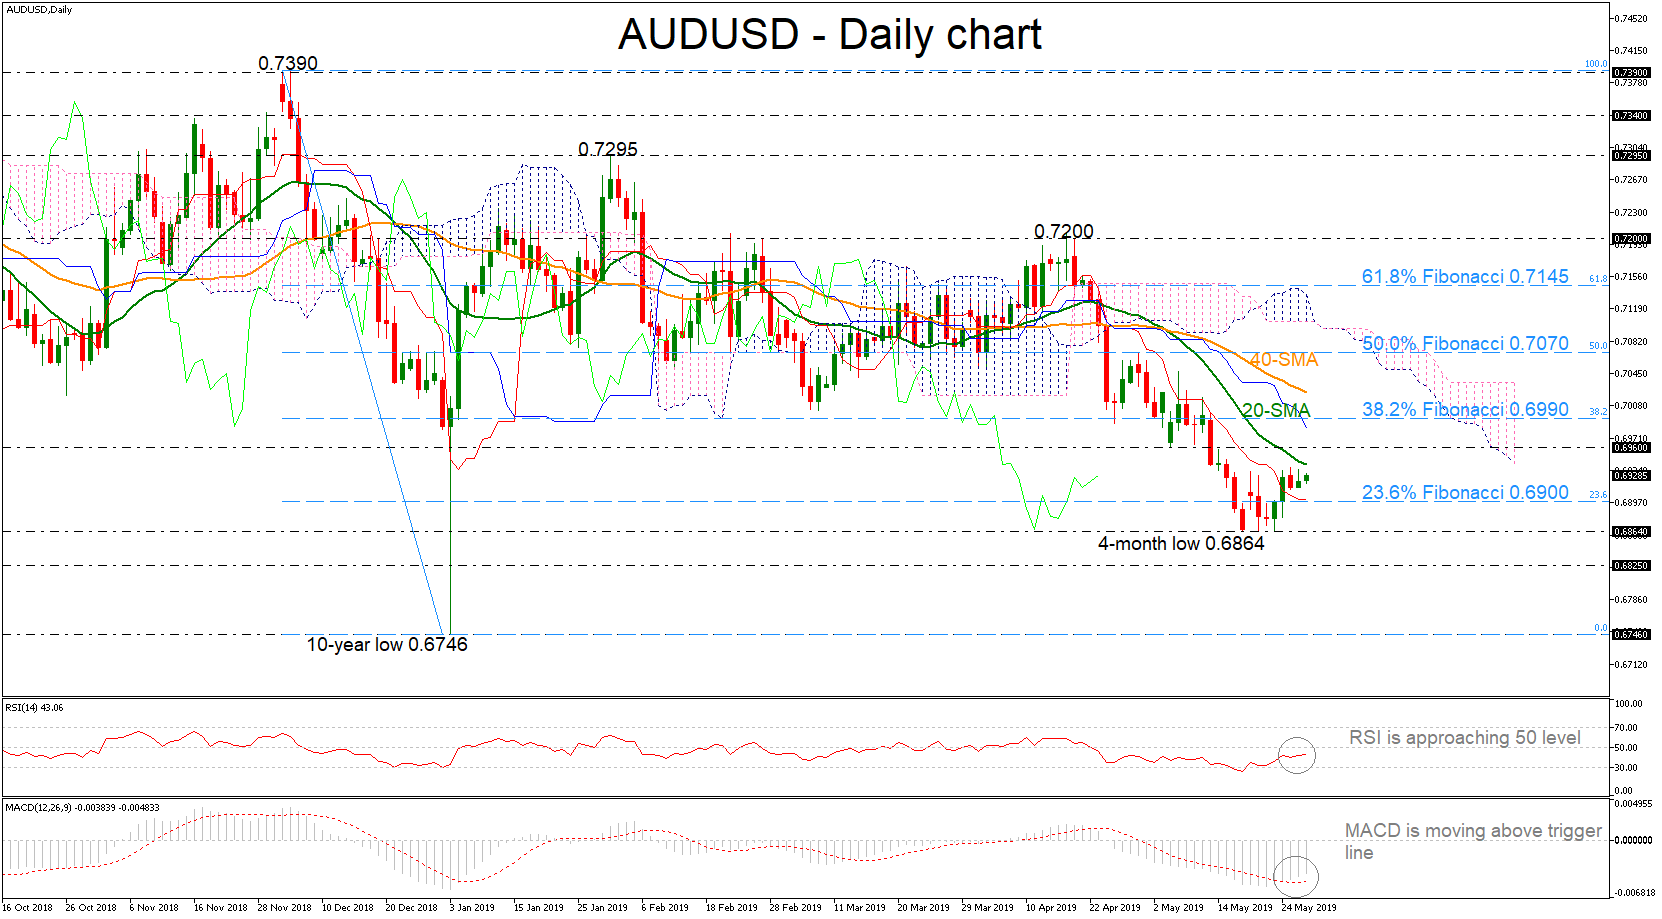
AUDUSD is regaining some losses after the violent sell-off towards the four-month low of 0.6864 in the prior week, sending prices above the red Tenkan-sen line and the 23.6% Fibonacci retracement level of the downfall from 0.7390 to 0.6746.
The RSI is currently increasing positive momentum towards its neutral threshold of 50 after an exit from overbought levels, while the MACD is heading north in negative territory, both hinting that the next move in prices could be on the upside rather than on the downside in the short-term.
If the price closes comfortably above the 20-day moving average, traders could add more buying pressure to the pair, pushing the market up to 0.6960. If this proves easy to overcome this time, the increase may next pause somewhere between the 38.2% Fibonacci of 0.6990 and the 40-SMA currently at 0.7020.
In the negative scenario, the price could return lower and touch the 23.6% Fibonacci of 0.6900, ahead of the four-month low of 0.6864. Marginally below this line, the 0.6825 support level, where it bottomed in January 2016, could come into focus, before slipping towards the ten-year low of 0.6746.
Summing up, AUDUSD is in bullish correction mode in the very short-term, however, looking at the bigger picture, the pair has been developing in a descending movement since December 2018. Investors should look for a break beneath 0.6864 for fresh bearish signals.