Sample Category Title
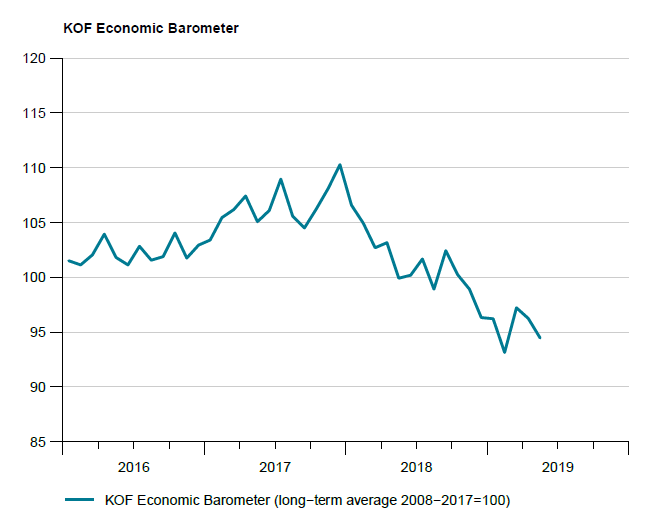
Swiss KOF dropped to 94.4, economy developing rather sluggishly
Swiss KOF Economic Barometer dropped to 94.4 in May, down from 96.2 and missed expectation of 96.2. The reading dived further below its long-term average. KOF noted "Swiss economy is developing rather sluggishly." And, majority of sets of indicators are tending downwards.
The indicators for banking and insurance, consumption and foreign demand have developed negatively. The prospects for accommodation and food service activities and the other service providers have become gloomier. In the manufacturing sector, the outlook hardly changed compared to the previous month. For the construction sector, the outlook has improved.
France Q1 GDP growth confirmed at 0.3%, exports growth decelerated sharply
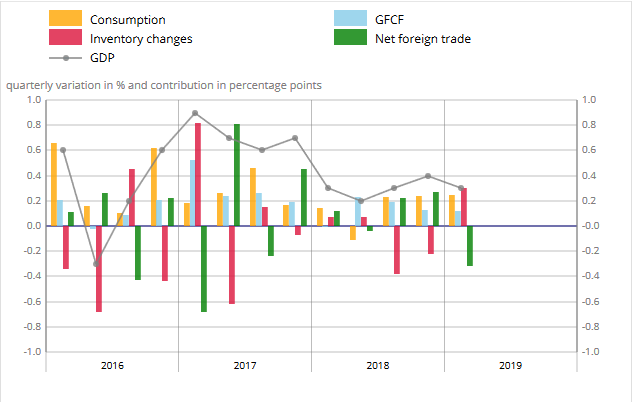
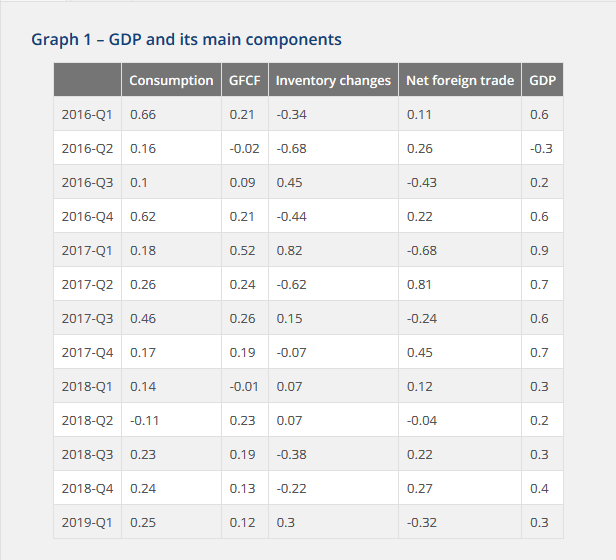
France GDP grew 0.3% qoq in Q1, unrevised from first estimate. Looking at the details, Households disposable income rose 0.9%. However, household consumption expenditure just grew 0.4%. Total gross fixed capital formation slowed down a bit to 0.5%. Overall, final domestic demand excluding inventory changes kept increasing at the same pace. Imports jumped 1.4% due to fuel. Exports growth decelerated sharply to 0.4%, down from 2.0%. Foreign trade balance contributed negatively to GDP growth: -0.3%.
EUR/GBP Daily Outlook
Daily Pivots: (S1) 0.8803; (P) 0.8823; (R1) 0.8840; More...
EUR/GBP is staying in consolidation below 0.8850 temporary top. Intraday bias remains neutral. Deeper retreat could be seen through 4 hour 55 EMA (now at 0.8784). But downside should be contained above 0.8681 resistance turned support to bring rebound. On the upside, break of 0.8850 and sustained trading above 0.8840 resistance will pave the way to 0.9101 key resistance next.
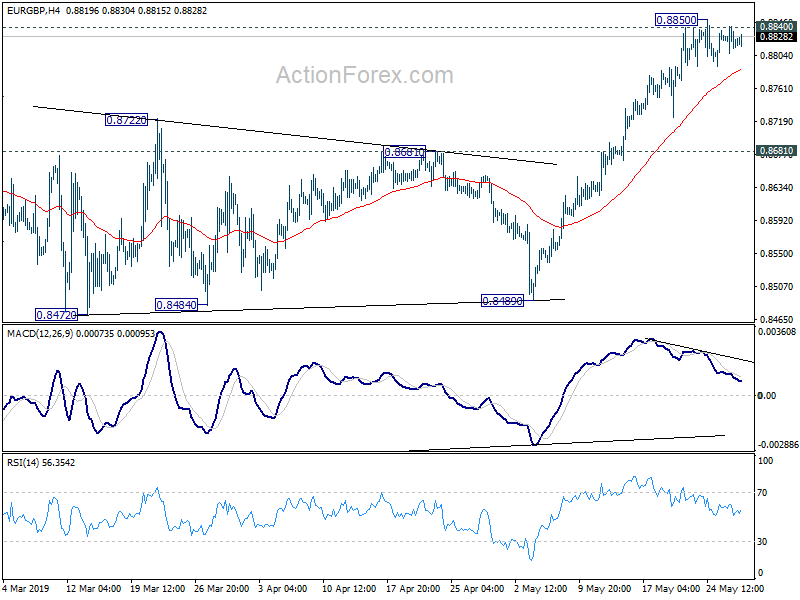
In the bigger picture, medium term decline from 0.9305 (2017 high) is seen as a corrective move. No change in this view. Current development argues that it might have completed with three waves down to 0.8472, just ahead of 38.2% retracement of 0.6935 (2015 low) to 0.9306 at 0.8400, after hitting 55 month EMA (now at 0.8511). Decisive break of 0.9101 resistance will confirm this bullish case. Nevertheless, as EUR/GBP is still staying inside long term falling channel, correction from 0.9305 could still extend to 0.8400 fibonacci level before completion.
EUR/AUD Daily Outlook
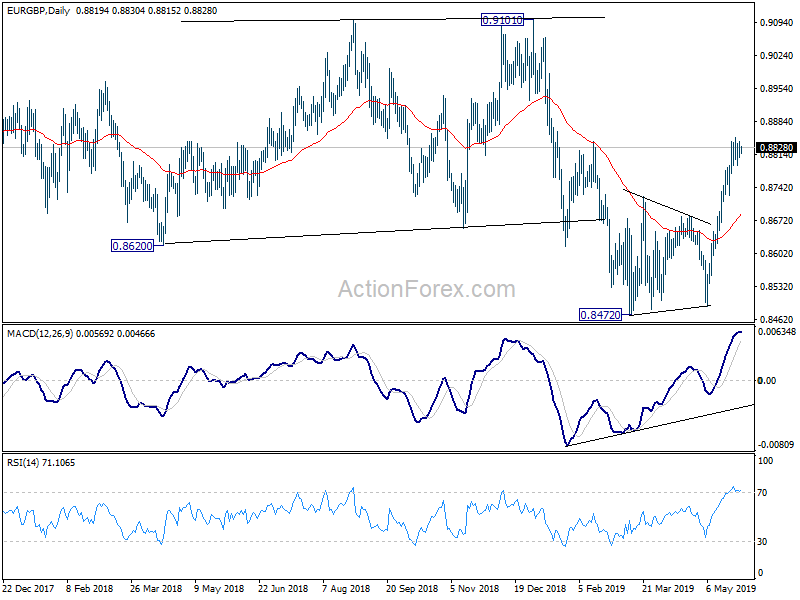
Daily Pivots: (S1) 1.6092; (P) 1.6142; (R1) 1.6171; More...
EUR/AUD is still bounded in consolidation from 1.6262 and intraday bias stays neutral. In case of deeper pull back, downside should be contained by 38.2% retracement of 1.5683 to 1.6262 at 1.6041 to bring rise resumption. Current development argues that correction from 1.6765 has completed with three waves down to 1.5683. On the upside, break of 1.6262 will pave the way to retest 1.6765 high.
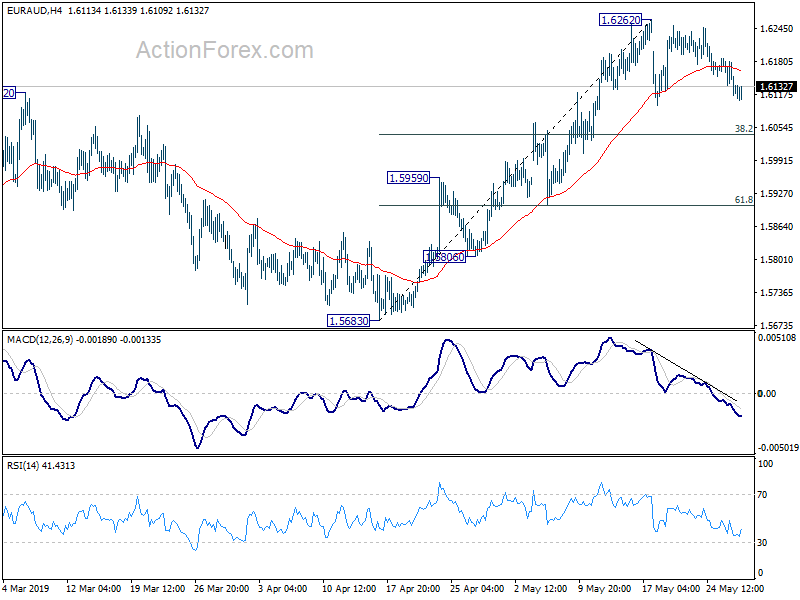
In the bigger picture, as long as 1.5346 support holds, outlook will still remain bullish. Up trend from 1.1602 (2012 low) is expected to resume sooner or later. Break of 1.6765 will target 61.8% retracement of 2.1127 (2008 high) to 1.1602 at 1.7488 next. However, firm break of 1.5346 key support will indicate trend reversal, with bearish divergence condition in weekly MACD, and turn outlook bearish.
EUR/CHF Daily Outlook
Daily Pivots: (S1) 1.1221; (P) 1.1251; (R1) 1.1276; More....
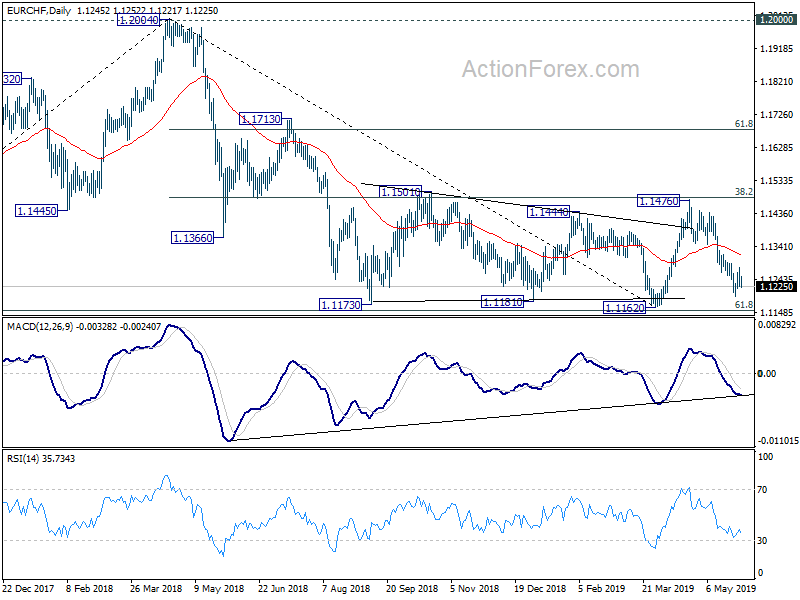
EUR/CHF failed to break through 1.1292 resistance and drops sharply today. But it's staying above 1.1195 temporary low. Intraday bias remains neutral first. In case of another fall through 1.1195, we'd still expect strong support above 1.1162 to bring rebound. Considering bullish convergence condition in 4 hour MACD, break of 1.1292 resistance should confirm short term bottoming. Further rise should then be seen back to retest 1.1476 resistance. Nevertheless, sustained break of 1.1162 could carry larger bearish implication and turn outlook bearish.
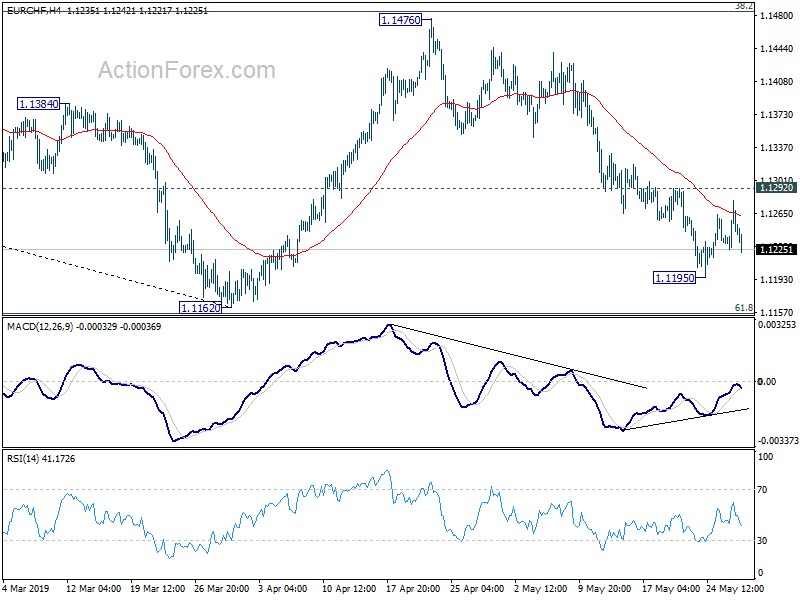
In the bigger picture, at this point, we're slightly favoring the case that corrective fall from 1.2004 has completed at 1.1162 after being supported by 61.8% retracement of 1.0629 to 1.2004 at 1.1154. Decisive break of 1.1501 resistance should confirm and target 1.1713 resistance next. On the downside, sustained break of 1.1154 will confirm resumption of decline from 1.2004 and target 1.0629 support next.
Will We See A Recession In 2019?
One question on every investor's mind is why the US markets are in control of bull market especially when we have too much uncertainty on the trade war front?
There is no doubt that trade war isn't going to help the US and neither China. But, Donald Trump, the US president, is determined to maintain his stubborn stance. He wants China to bend to his will. Clearly, he has taken a war with a wrong country because he cannot use the usual tactics of sanctions to make the government weak, and then use other resources to make the country to bend to its knee.
This is China, the second biggest economy of the world, if the country sneezes, the whole world catches the cold so picking a fight with a country like this is clearly a blunder, but Trump administration is in denial of this fact, and just for their own political motive, they are extending the war and willing to take it as far as they can.
At the same time, this is also a reality that the global markets aren't paying much attention to this because after every few down days we see the bulls coming back into the market pushing the markets towards their all-time high and this has been the trend throughout this year.
For me, this doesn't make sense, because the US markets aren't cheap and neither have access to cheap money anymore which was the actual reason for the stock rally that we have seen.
So, the questions is: if we are going to see recession in 2019?
Well, by looking at the performance of the equity markets, it does seem like that there any chances of recession coming soon.
The year to date gains for the NASDAQ index sits at 14.65 percent, the Dow Jones index has soared 8.66% and the S&P 500 index has climbed 11.79%. So, by looking at these solid gains, it doesn't look like that these markets are ready to move lower. But another perspective to measure the bullish sentiment is to see how far off these markets are trading from their all time high?
Well, the Nasdaq index is off by nearly 6.34% from its all-time high, the S&P 500 is 4.56% and the Dow Jones is down nearly 4.76% from its all time high. This tell us that the stock market is solid and there are no signs of panic.
Speaking of uncertainty, one of the biggest measure which shows a better picture of this is the Volatility index, the VIX index. It is down nearly 31.16% year to date, but it has recovered nearly 45% of its value from its lows which were formed back in April 2019.
Aha, now, we are getting somewhere, and the situation doesn't look that rosy as it looked like before.
But, before we jump into any conclusion, lets also have a look at one more safe haven asset because the fact is that if there is anything cooking under the hood, then we should see the gold price moving higher. Well, the year to date gains for the yellow metal sits at 3.07%. This is despite the fact that the Federal Reserve has adopted a dovish stance towards their monetary policy.
To asses the situation for the safe haven demand is to measure the inflow and outflow of gold in the exchange traded fund. The SPDR Gold ETF has experienced its largest outflow since 2016, with an outflow exceeding $926 million in the first week of May alone. Having said this, the bleeding didn't get much worse and this is because as of the last week, the inflow was $120 million which is better than the previous week's outflow number of $303 million. So, clearly, investors are hedging bets and this shows that hedging is in place.
I always like to look at the economic data and try to see how the performance has been with respect to the forecast. This particular strategy gives a good idea how the economic health of the country is because if the economic recession is going to hit then the economic surprise index should start to roll to the downside. Comparing this particular index with the gold chart also gives another indication how institutional investors are placing their bets.
The Federal Reserve over in the United States intervened back in 2007 when the financial crisis hit. But, remember, the Fed is usually behind the curve and market participants have it right most of the time. Therefore, the Bloomberg US Economic Surprise Index is helpful in this situation. In the chart below, you can see that the economic data has started to perform extremely well since March.
Although, the current reading is -0.18, still in the negative territory, but the improvement in this index has been extremely strong. This is because back in March the index was well below the -0.50 level. Also, the correlation between the gold price and the Economic Surprise Index since October 2018 has been negative - one goes up and the other moves lower.
So, to conclude, I think there are serious concerns and factors like trade war should not be taken lightly. The US markets are too expensive and the geopolitical conditions aren't stable so I think it is likely that we may see a recession soon especially if the economic number out of China aren't true.
EUR/USD Outlook: Bears May Extend Towards Key 1.11 Support Zone
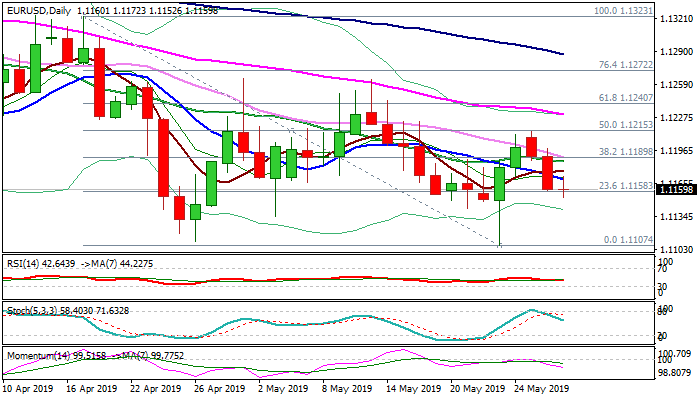
The Euro holds in red for the third straight day and extends weakness from 1.1215 lower top (27 May) to new one-week low in early Wednesday's trading.
Stronger dollar on renewed risk aversion and uncertainty over EU's economic and political situation keeps the Euro under pressure.
Tuesday's long bearish daily candle (the biggest one-day loss since 24 Apr) weighs, along with bearish signal was generated on Tuesday's close below 10SMA.
Daily MA's turned to full bearish setup and rising bearish momentum add to negative outlook.
Bears look for fresh signal on break below Fibo support at 1.1148 (61.8% of 1.1107/1.1215) that would expose key supports at 1.1111/07 (26 Apr / 23 May lows) the lowest levels since mid -May 2017.
Broken 10SMA (1.1169) marks initial resistance, guarding pivots converging 20/30 SMA's (1.1185/90).
Only firm break above 1.1215 (Mon high / 50% retracement of 1.1323/1.1107) would neutralize downside risk.
German labor data are due in a while and expected to give fresh signals.
Res: 1.1169, 1.1190, 1.1215, 1.1230
Sup: 1.1148, 1.1132, 1.1111, 1.1107
AUD/USD Daily Outlook
Daily Pivots: (S1) 0.6913; (P) 0.6925; (R1) 0.6934; More...
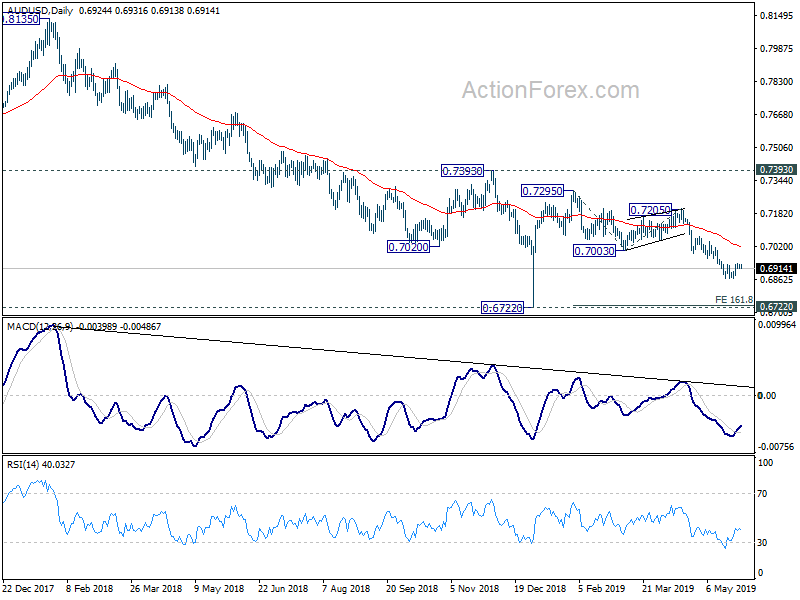
AUD/USD is staying in consolidation from 0.6864. Intraday bias remains neutral and outlook is unchanged. In case of stronger recovery, upside should be limited by 0.6988 support turned resistance to bring fall resumption. On the downside, break of 0.6864 resume the fall from 0.7295 to 161.8% projection of 0.7295 to 0.7003 from 0.7205 at 0.6733, which is close to 0.6722 low.
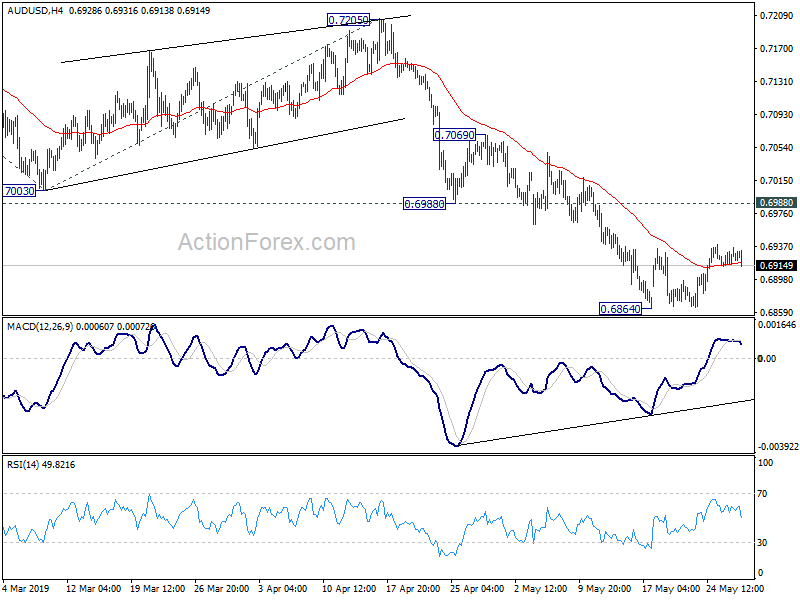
In the bigger picture, with 0.7393 key resistance intact, medium term outlook remains bearish. The decline from 0.8135 (2018 high) is seen as resuming long term down trend from 1.1079 (2011 high). Decisive break of 0.6826 (2016 low) will confirm this bearish view and resume the down trend to 0.6008 (2008 low). However, firm break of 0.7393 will argue that fall from 0.8135 has completed. And corrective pattern from 0.6826 has started the third leg, targeting 0.8135 again.
USD/CAD Daily Outlook
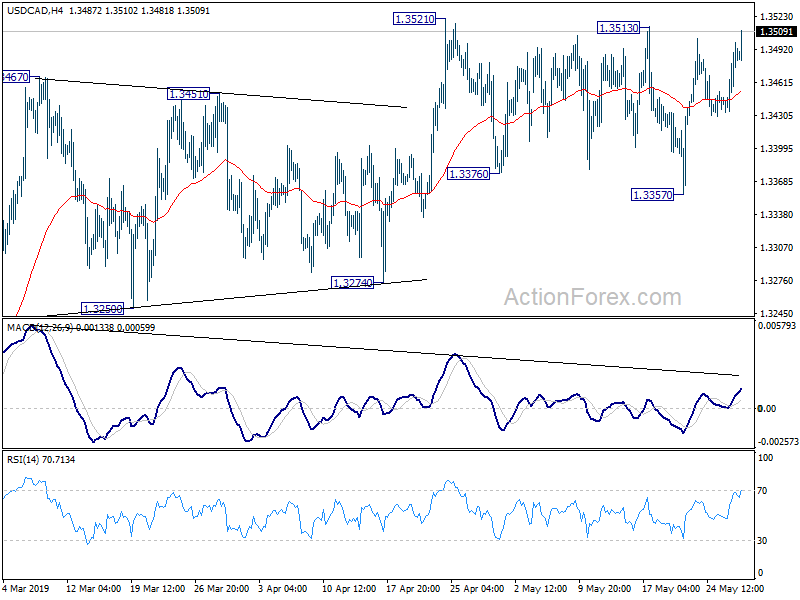
Daily Pivots: (S1) 1.3451; (P) 1.3476; (R1) 1.3518; More...
USD/CAD rises notably today but it's limited below 1.3521 resistance so far. Intraday bias remains neutral first. On the upside, firm break of 1.3521 will resume the whole rise from 1.3068 to retest 1.3664 high. On the downside, in case of another fall, downside should be contained by 1.3357 support to bring up trend resumption eventually.
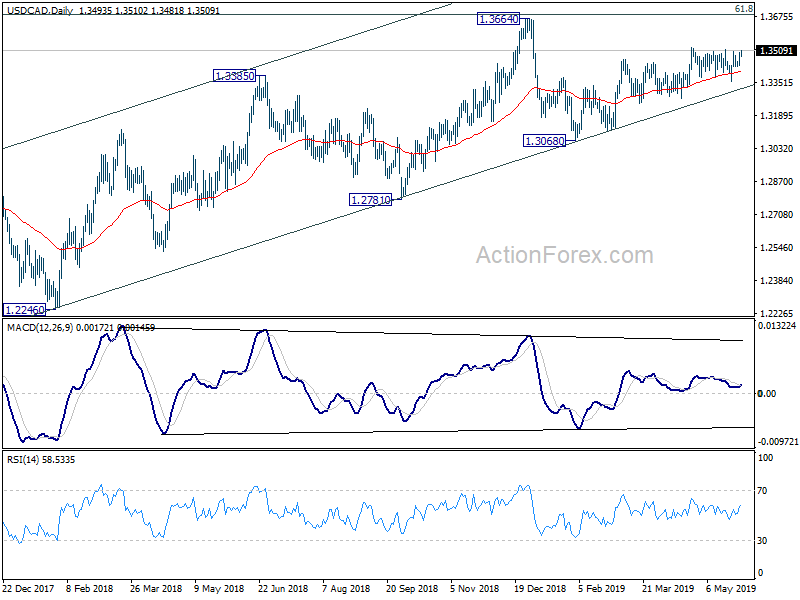
In the bigger picture, USD/CAD is staying well inside medium term rising channel (support at 1.3296). Thus, the up trend from 1.2061 (2017 low) should be in progress. On the upside, decisive break of 61.8% retracement of 1.4689 (2016 high) to 1.2061 at 1.3685 will pave the way to 78.6% retracement at 1.4127 next. This will remain the favored case as long as 1.3068 support holds. However, sustained break of the channel support will be the first sign of medium term reversal. Firm break of 1.3068 would confirm.
Gold Extends Declines But Investors Stay Cautious
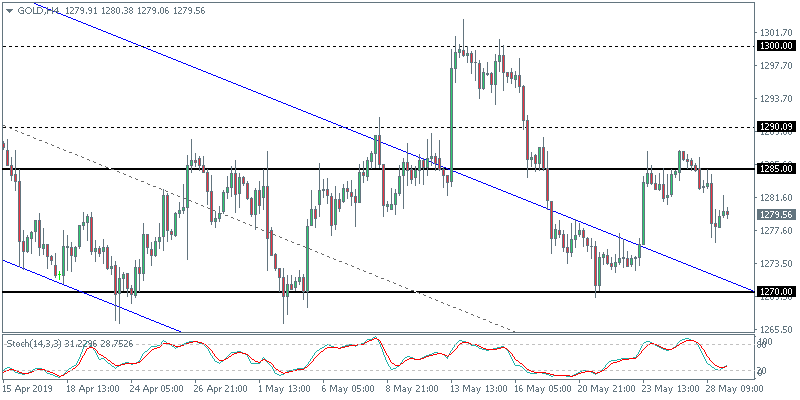
Gold prices were down 0.45% on the day on Tuesday. This follows the general market sentiment which remains cautious amid various narratives including the US and Iran tensions and the trade war with China which has now escalated into a tech war. The beleaguered Chinese firm Huawei has filed a legal action in a bid to end the current standoff.
XAUUSD Approaches the 200-day EMA
The declines in gold prices on Tuesday saw the precious metal once again falling back to the 200-day EMA. The moving average has offered dynamic support on previous occasions. If it manages to hold the declines in gold once again, then we expect the sideways range to continue. However, watch for a possible decline in 1270 handle which could push gold prices down to the 1240 – 1250 level as the bearish trend gains momentum.