Sample Category Title
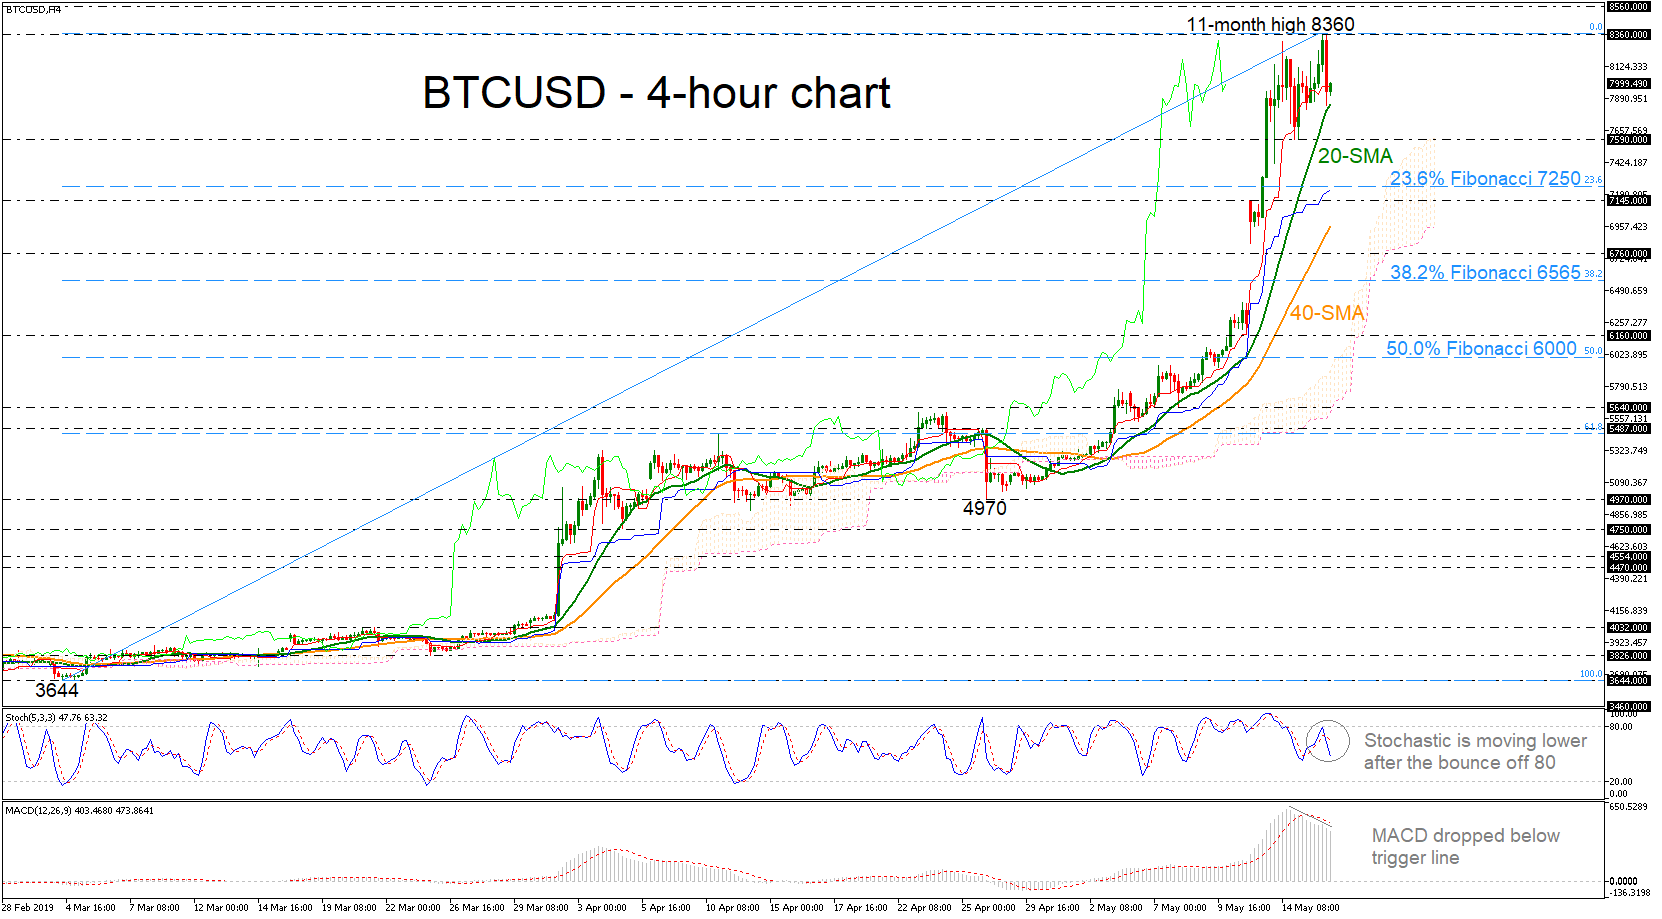
DAX Further Advance
Pivot (invalidation): 11950.00
Our preference Long positions above 11950.00 with targets at 12230.00 & 12318.00 in extension.
Alternative scenario Below 11950.00 look for further downside with 11860.00 & 11790.00 as targets.
Comment The RSI is bullish and calls for further advance.
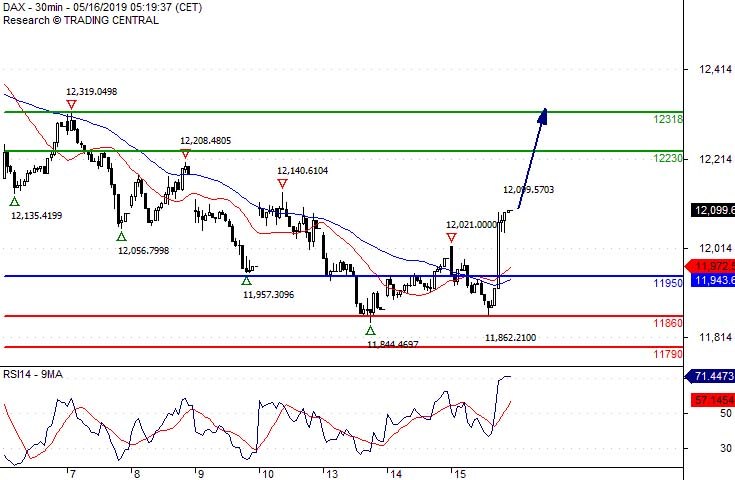
USD/TRY Capped By A Negative Trend Line
Pivot (invalidation): 6.0440
Our preference Short positions below 6.0440 with targets at 5.9900 & 5.9530 in extension.
Alternative scenario Above 6.0440 look for further upside with 6.0790 & 6.1080 as targets.
Comment Even though a continuation of the technical rebound cannot be ruled out, its extent should be limited.
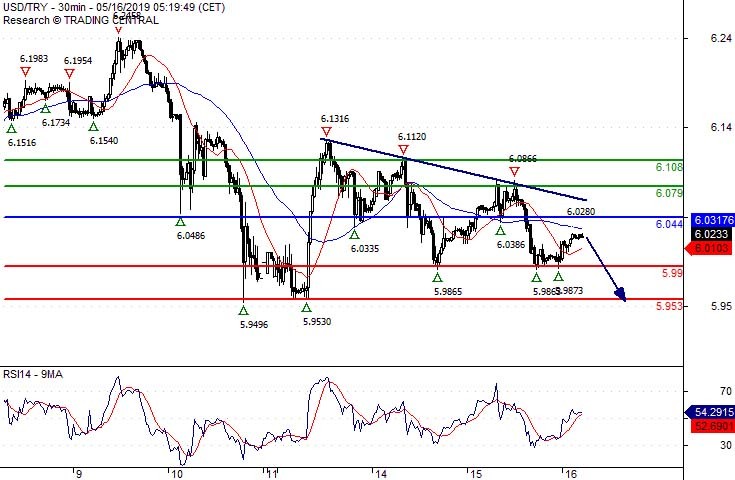
AUD/USD The Downside Prevails
Pivot (invalidation): 0.6935
Our preference Short positions below 0.6935 with targets at 0.6890 & 0.6870 in extension.
Alternative scenario Above 0.6935 look for further upside with 0.6950 & 0.6960 as targets.
Comment The RSI is bearish and calls for further downside.
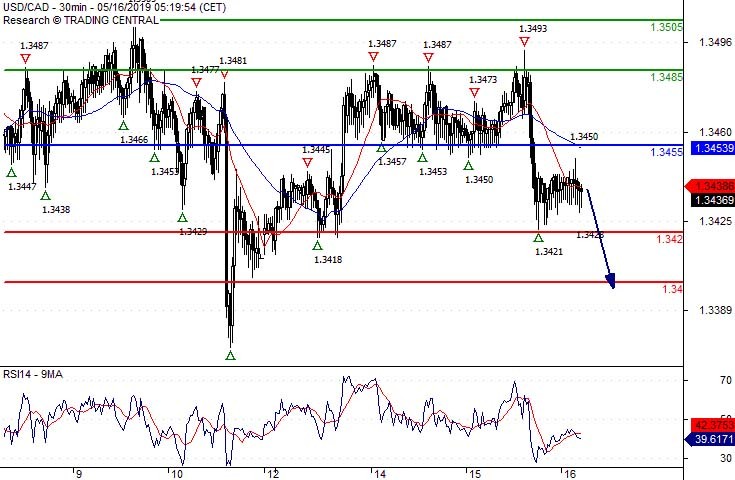
USD/CAD Look For 1.3400
Pivot (invalidation): 1.3455
Our preference Short positions below 1.3455 with targets at 1.3420 & 1.3400 in extension.
Alternative scenario Above 1.3455 look for further upside with 1.3485 & 1.3505 as targets.
Comment The RSI lacks upward momentum.
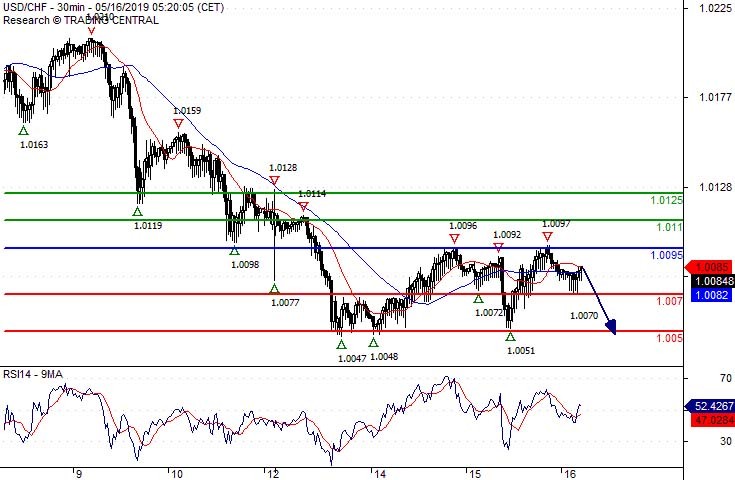
USD/CHF Under Pressure
Pivot (invalidation): 1.0095
Our preference Short positions below 1.0095 with targets at 1.0070 & 1.0050 in extension.
Alternative scenario Above 1.0095 look for further upside with 1.0110 & 1.0125 as targets.
Comment The index currently faces a challenging resistance area at 1.0095.
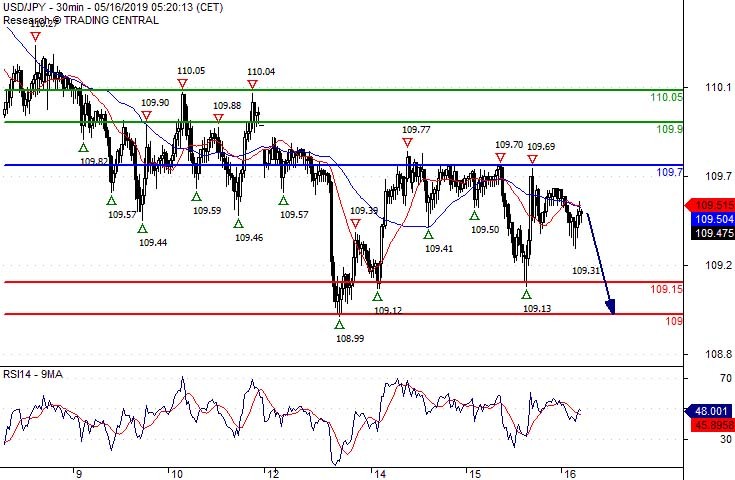
USD/JPY Key Resistance At 109.70
Pivot (invalidation): 109.70
Our preference Short positions below 109.70 with targets at 109.15 & 109.00 in extension.
Alternative scenario Above 109.70 look for further upside with 109.90 & 110.05 as targets.
Comment As Long as 109.70 is resistance, look for choppy price action with a bearish bias.
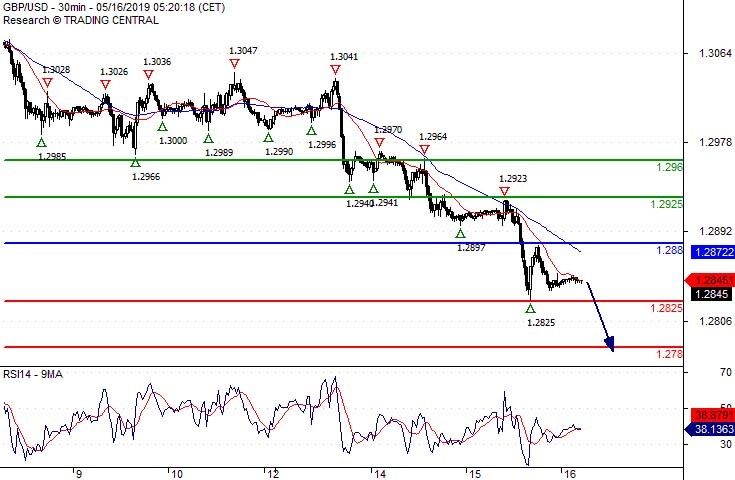
GBP/USD 1.2780 Expected
Pivot (invalidation): 1.2880
Our preference Short positions below 1.2880 with targets at 1.2825 & 1.2780 in extension.
Alternative scenario Above 1.2880 look for further upside with 1.2925 & 1.2960 as targets.
Comment A break below 1.2825 would trigger a drop towards 1.2780.
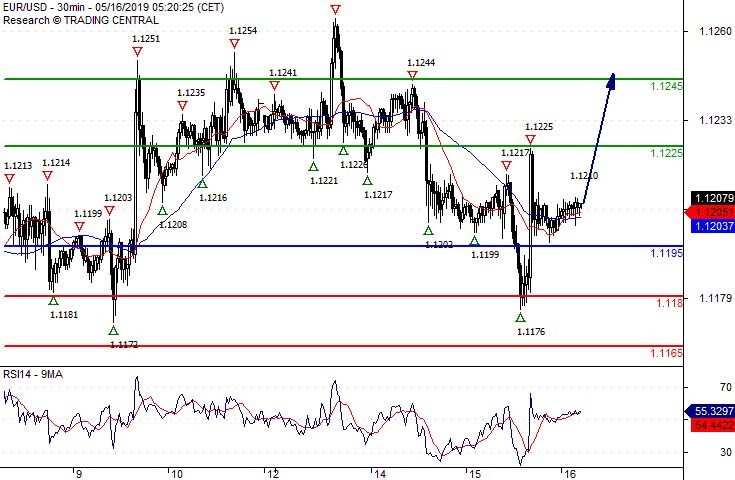
EUR/USD Bullish Bias Above 1.1195
Pivot (invalidation): 1.1195
Our preference Long positions above 1.1195 with targets at 1.1225 & 1.1245 in extension.
Alternative scenario Below 1.1195 look for further downside with 1.1180 & 1.1165 as targets.
Comment The RSI has just landed on its neutrality area at 50% and is turning up
USDJPY To Consolidate Losses In Short Term
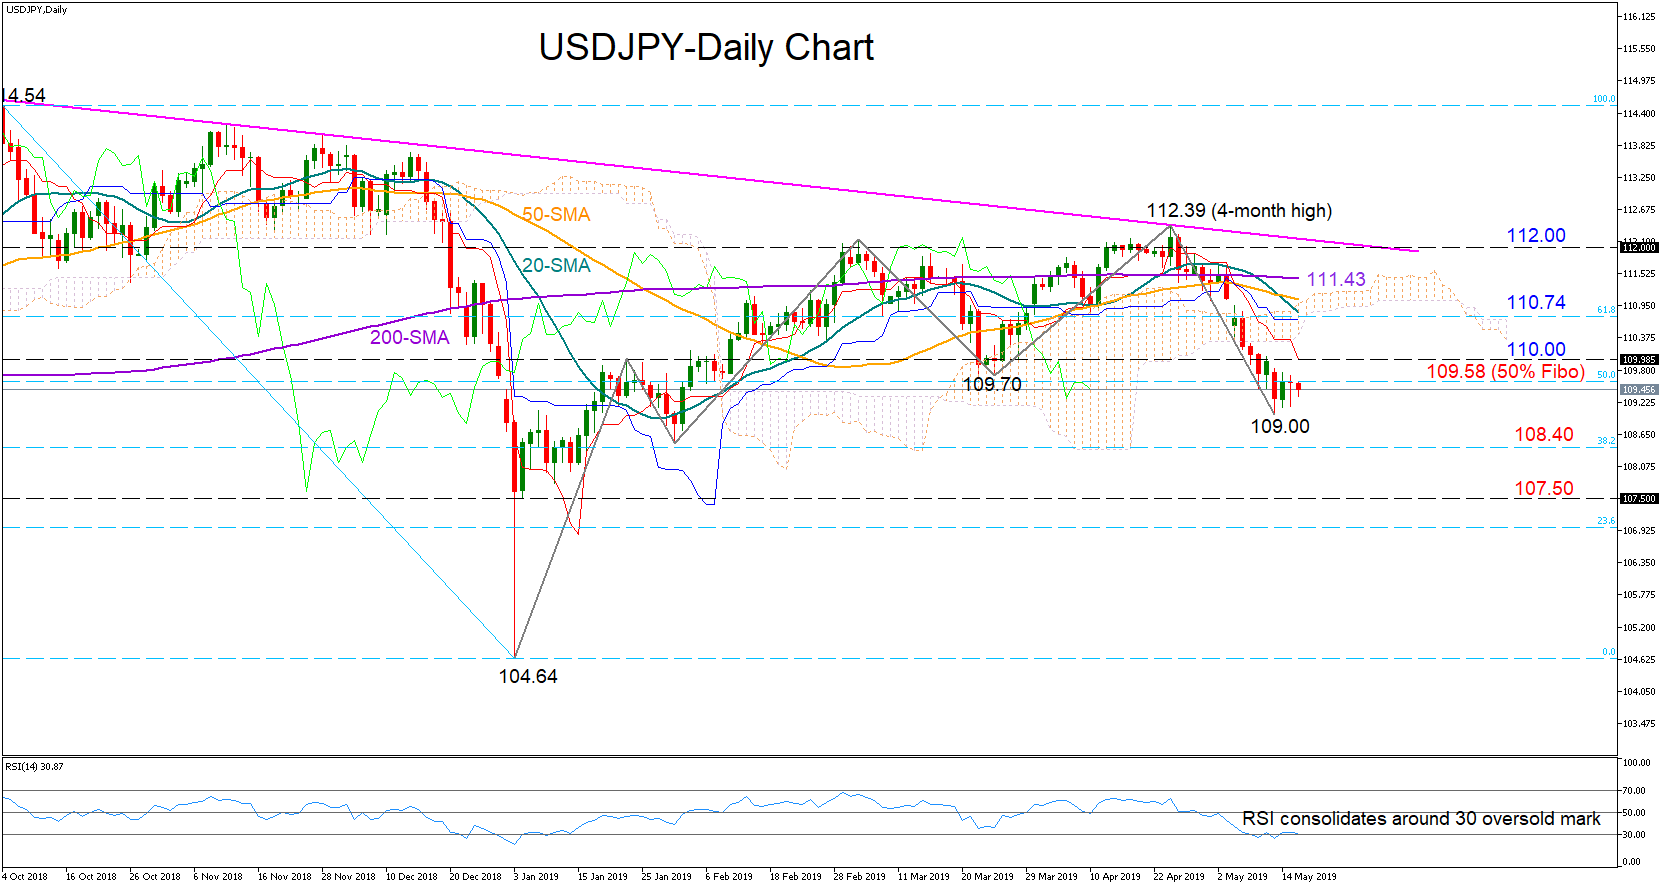
USDJPY paused its sell-off around the 109 round level earlier this week as the RSI signaled that bearish pressures were exhausted. The indicator is currently moving sideways along its 30 oversold mark, hinting that a consolidation phase may follow before the price potentially rebounds.
Sellers could wait for the price to rise well above the 109.70-110 area and hence jump back above the previous low of the January uptrend to re-enter the market. Slightly higher, the 61.8% Fibonacci of 110.74 of the downleg from 114.54 to 104.64 could provide some resistance ahead of the 200-day simple moving average (SMA) currently near 111.43, while the main target remains the descending line (112) drawn from the 114.54 peak.
Should the market fail to hold above the 109 mark, the bears could retake control with scope to beat the 38.2% Fibonacci of 108.40. Moving lower, the 107.50 support may prove even tougher to break.
In the medium-term picture, the outlook has turned neutral after the fall below 109.70. A new bullish phase could emerge above the 112.39 level, while a drop below 107.50 would switch the outlook to bearish. In the meantime, this broad range is expected to hold.
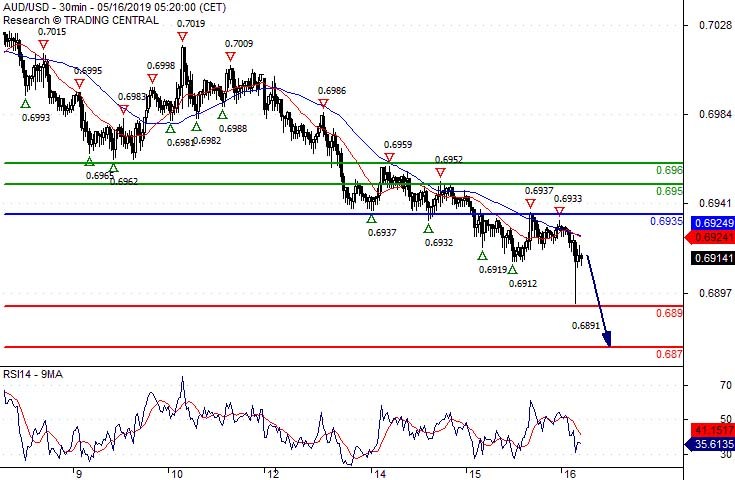
BTCUSD Pares Some Gains After Reaching 11-Month High
BTCUSD skyrocketed to a fresh eleven-month high of 8360 earlier today, but it quickly pared some of the gains, returning lower near the 20-simple moving average (SMA) in the 4-hour chart. The price is capped by the red Tenkan-sen line, suggesting a possible bearish correction while the technical indicators are also pointing down. The stochastic oscillator bounced off the overbought territory and the MACD slipped beneath its trigger line and is losing momentum.
In case of further bearish action, immediate support is coming from the 7590 barrier, taken from the latest lows before touching the 23.6% Fibonacci retracement level of the upleg from 3644 to 8360 around 7250. A successful close below this level could see a retest of the 40-SMA currently at 6965.
However, if prices are unable to post a negative correction in the short term, the outlook would shift back to the upside, with the eleven-month high of 8360 coming into focus again. Above this level, the next target could be faced near the 8560 resistance, taken from the high on May 2018.
Concluding, in the medium-term, bitcoin has a strong ascending tendency over the last five months, however, it seems to be overstretched in the short-term, flirting with a downside retracement.