Sample Category Title
EUR/CHF Daily Outlook
Daily Pivots: (S1) 1.1271; (P) 1.1293; (R1) 1.1322; More...
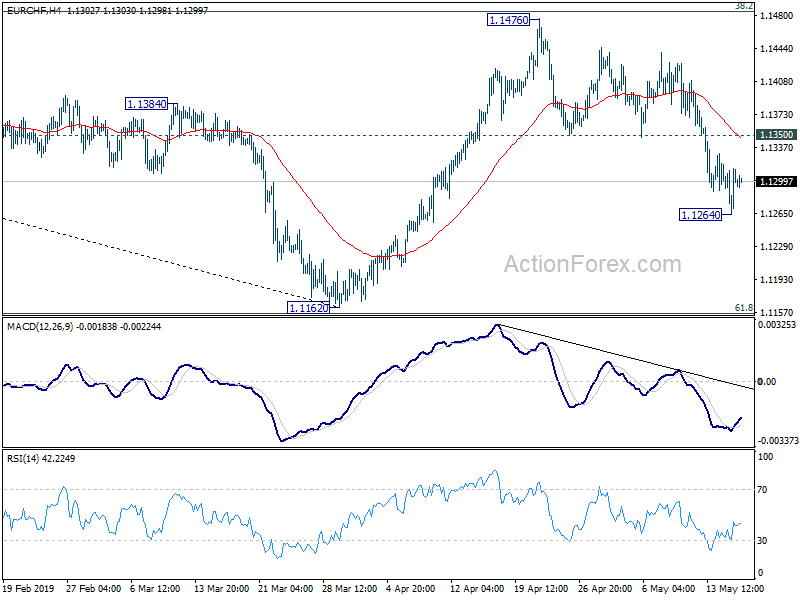
A temporary low is in place at 1.1264 in EUR/CHF and intraday bias is turned neutral first. Some consolidation could be seen but further decline is expected as long as 1.1350 support tuned resistance holds. On the downside below 1.1264 will extend the corrective fall from 1.1476 towards 1.1162 low. We'd expect strong support above there to bring rebound. On the upside, break of 1.1350 will suggest that the pull back has completed. Intraday bias will be turned back to the upside for 38.2% retracement of 1.2004 to 1.1162 at 1.1484 again.
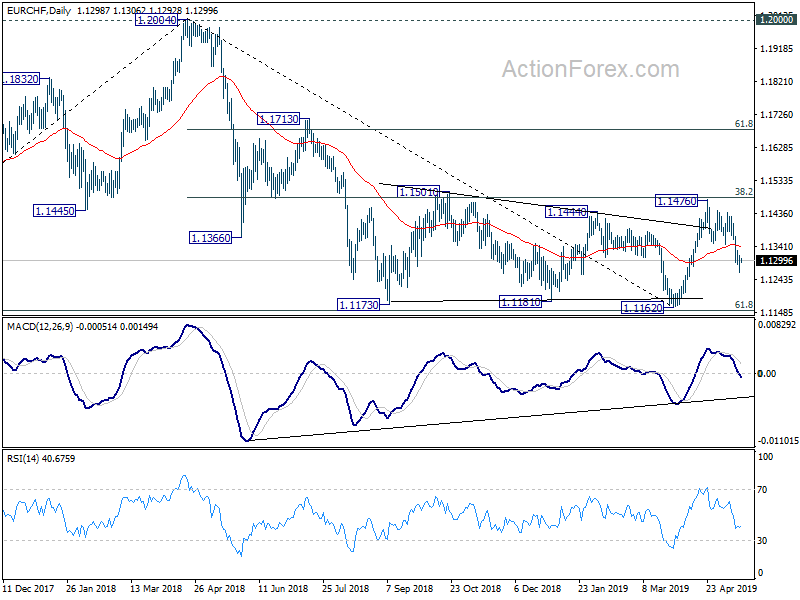
In the bigger picture, at this point, we're slightly favoring the case that corrective fall from 1.2004 has completed after being supported by 61.8% retracement of 1.0629 to 1.2004 at 1.1154. Decisive break of 1.1501 resistance should confirm and target 1.1713 resistance next. On the downside, firm break of 1.1154 is needed to confirm down trend resumption. Otherwise, medium term outlook will be neutral at worst.
EUR/USD Daily Outlook
Daily Pivots: (S1) 1.1178; (P) 1.1202; (R1) 1.1225; More.....
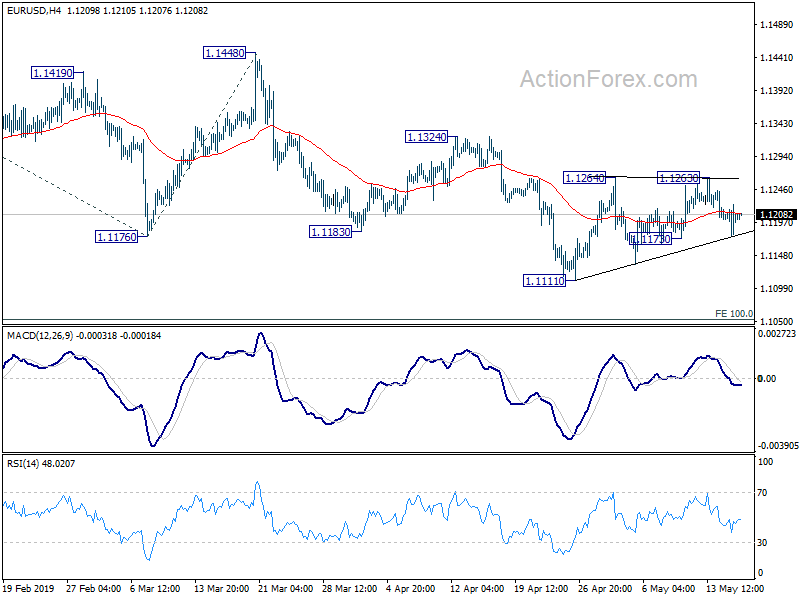
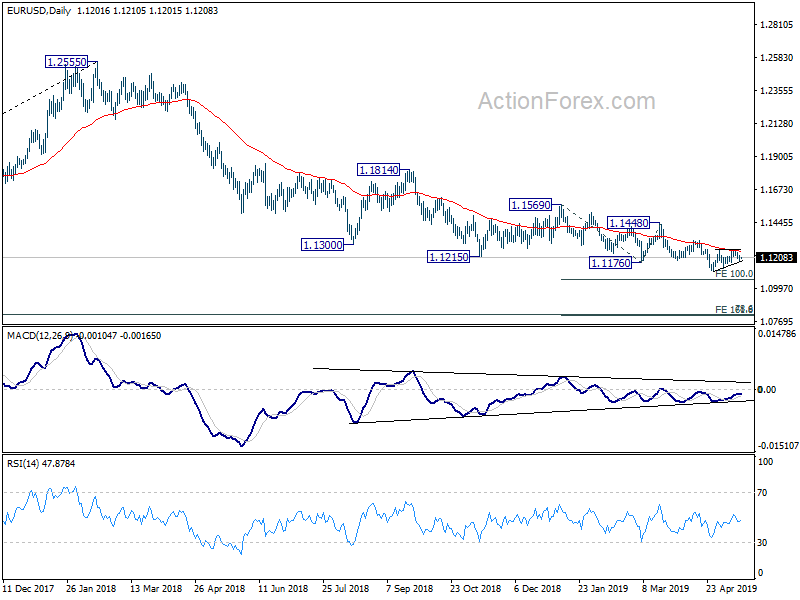
Intraday bias in EUR/USD remains neutral first and consolidation from 1.1111 might extend. In case of another rise, upside should be limited well below 1.1324 resistance. On the downside, break of 1.1173 will turn bias to the downside for 1.1111 low. Break will extend down trend to 100% projection of 1.1448 to 1.1183 from 1.1324 at 1.1059.
In the bigger picture, down trend from 1.2555 (2018 high) has just resumed. 61.8% retracement of 1.0339 (2016 low) to 1.2555 (2018 high) at 1.1186 was also taken out. Current fall should now target 78.6% retracement at 1.0813. Sustained break there will pave the way to retest 1.0339. On the downside, break of 1.1448 resistance is needed to be the first sign of medium term bottoming. Otherwise, outlook will stay bearish in case of rebound.
GBP/USD Daily Outlook
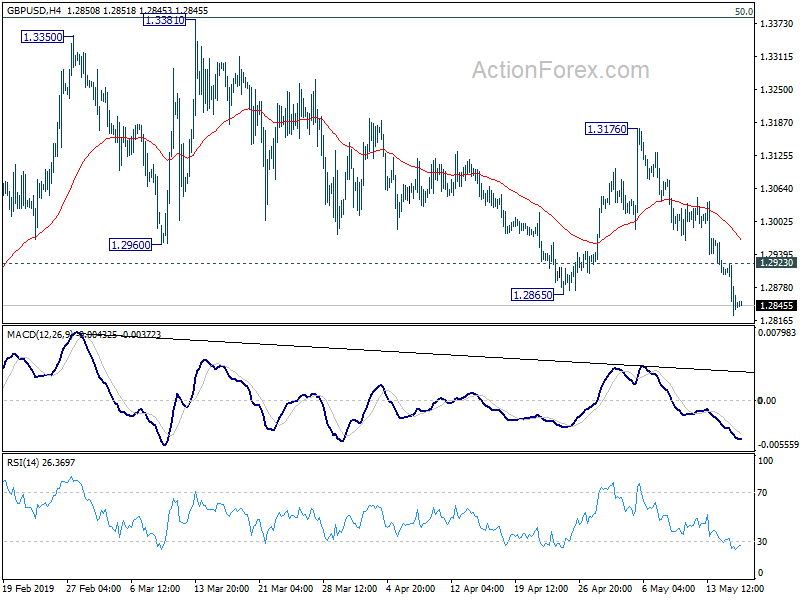
Daily Pivots: (S1) 1.2805; (P) 1.2864; (R1) 1.2902; More....
Intraday bias in GBP/USD remains on the downside for the moment. Prior break of 1.2865 should confirm completion of rebound from 1.2391, at 1.3381. Further decline should be seen back to retest 1.2391 low. On the upside, above 1.2923 minor resistance will turn intraday bias neutral for consolidation first. But recovery should be limited well below 1.3176 resistance to bring fall resumption.
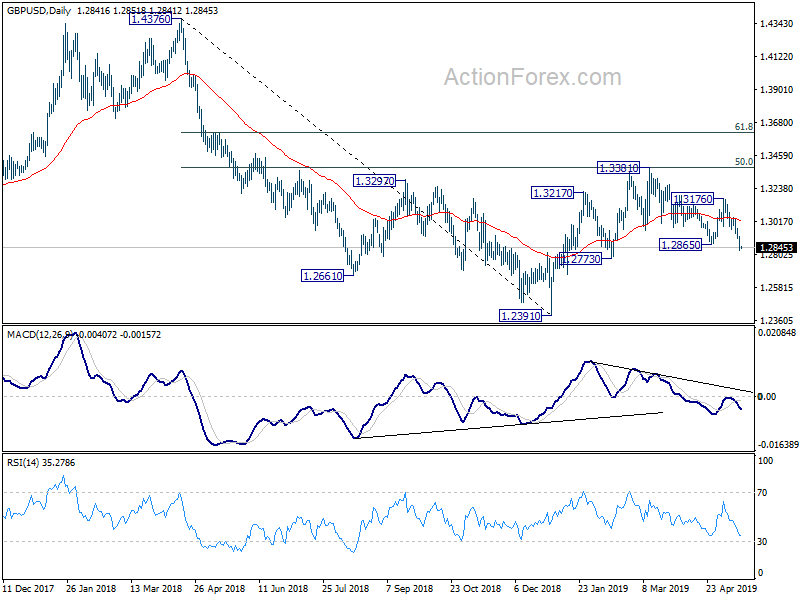
In the bigger picture, medium term decline from 1.4376 (2018 high) halted and made a medium term bottom after hitting 1.2391. Rebound from 1.2391 is seen as a corrective move for now. In case of another rise, strong resistance could be seen around 61.8% retracement of 1.4376 to 1.2391 at 1.3618 to limit upside. On the downside, break of 1.2773 support will suggests that such corrective rise is completed and bring retest of 1.2391 low first.
USD/CHF Daily Outlook
Daily Pivots: (S1) 1.0062; (P) 1.0080; (R1) 1.0105; More...
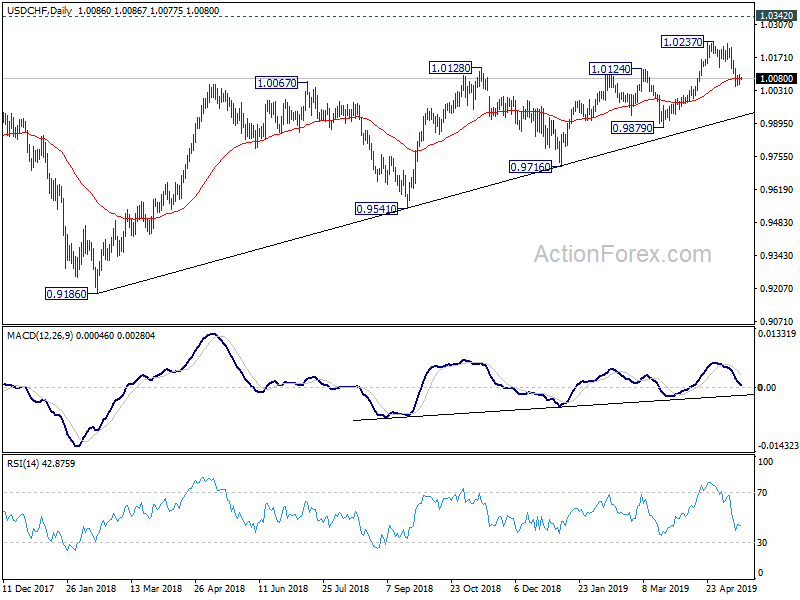
Intraday bias in USD/CHF remains neutral as consolidation from 1.0050 temporary is extending. Upside of recovery should be limited by 1.0126 minor resistance to bring another decline. On the downside, break of 1.0050 will resume the fall from 1.0237 to retest 0.9879 key support. Though, firm break of 1.0126 will turn bias back to the upside for 1.0237 resistance.
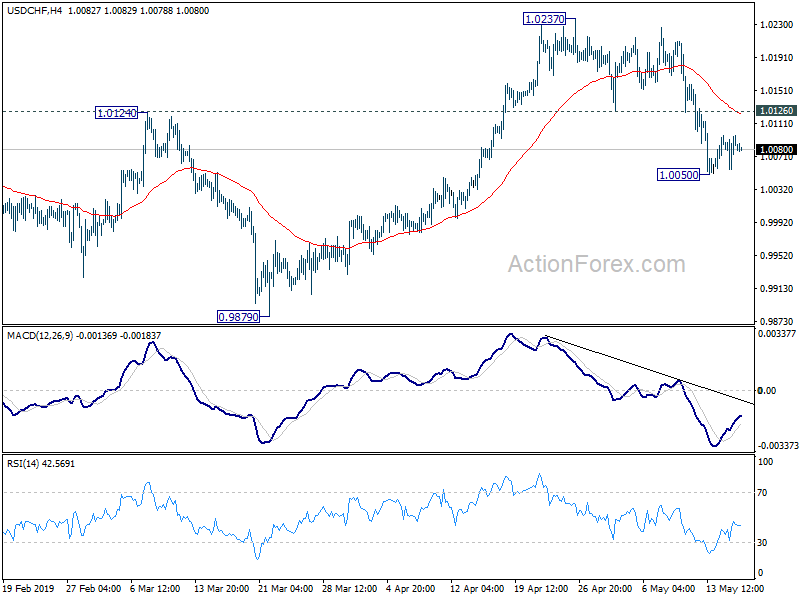
In the bigger picture, as long as 0.9879 support holds, medium term up trend form 0.9186 is still in progress. Break of 1.0237 will target 1.0342 resistance next. For now, we'd be cautious on strong resistance from there to limit upside, until we see medium term upside acceleration. However, decisive break of 0.9879 will be a strong sign of medium term reversal. Focus will be turned back to 0.9716 support for confirmation.
USD/JPY Daily Outlook
Daily Pivots: (S1) 109.26; (P) 109.48; (R1) 109.81; More...
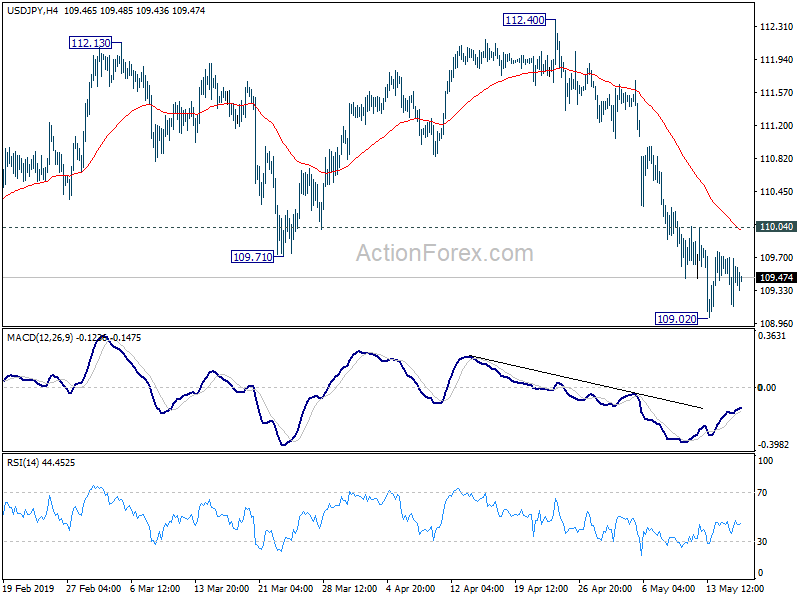
USD/JPY is staying in consolidation from 109.02 temporary low and intraday remains neutral first. Nevertheless, as long as 110.04 resistance holds, further decline is expected. On the downside, break of 109.02 will resume the fall from 112.40 to retest 104.69 low. Nevertheless, break of 110.04 minor resistance will indicate short term bottom. Lengthier consolidation could then be seen before another decline.
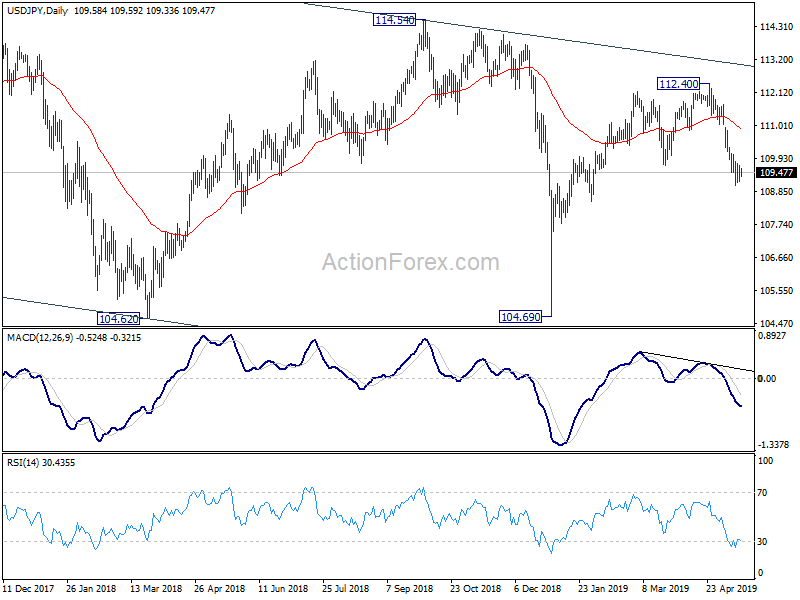
In the bigger picture, USD/JPY is staying inside falling channel from 118.65. Currently development suggests that rebound from 104.69 is only a corrective move. And fall from 118.65 is not completed yet. Decisive break of 104.69 will extend the down trend towards 98.97 support (2016 low). For now, we'd expect strong support above there to bring rebound.
USD/CAD Daily Outlook
Daily Pivots: (S1) 1.3411; (P) 1.3453; (R1) 1.3479; More...
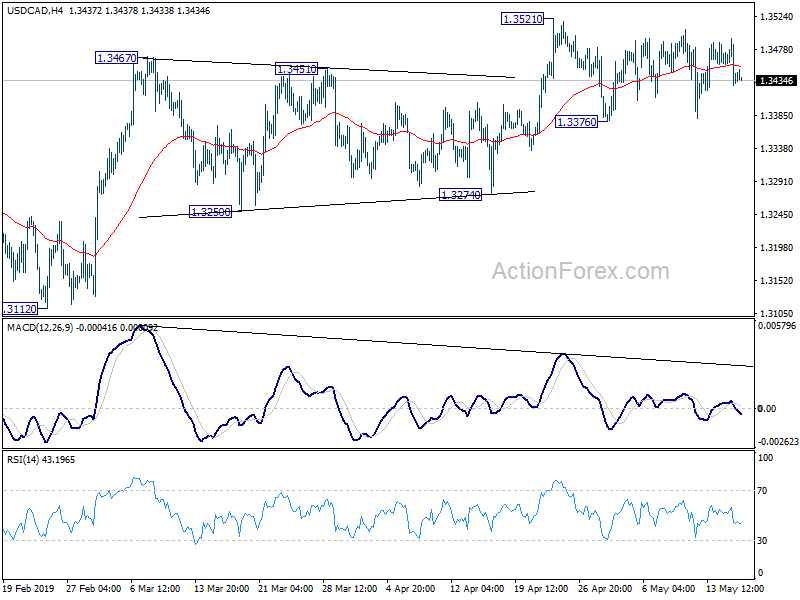
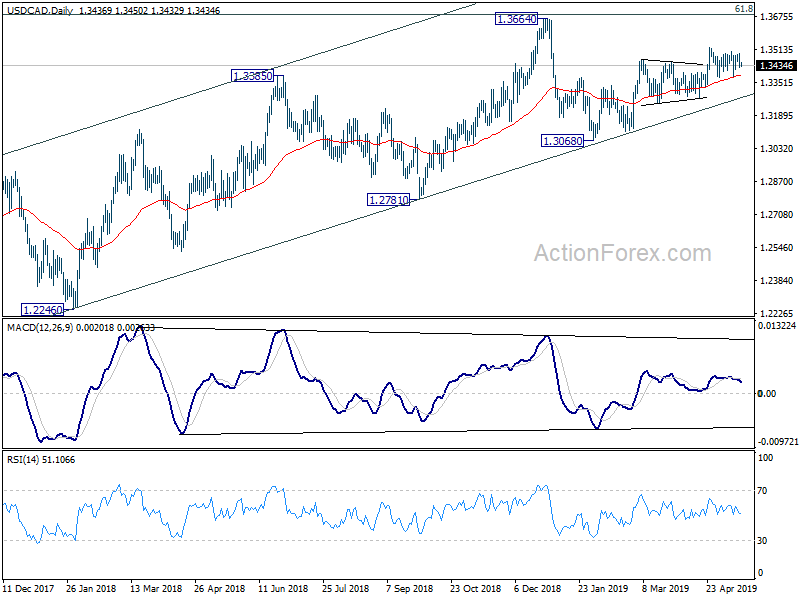
USD/CAD is staying in consolidation from 1.3521 and intraday bias remains neutral first. In case of deeper retreat, downside should be contained above 1.3274 support to bring rally resumption. On the upside, firm break of 1.3521 will resume the whole rise from 1.3068 to retest 1.3664 high. However, decisive break of 1.3274 support will indicate completion of rise from 1.3068 and turn outlook bearish.
In the bigger picture, USD/CAD is staying well inside medium term rising channel (support at 1.3278). Thus, the up trend from 1.2061 (2017 low) should be in progress. On the upside, decisive break of 61.8% retracement of 1.4689 (2016 high) to 1.2061 at 1.3685 will pave the way to 78.6% retracement at 1.4127 next. This will remain the favored case as long as 1.3068 support holds. However, sustained break the channel support will be the first sign of medium term reversal. Firm break of 1.3068 would confirm.
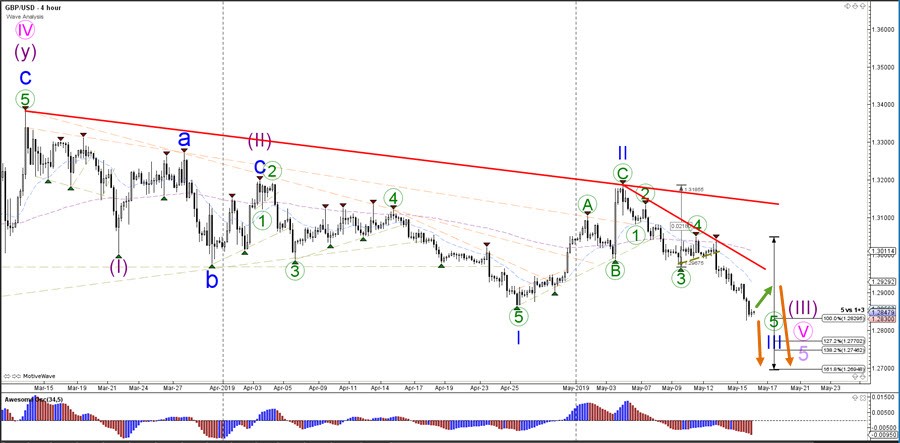
GBP/USD Downtrend Aims For Next Target At 1.2750
The GBP/USD reached the 1.2825 target and could extend its bearish momentum towards the round level of 1.2750. Price could either continue immediately or make a light pullback towards the 1.29 resistance zone. Any bullish price action, however, is expected to be capped and find a resistance spot for a new lower low, which could confirm the wave 3 (blue) pattern.
remains in an indecisive spot from a wave perspective. The main aspect to keep an eye on is whether price bounces or breaks at the top (red) resistance line of the downtrend channel. A bearish continuation, especially below the 100% level, could indicate an impulsive wave 3 pattern whereas a reversal could indicate a bullish wave count instead.
The GBP/USD completed an extended wave 5 (dark red) with 5 extra waves (grey) and now price could be ready for a bullish ABC (dark red) correction within wave 4 (orange). The main resistance zone is the area around the 23.6-50%Fibonacci levels near 1.2875-1.2935. The GBP/USD could also make a bearish breakout if it’s able to push below the support trend line (blue).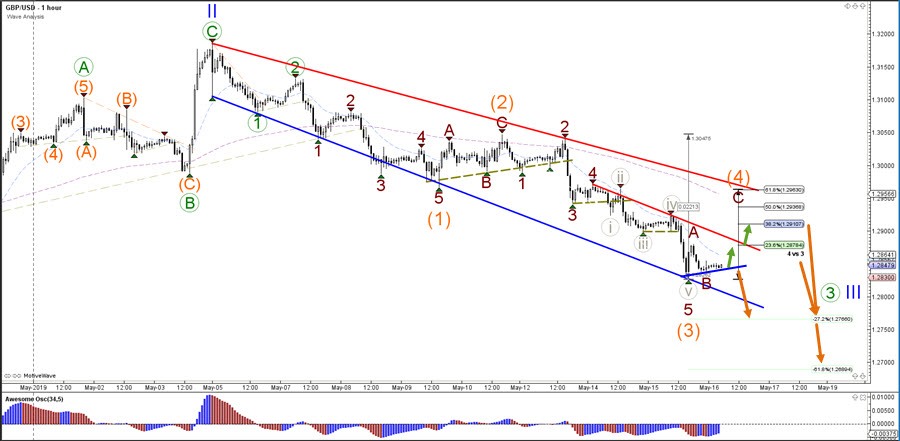
Car Tariff Threat Delayed Rather Than Resolved
Market movers today
The US-China trade war continues to be the most important driver in financial markets. However, in the short term, we may not get much new information as no new measures are likely to be announced from either side. The next thing to look out for would be comments about a new round of talks or a potential phone call between Xi and Trump. It could initially be seen as positive. However, we would caution that the two sides seem quite far from each other on some key elements and we could end up in a war of attrition where it takes financial stress for the two sides to find a compromise.
On the data front we have a batch of US key figures this afternoon. The Philadelphia Fed business confidence index for May will give more clues to the development of the US manufacturing sector.
We will also learn more about the state of the US housing market with the release of building permits and housing starts for April. The housing market has generally seen some improvement in recent months, most likely due to the decline in mortgage rates.
Selected market news
Yesterday, US April retail sales and industrial production figures missed expectations and point to a somewhat soft start to Q2. Across the Atlantic, German GDP growth rebounded to 0.4% q/q in Q1, after narrowly avoiding a recession in H2 18. Domestic demand was again the main growth driver, but part of the recovery in growth rates also reflects the unwinding of H2 18 temporary factors (car sector bottlenecks and low Rhine water levels). While it is encouraging that the domestic side of the economy continues to underpin the growth momentum, the near-term outlook for the German economy remains muted amid gloomy PMI readings, declining factory orders and an escalating trade war between two of Germany's most important export markets.
Added to that, the threat of US car tariffs - with the deadline for Trump's decision coming up on Saturday - is lingering in the background. However, news headlines yesterday suggested that Trump might opt to delay the tariffs by up to six months, as long as negotiations for a trade deal with the EU and Japan are ongoing. However, the executive order has not yet been officially signed by President Trump and even then uncertainty would just be delayed rather than resolved.
Risk sentiment generally remained under pressure as markets grapple with the implications of the intensifying Sino-American trade war, with Trump's latest decision to effectively ban Huawei from selling technology into the American market further deepening the rift. Although shares in US and European automakers cheered the delayed car tariffs, Asian stocks remain in the red this morning and S&P 500 futures point to a lower opening. Yesterday, 10Y Bund yields fell to their lowest level since the autumn of 2016, but pared gains later in the day as news hit about Trump's decision to delay car tariffs.
Euro-Zone’s Economy Grew Less Than Expected In 1Q 2019
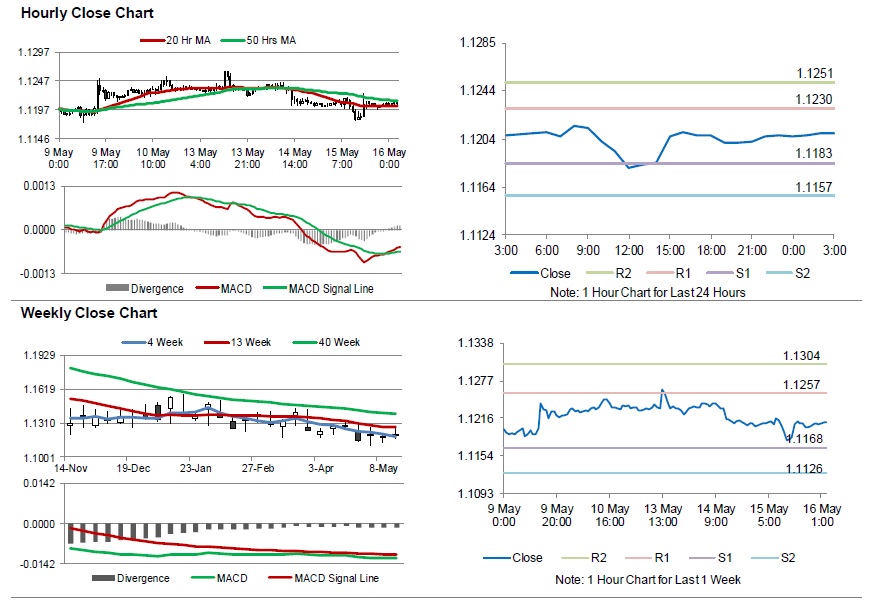
For the 24 hours to 23:00 GMT, the EUR traded flat against the USD and closed at 1.1207.
On the macro front, the Euro-zone's seasonally adjusted flash gross domestic product (GDP) rose 0.3% on a quarterly basis in 1Q 2019, less than market expectations for a rise of 0.4%. In the previous quarter, the GDP had recorded a rise of 0.4%.
Separately, in Germany, the seasonally adjusted flash gross domestic product (GDP) climbed 0.4% on a quarterly basis in 1Q 2019, in line with market expectations and compared to an unchanged reading in the previous quarter.
In the US, data indicated that the NY Empire State manufacturing index unexpectedly rose to a six-month high level of 17.8 in May, compared to market consensus for a fall to a level of 8.0. The index had registered a reading of 10.1 in the previous month. Moreover, the NAHB housing market index climbed to a level of 66.0 in May, notching a 7-month high level and following a level of 63.0 in the previous month. Market participants had anticipated the index to register a to rise to a level of 64.0.
On the other hand, the nation's advance retail sales surprisingly fell 0.2% on a monthly basis in April, defying market expectations for an advance of 0.2%. In the previous month, advance retail sales had registered a revised rise of 1.7%. Further, the US industrial production unexpectedly declined 0.5% on a monthly basis in April, falling to its lowest level in two years amid decrease in demand for automobiles. In the preceding month, industrial production had recorded a revised climb of 0.2%, while market participants had expected for a steady reading. Additionally, the manufacturing (sic) production surprisingly slid 0.5% on a monthly basis in April, signalling a slowdown in the economy due to escalating US-China trade tensions and defying market consensus for an unchanged reading. Manufacturing production had recorded an unchanged reading in the previous month. Also, the MBA mortgage applications retreated to its lowest level in four months by 0.6% on a weekly basis in the week ended 10 May 2019, following an increase of 2.7% in the prior month.
In the Asian session, at GMT0300, the pair is trading at 1.1209, with the EUR trading a tad higher against the USD from yesterday's close.
The pair is expected to find support at 1.1183, and a fall through could take it to the next support level of 1.1157. The pair is expected to find its first resistance at 1.1230, and a rise through could take it to the next resistance level of 1.1251.
Looking ahead, traders would keep an eye on the Euro-zone's trade balance for March, set to release in a few hours. Later in the day, the US housing starts and building permits, both for April and the Philadelphia Fed business outlook for May along with initial jobless claims, will pique significant amount of investors' attention.
The currency pair is trading above its 20 Hr moving average and showing convergence with its 50 Hr moving average.
British Pound Trading A Tad Higher In The Asian Session
For the 24 hours to 23:00 GMT, the GBP declined 0.50% against the USD and closed at 1.2846, amid fears that Prime Minister Theresa May’s proposed Brexit deal will be rejected again in June.
In the Asian session, at GMT0300, the pair is trading at 1.2847, with the GBP trading slightly higher against the USD from yesterday’s close.
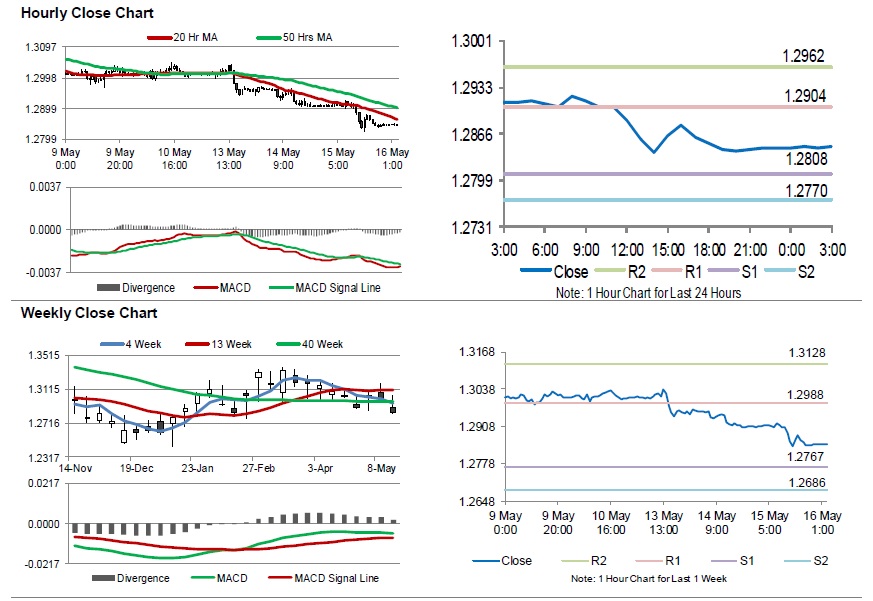
The pair is expected to find support at 1.2808, and a fall through could take it to the next support level of 1.2770. The pair is expected to find its first resistance at 1.2904, and a rise through could take it to the next resistance level of 1.2962.
Amid lack of economic releases in UK today, traders would focus on global macroeconomic events for further direction.
The currency pair is trading below its 20 Hr and 50 Hr moving averages.