

Sample Category Title
Aussie Slides As Australia’s Unemployment Rate Jumps
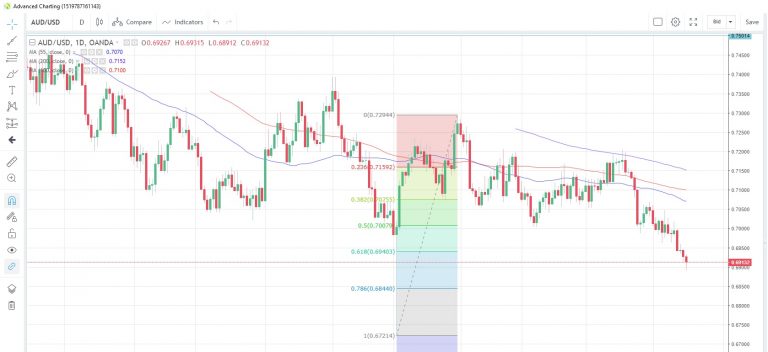
AUD/USD at more than three year low
The unexpected jump in Australia's unemployment rate to 5.2% in April sent the Australian dollar tumbling versus the US dollar as AUD/USD fell through 0.69 to an intraday low of 0.6891, the lowest since January 2016. The uptick in the unemployment rate could be partly explained by an increase in the participation rate to 65.8% from 65.7% in March.
Other parts of the employment report were mixed. The headline change in jobs looked good, an addition of a net 28,400 jobs, but the details showed a loss of 6,300 full-time positions and an increase of 34.700 part-time ones.
AUD/USD Daily Chart
Chances of an RBA cut increase
Overall, the report was taken negatively with the Aussie sliding across the board. Australian three-year bond yields dipped as much as 6bps as expectations rose that the softer jobs report could encourage the central bank to adopt a more dovish bias in its monetary policy. Rates markets pushed the probability of a rate cut at the June meeting to above 50% from 39% yesterday.
More housing data on tap
Today's European data features the Euro-zone trade balance for March, with the surplus seen rising to EUR19.9 billion from EUR17.9 billion. I wonder what Mr. Trump might make of that? The North American session sees US housing starts and building permits for April along with the Philadelphia Fed manufacturing index. Bank of Canada chief Poloz is scheduled to speak along with Fed's Brainard, Bank of England's Haskell and ECB's Coeure.
Daily Markets Broadcast
Wall Street encouraged by prospect of tariff delay
Reports circulated yesterday that President Trump was considering a delay in imposing tariffs on European car imports, which could have come in to effect at the weekend. US indices staged a relief rally despite a weak set of US economic data. Today’s Australian employment report for April could decide whether the RBA adopts a more dovish bias, or not.
US30USD Daily Chart
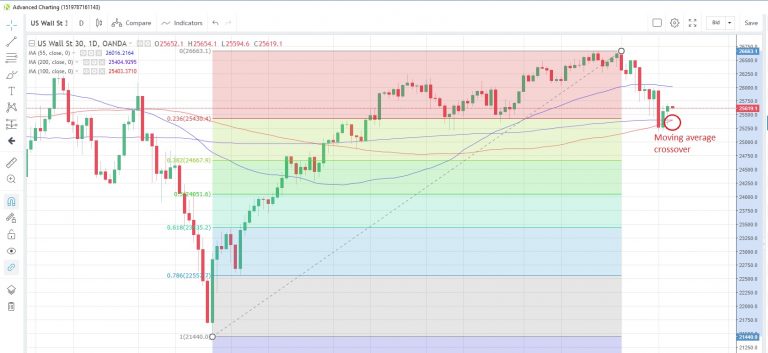
The US30 index extended the recent rebound to a second day yesterday but has edged lower since the open this morning
The 100-day moving average at 25,403 is set to move above the 200-day moving average at 25,404 for the first time since January 28
US retail sales fell 0.2% m/m in April while industrial production contracted 0.5%. Today sees the release of housing starts and building permits for April.
DE30EUR Daily Chart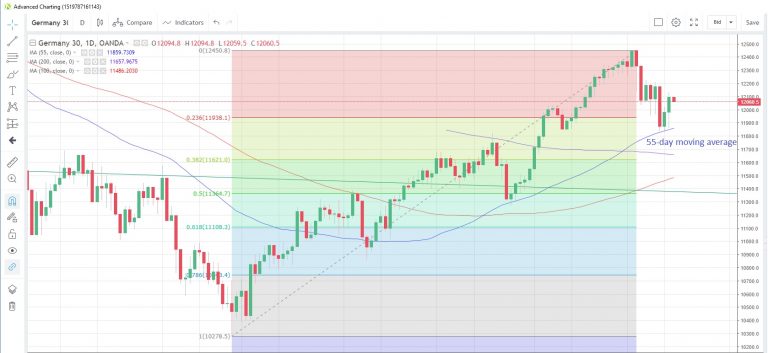
The Germany30 index was given a boost from the prospect of delayed tariffs, posting the biggest one-day gain in almost two weeks yesterday
The 55-day moving average at 11,859 continues to support prices, as it has done on a closing basis since February 8
The Euro-zone trade surplus is seen widening to EUR19.9 billion in March, latest surveys suggest. ECB’s Praet and De Guindos are scheduled to speak today.
AU200AUD Daily Chart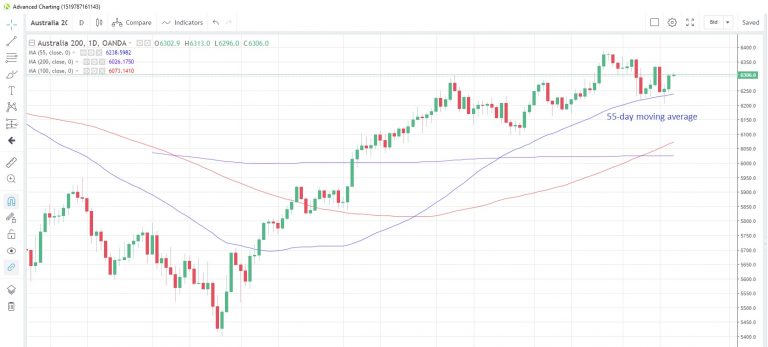
Australian shares look set to advance for a third consecutive day ahead of the release of the April jobs report
The index continues to hold above the 55-day moving average at 6,238, as it has done on a closing basis since January 7
Surveys suggest the Australian economy added 14,000 jobs in April, less than the 25,700 recorded in March. A weaker number could push the RBA into adopting a more dovish outlook for its monetary policy.
Market Morning Briefing: Aussie Has Come Closer To Testing Our Mentioned Levels Of 0.69
STOCKS
While there is no further noise on the US-China trade negotiation front, the focus is now turning on to the tariffs on automobile imports. The tariffs which were supposed to be decided by this Saturday is now expected to be delayed. This has given breather to the US and European equities yesterday. But the Asians seems to remain cautious and are trading in red in early trades today.
Dow (25648.02, +115.97, +0.45%) is holding above 25250 and can rise to 25950-26000 in the near term after which a fresh fall is possible. While the Dow remains below 26250 we retain our bearish view for it to test 25000 or even lower levels in the coming weeks.
The support at 11850 on the DAX (12099.57, +107.95, +0.90%) is continuing to hold well but has resistance near current levels and at 12250 which has to be surpassed to bring back the bullish sentiment. While these resistances hold, a pull-back to 11900 is possible again.
Nikkei (21058.00, -130.56, -0.62%) has a key support at 21000. While it holds a bounce to 21400-21500 is still possible. But a break below 21000 can drag it to 20750.
Shanghai (2944.50, +5.82, +0.20%) is trading near the upper end of its 2850-2950 sideways range. A break above 2950 can take it to 3000. But while 2950 holds, the sideways range will remain intact.
Sensex (37114.88, -203.65, -0.55%) and Nifty (11157.00, -65.05, -0.58%) are consolidating within their downtrend. Sensex is range-bound between 36950 and 37600 while the Nifty is stuck in between 11100 and 11300. The outlook remains bearish and the indices can break their respective range on the downside and fall to 36500-36000 (Sensex) and 11000-10800 (Nifty)
COMMODITIES
The bounce in equities limits the strength in gold. Copper can see a near-term corrective bounce before the overall downtrend resume. Oil holds higher in spite of the higher than expected inventories reported by the US. Oil is getting getting support from the supply disruption fears following the attacks in Saudi Arabia which can push the prices higher in the near term.
Gold (1296) can dip to 1290 as it is not gaining strength. Whether it holds above 1290 or not will decide on the next move. But, as mentioned yesterday, while 1290 holds a rise 1310-1320 is still possible.
Silver (14.77) is stuck around 14.80 and looks vulnerable to test 14.60 again.
Copper (2.74) is holding well above 2.72. A bounce to 2.77-2.78 looks likely after which the downtrend can resume targeting 2.70-2.68.
As expected, Brent (72.20) has moved higher and can test 74 in the near term. What happens after 74 will be crucial to watch. While 74 holds, a pull-back to 72-70 is possible again. But a break above 74 can open doors for 76 or even higher levels in which case our expectation for a fall to 66 will get negated.
WTI (62.45) on the other hand has to surpass its resistance at 63 to rise further to 64 and 65. While 63 holds, a pull-back to 61-60.5 can be seen.
FOREX
Currencies are stable overall. Dollar Index, Euro and Euro –Yen looks stable just now while Aussie and Yuan looks weak against the US Dollar. Immediate direction n Dollar-Rupee is unclear just now.
Dollar Index (97.54) and Euro (1.1207) are almost stable. Euro could test 1.1180 on the downside before again bouncing back from there towards 1.1250. Overall near term looks stable for Dollar index while above 97.00/25 and Euro may trade within the broad 1.1250-1.1150 region for the near term. However, a break below 1.1150 would take it down to lower support near 1.11.
Euro-Yen (122.67) has dipped slightly and could test support near 122 from where we could see a bounce back towards 123 or higher.
Dollar Yen (109.46) has broken below 109.50 and could be headed towards lower support near 109. Note that 109 is a crucial levels from where a bounce could lead to medium term bullishness else the pair could be vulnerable to a sharp fall going forwards. It would be important to see if Nikkei bounces from crucial support at 21000, as such a bounce could pull up Dollar-Yen too in the near term.
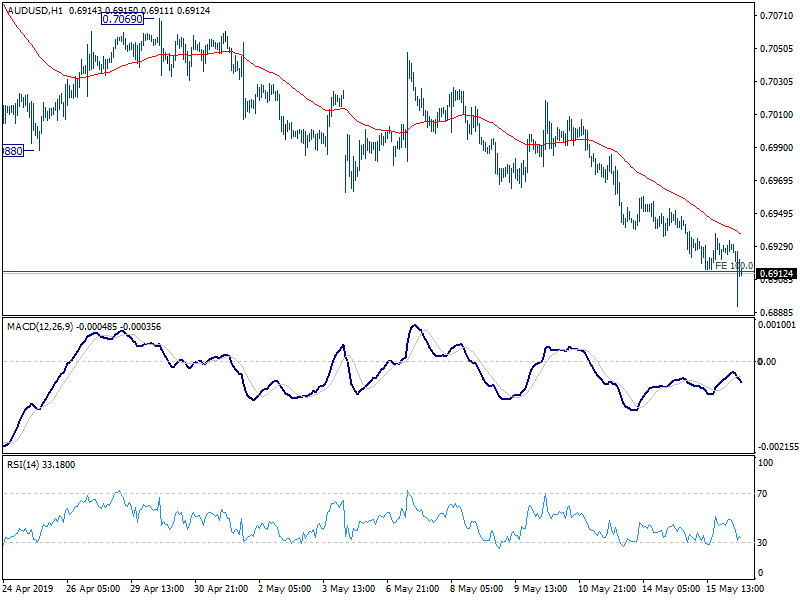
Aussie (0.6911) has come closer to testing our mentioned levels of 0.69. If Aussie sustains below 0.69, it could turn bearish for the coming week towards 0.68 or even lower.
USDCNY (6.8765) has not been able to see a corrective dip and while the bullish momentum remains intact we look for a test of 6.90/91 on the upside. Near term is bullish.
Dollar Rupee (70.3450) held well below 70.60 contrary to our expectation of a rise back towards 70.60 or higher mentioned yesterday. For now 70.20 is an immediate support which if breaks could pull down the pair towards 70.00-69.90. On the other hand if 70.20 holds, we could see trade between 70.20 and 70.60 in the coming sessions. The outlook is unclear on the direction that USDINR will take.
INTEREST RATES
The US yields are down in line with our expectation and look further bearish for the coming sessions. The 30Yr (2.81%), 10Yr (2.37%) and 5Yr (2.14%) have all fallen sharply and may trade lower this week before seeing a small corrective bounce by mid-next week. Long term view is still bearish.
The German-JGB 10Yr (-0.04%) is testing support near current levels and a bounce from here looks possible which could pull up Euro-Yen in the near term. A break in the spread below current levels could be very bearish towards -0.1% but that looks less likely just now.
The US-JGB 10Yr (2.42%) has fallen further as expected and could test lower levels of 2.40-2.35% in the medium term before bouncing back from there. This could be in line with supports at 109 on Dollar-Yen and 21000 on Nikkei.
The Indian 10Yr GOI (7.4766%) has bounced well from 7.40%. Immediate resistance is at 7.48% which if holds could push the yield back towards 7.40%. It would be crucial to see if the yield rises further from here towards 7.50/555 or falls back to test 7.40%. Direction is unclear.
Australian April Labour Force: A Bit For Everyone With Solid Employment Gains & Rising Unemployment
April Labour Force Survey: Total employment: 28.4k from 27.7k (revised from 25.7k). Unemployment rate: 5.2% from 5.1% (revised 5.0%). Participation rate: 65.8% from 65.7% (unrevised 65.7%).
April was a mixed update from the Labour Force Survey. Gains in total employment remain on a robust trend with unemployment rising due to surge in participation. As we noted in our preview while the business surveys suggest that winter is coming for the Australian labour market we remain in the southern hemisphere autumn.
Total employment rose 28.4k in April, stronger than the market median estimate of +15k and Westpac’s estimate of +10k. The three month average is now 22.4k from 24.9k in March and 22.0k in February indicative of sound employment growth so far in 2019.
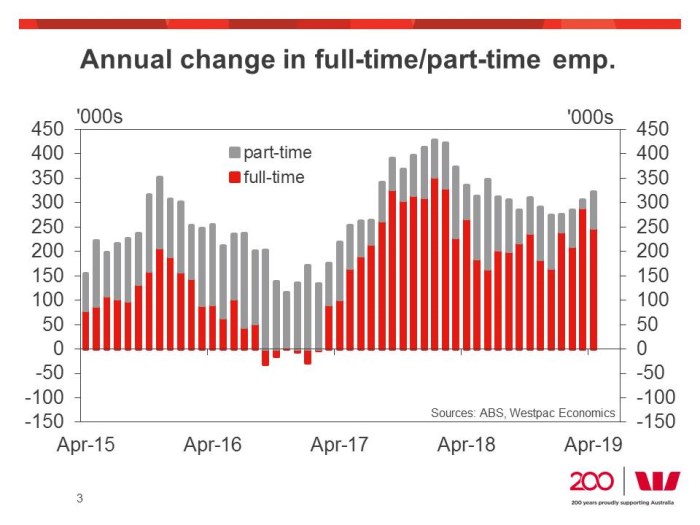
In the year to April employment has lifted 323k or 2.6%yr, an acceleration from the 305k/2.4%yr in March and 274k and 2.2%yr at the end on 2019. For now, the ABS is reporting a much stronger labour market than what is represented in the various business surveys. With the collapse of the employment indicators in the AI Group and NAB business surveys, Westpac’s Jobs Index is now pointing a pace of growth around 2.0%yr by Q4 which is consistent with what Job Ads is suggesting but we caution that ABS Job Vacancies are suggesting a more robust picture.
In the month, full-time employment fell 6.3k in April to be up 248.1k/2.9% in the year while part-time employment gained 34.7k to be up 74.8k or 1.9% in the year. Hours worked lifted 0.1% to be up 1.9%yr, a moderation from the 3.0%yr in March. But it is worth nothing that this year saw Easter and the ANZAC holidays fall very close to each other with many taking advantage of that to have an extended holiday.
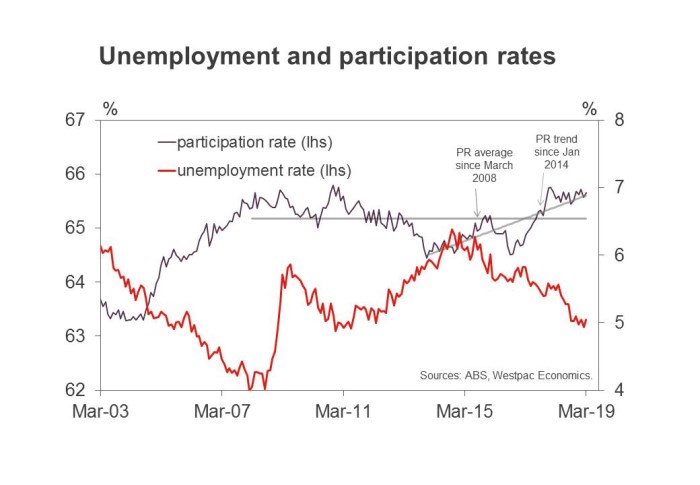
The big surprise in the April survey was the jump in the unemployment rate from 5.1% (was 5.05% revised to 5.07%) to 5.2% (5.20%). This was the result of a jump in the participation rate to a new record high of 65.85%. This jump in participation saw a 49.6k jump in the labour force even though growth in the working age population slowed to +25.9k in April from +39.0k in March.
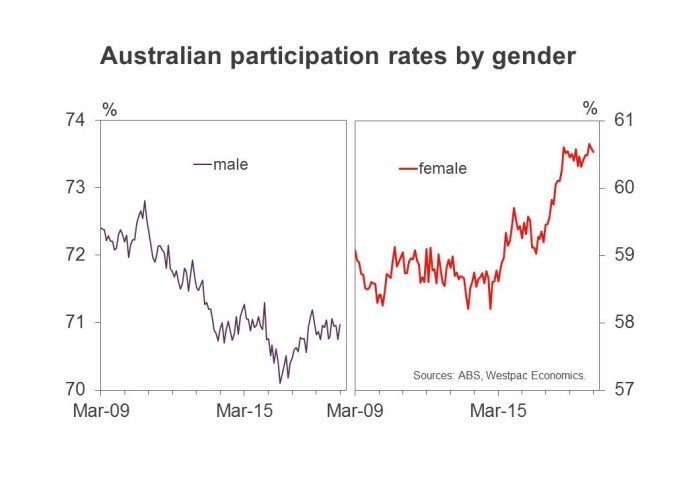
It is worth nothing that the rise in participation continues to be a female story. In the month male participation fell to 70.89% from 70.95% in March while female participation hit a new record high of 60.98% from 60.61% in March.
The impact of rising participation has been significant. If participation had held around the average it was for the last half of 2018 (65.58%) then the unemployment rate in April would have been 4.8%. But we caution that it is normal for strong employment growth to be associated with rising participation, just as it is normal for weak employment growth to be associated with falling participation.
By state, unemployment rose in NSW (4.5% from 4.3%), Victoria (4.9% from 4.6%), South Australian (6.1% from 5.9%), WA (6.1% from 6.0%) and Tasmania (6.8% from 6.7%).
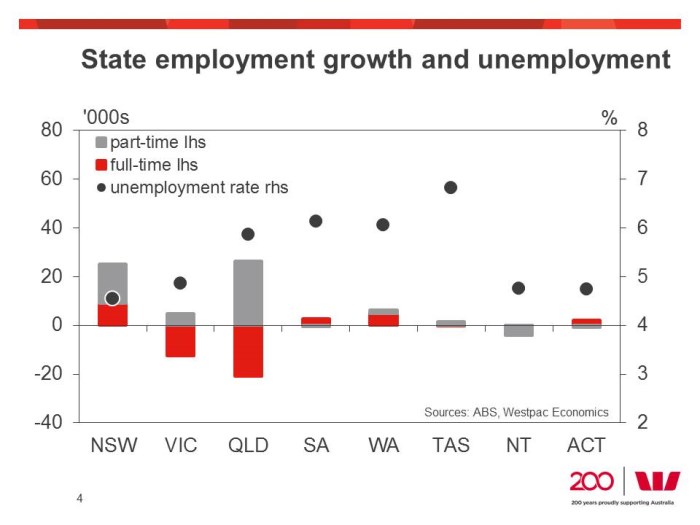
Employment gains in the month were concentrated in NSW (+25.1k), Qld (5.4k) and WA (6.4k). Employment fell in Victoria (–7.6k). In terms of participation NSW saw the largest jump (from 65.2% to 65.6%) while it fell in Victoria (65.9% from 66.0%)
But note, the state that is on the forefront of the downturn in dwelling investment, NSW, has seen the three month average gain in employment slow from 13.2k per month in January to 5.6k per month in April. We are expecting falling house prices in NSW will have a further negative impact on dwelling construction and consumption and thus cyclical employment in that state. But the dwelling construction correction is already more mature in NSW compared to Victoria and we are expecting to see Victorian employment soften as we move through the second half of 2019.
Australian employment grew 28.4k driven by part-time jobs, unemployment rate rose to 5.2%
In April, Australia employment rose 28.4k, more than expectation of 15.2k. However, the growth was mainly driven by 34.7k growth in part-time jobs. Full-time employment contracted -6.3k. Unemployment rate rose to 5.2%, up from 5.1% and above expectation of 5.0%. That's also an eight-month high. But participation rate also rose 0.2% to record high of 65.8%.
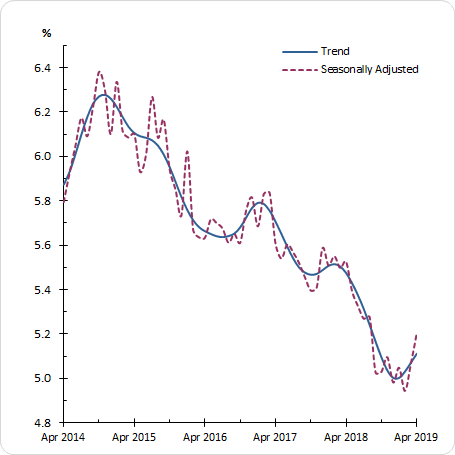
Looking at some details, in seasonally adjusted terms, the largest increase in employment was in New South Wales (up 25.1k), followed by Western Australia (up 6.4k) and Queensland (up 5.4k). The only decrease was in Victoria (down 7.6k).
The seasonally adjusted unemployment rate increased in New South Wales (up 0.2 pts to 4.5%), Victoria (up 0.2 pts to 4.9%), South Australia (up 0.2 pts to 6.1%), Western Australia (up 0.1 pts to 6.1%) and Tasmania (up 0.1 pts to 6.8%). The only decrease was observed in Queensland (down 0.2 pts to 5.9%).
AUD/USD dipped notably after the release but quickly recovered. While the set of job data isn't stellar, it's actually not too bad.
BoJ Wakatabe: QQE has clearly positive impact on the economy and prices
BoJ Deputy Governor Masazumi Wakatabe reiterated to the parliament that the quantitative and qualitative easing program (QQE) had "clearly positive" impact of the economy and prices. And, benefits of easing is "outweighing" its costs.
He admitted that BoJ hasn't put a sustained end to deflation yet while inflation remains below 2% target. But he emphasize "we're seeing an end to a long period of time when consumer prices kept falling."
On exit, he said "how an exit from easy policy affects BOJ's balance sheet would depend on various factors such as means, the order in which it exits."
Canada Freeland: With steel tariffs in place, ratification of USMCA would be very, very problematic
Despite all the talks and rumors that the US is close to lifting steel and aluminum tariffs on Canada and Mexico, Canadian Foreign Affairs Minister Chrysita Freeland left no hints on the progress after she met US Trade representative Robert Lighthizer yesterday.
Freeland acknowledged that there were discussions regrading the tariffs but and details were provided. Instead, she just noted "Canada believes in the new [USMCA] agreement that we reached with the United States and Mexico," and "we very much hope it can be ratified in all of our countries, although the domestic processes are up to each country." She emphasized, "when it comes to Canada, it is certainly the case for us that as long as the tariffs remain in place, ratification would be very, very problematic."
Mexico's chief North American trade negotiator Jesús Seade said earlier this week "Very quickly we have made a tremendous progress and I'm looking to an early resolution on the basis of lifting the tariff, no quotas. We were getting close to an agreement." Mexican Secretary of Economy Graciela Márquez Colín also said "if we get similar proposals we might go into a trilateral, but that's just a possibility". But Freeland said she would "leave it to the Mexicans and the Americans to comment."
US Treasury Secretary Steven Mnuchin told a Senate Committee yesterday that "the president has instructed us to try to figure out a solution" on steel and aluminum tariffs." And, "this is a very important part of passing USMCA which is a very important economic agreement for two of our largest trading partners... I think that we are close to an understanding with Mexico and Canada. I've spoken to the finance ministers. Ambassador Lighthizer is leading the effort on this, but I can assure you it is a priority of ours."
Fed Barkin: No strong case for rate hike nor rate cut
Richmond Fed President Tom Barkin said in a speech yesterday that "there's not a strong case to push rates higher when inflation is under control". At the same time "there's not a strong case to move lower when growth remains healthy." And, "it makes sense to remain patient" on monetary policy.
He noted that there was a short term sentiment shock at the end of last year and the beginning of this year. The significant drop in business, consumer and investor confidence was only fueled by "overreacting" to international uncertainty, financial market volatility and the government shutdown.
He added that business contacts told him the economy is "sound but not spectacular". And, consumers are ready to resume spending once the environment settled. Though business recovery looks to be slower and they're worried about political polarization and international markets and trade. Barkin noted "confidence—especially business confidence—is fragile."
On monetary policy, he emphasized: "In a volatile environment, rate moves can indicate more than stimulation or restriction. They are also taken as signals on the health of the economy. Counter-intuitively, then, rate moves can send unintended messages."
Full speech Sentiment and the Real Economy.
US Crude Oil Inventory Jumped to Highest Level since 2017
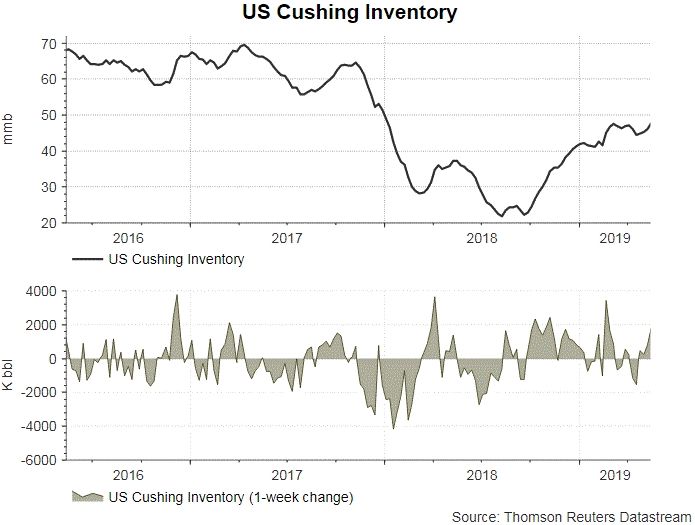
The report from the US Energy Information Administration (EIA) shows that total crude oil and petroleum products (ex. SPR) stocks surged +14.64 mmb to 1270.26 mmb in the week ended May 10. Crude oil inventory rose 5.43 mmb to 472.04 mmb (consensus: -0.8 mmb). While this marks the highest level since 2017, about +1.8 mmb of which was due to the release of the national emergency reserve. Inventories rose in 4 out of 5 PADDs with PADD 3 (Gulf Coast) seen a +2.93 mmb increase. Meanwhile, Cushing stock added +1.81 mmb to 47.8 mmb. Utilization rate added +1.6% to 90.5% while crude production slipped -0.1M bpd to 12.1M bpd for the week. Crude oil imports increased +0.92M bpd to 7.61M bpd in the week.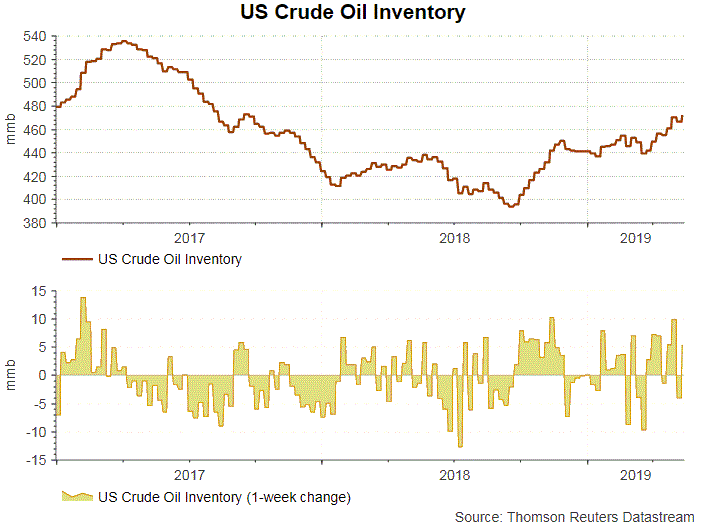
Concerning refined oil product inventories, gasoline inventory dropped -1.12 mmb to 225.02 mmb as demand slipped -7.32% to 9.15M bpd. The market had anticipated a -0.3 mmb drop in stockpile. Production slipped -2.14% to 9.91 bpd while imports plunged -32.5% to 0.75M bpd during the week. Distillate inventory climbed higher, by +0.08 mmb, to 125.65 mmb. Demand gained +5.08% to 4.09M bpd. The market had anticipated a -1.01 mmb decline in inventory. Imports slumped -63.06% to 0.04M bpd while production gained +3.44% to 5.26M bpd during the week.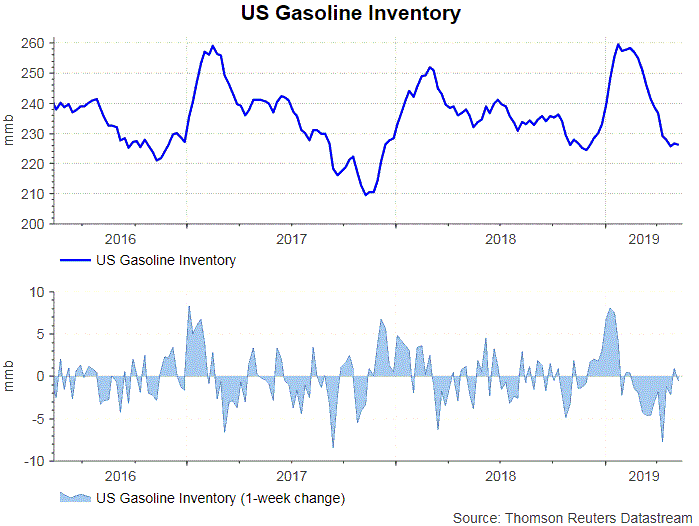
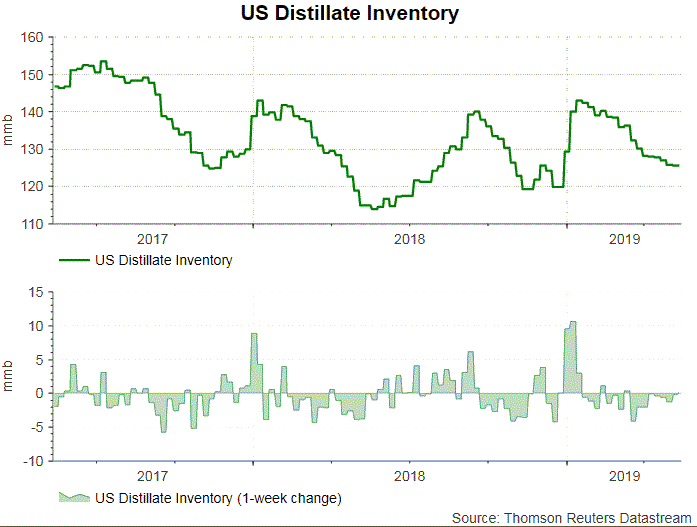 Released after market close on Wednesday, the industry- sponsored API estimated that crude oil inventory jumped +8.6 mmb during the week. For refined oil products, gasoline stockpile drew +0.567 mmb while distillate added +2.2 mmb.
NZD/USD Could Accelerate Decline Below 0.6540
Key Highlights
- The New Zealand Dollar is in a strong downtrend below 0.6600 against the US Dollar.
- A major bearish trend line is forming with resistance at 0.6580 on the 4-hours chart of NZD/USD.
- The US Retail Sales in April 2019 declined 0.2% (MoM), whereas the forecast was +0.2%.
- The US Initial Jobless Claims for the week ending May 11, 2019 may slide from 228K to 220K.
NZDUSD Technical Analysis
Earlier this month, the New Zealand Dollar started a strong decline below 0.6600 against the US Dollar. The NZD/USD pair recovered recently, but upsides were capped by the 0.6600-0.6610 resistance.
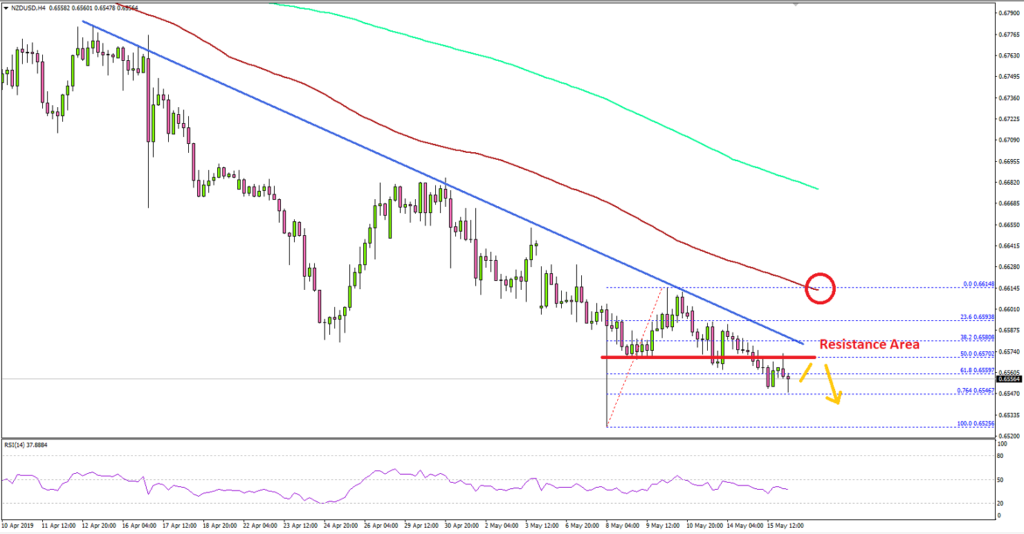
Looking at the 4-hours chart, the pair traded as low as 0.6525 and recently corrected above 0.6550 and 0.6580. However, the pair struggled to hold gains above 0.6600 and stayed well below the 100 simple moving average (4-hours, red).
A swing high was formed at 0.6614 and the pair started a fresh decline below 0.6580 plus the 50% Fib retracement level of the recovery from 0.6525 to 0.6614.
The pair is clearly under pressure and if there is a close below the 0.6540 support, there could be a downside extension below the 0.6525 swing low. The next key supports are 0.6500 and 0.6485.
On the upside, there is a major bearish trend line forming with resistance at 0.6580 on the same chart. Besides, the pair must settle above the 0.6600 resistance to start a strong rebound towards 0.6640 and 0.6650 in the near term.
Fundamentally, the US Retail Sales figure for April 2019 was released by the US Census Bureau. The market forecast was a 0.2% rise in sales in April 2019, compared with the previous month.
The actual result was disappointing, as there was a 0.2% decline in sales. On the other hand, the last reading was revised up from 1.6% to 1.7%. Looking at the Retail Sales ex Autos, there was a 0.1% rise, less than the +0.7% forecast.
The report added:
Total sales for the February 2019 through April 2019 period were up 3.0 percent (±0.7 percent) from the same period a year ago. The February 2019 to March 2019 percent change was revised from up 1.6 percent (±0.5 percent) to up 1.7 percent (±0.2 percent).
Overall, as long as NZD/USD is below 0.6600, there is a risk of more losses. Looking at GBP/USD, there was a sharp decline below the 1.2950 and 1.2900 supports. EUR/USD also struggled and traded below the 1.1215 support.
Economic Releases to Watch Today
- US Housing Starts April 2019 (MoM) – Forecast 1.205M, versus 1.139M previous.
- US Building Permits April 2019 (MoM) – Forecast 1.298M, versus 1.288M previous.
- US Initial Jobless Claims – Forecast 220K, versus 228K previous.