Sample Category Title
EUR/USD And USD/CHF Remains At Risk Of More Losses
EUR/USD failed to stay above the 1.1260 level and recently declined below 1.1220. USD/CHF declined heavily towards 1.0050 and it is currently correcting towards key resistances.
Important Takeaways for EUR/USD and USD/CHF
- The Euro topped near the 1.1263 level and declined recently below 1.1220 against the US Dollar.
- There was a break below a connecting bullish trend line with support at 1.1228 on the hourly chart of EUR/USD.
- USD/CHF declined heavily in the past few days and traded close to the 1.0050 level.
- Recently, it recovered above a major bearish trend line with resistance near 1.0070 on the hourly chart.
EUR/USD Technical Analysis
The Euro formed a decent support near the 1.1170 and 1.1175 levels against the US Dollar. The EUR/USD pair traded higher above the 1.1240 level, but it struggled to hold gains above the 1.1260 level.
A swing high was formed at 1.1263 on FXOpen and the pair recently started a downside correction. It broke the 1.1240 and 1.1220 levels to enter a bearish zone.
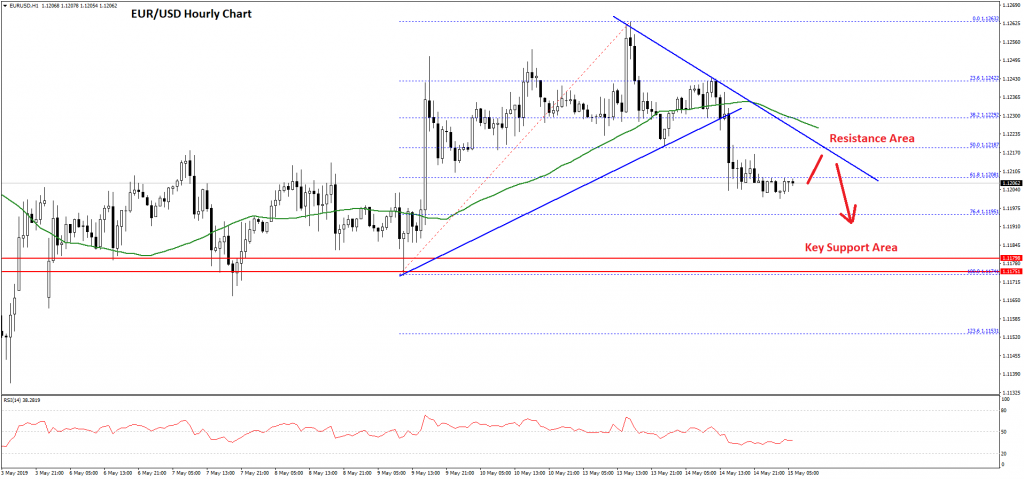
There was also a break below a connecting bullish trend line with support at 1.1228 on the hourly chart. Besides, the pair settled below the 1.1220 level and the 50 hourly simple moving average. It cleared the 50% Fib retracement level of the last wave from the 1.1174 low to 1.1263 high.
The pair is currently under pressure and it seems like it could continue to move down in the near term. An immediate support is near the 1.1195 level, plus the 76.4% Fib retracement level of the last wave from the 1.1174 low to 1.1263 high.
If there is a break below the 1.1195 support, the pair is likely to test the main 1.1175 support area. On the upside, there is a connecting bearish trend line forming with resistance at 1.1225.
To start a fresh increase, EUR/USD must break the 1.1225 resistance level and settle above the 50 hourly simple moving average. If it fails to recover above 1.1225, there is a risk of an extended decline below 1.1175.
USD/CHF Technical Analysis
The US Dollar started a significant downward move from well above the 1.0200 level against the Swiss franc. The USD/CHF pair broke the main 1.0150 support level to enter a bearish zone.
During the recent decline, the pair even broke the 1.0100 support and the 50 hourly simple moving average. It traded close to the 1.0050 level and recently started an upside correction.
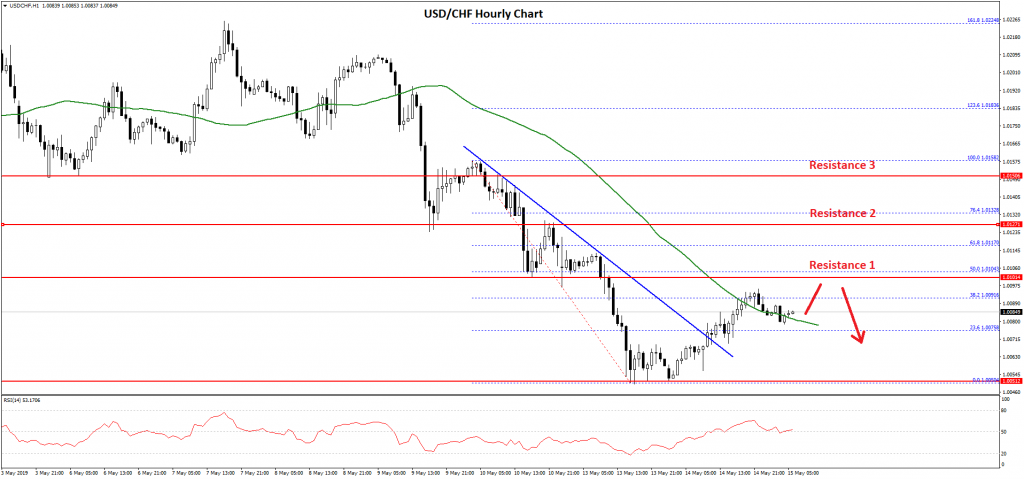
It recovered above a major bearish trend line with resistance near 1.0070 on the hourly chart. It recently tested the 38.2% Fib retracement level of the latest drop from the 1.0158 high to 1.0050 low.
On the upside, there are many resistances near the 1.0100 and 1.0110 levels. The 50% Fib retracement level of the latest drop from the 1.0158 high to 1.0050 low is also near the 1.0104 level to act as a strong resistance.
Above 1.0110, the pair could test the 1.0120 level. However, a strong upward move above 1.0100 won’t be easy. If USD/CHF fails to climb above the 1.0100 level, there is a risk of another push below the 1.0070 level.
The next key support for USD/CHF is near the 1.0050 level, below which the pair could test 1.0020 in the near term.
Market Morning Briefing: USDCNY Is Trading Stable
STOCKS
Equities get a breather as there is no further developments/surprises on the US-China trade war front. While this scenraio continues we might see some more short-covering rally in the global equities in the coming days. However, we remains cautious as the broader picture is negative and a fresh fall after a few sessions cannot be ruled out.
Dow (25532.05, +207.06, +0.82%) can test 25800-26000 in the near term after which a pull-back to 25250-25000 is possible. While below 26000 the outlook will continue to remain bearish.
The support at 11800 seems to be holding well on the DAX (11991.62, +114.97, +0.97%) as of now. It will have to be seen if it can rise past 11200 from here which will turn the outlook bullish. For now a rise to 12150 looks likely.
Nikkei (21104.17, +36.94, +0.18%) can test 21450-21500 while it sustains above 21000.
Shanghai (2915.73, +32.13, +1.11%) continues to consolidate between 2850 and 2950. We have to wait for it to break on either side of this range to get a cue on whether it is going up to 3000 or falling to 2800.
Sensex (37318.53, +227.71, +0.61%) is holding above 37000 and Nifty (11222.05, 73.85, 0.66%) above 11100. While these supports hold, a corrective rally to 38000 on the Sensex and 11350-11400 on the Nifty can be seen in the near term.
COMMODITIES
Recovery in equities has capped the upside in Gold for now. But a further rise in gold in the near term is still possible before we see a fresh fall. Silver can remain range bound. Copper is bearish. Brent has inched higher within its sideways consolidation after the attack on a pumping station in Saudi Arabia.
Gold (1297.3) has failed to see strong follow-through buying above 1300. However, while above its support at 1290, a rise to 1310 and 1320 is still possible in the near term.
Silver (14.8) is stuck around 14.8 and looks unclear at the moment. Within its broad 14.6-15.0 sideways range, Silver has equal chances for either a rise to 15 or a fall to 14.6 from current levels.
Copper (2.73) is struggling to bounce. As mentioned yesterday, the resistance at 2.75 can cap the upside and keep the downtrend intact for a test of 2.70-2.68.
WTI (61.72) continues to oscillate around 62. Whether this is a consolidation before a fresh rise to 64-66 or fall to 60-58 remains unclear at the moment. The US inventory data release today migth give some trigger to set the direction of move from here.
Brent (71) is holding above 69 and has high chances for a rise to 73-74 in the near term.
FOREX
Hope of some talks between China and US brings some relief to the markets. Dollar trades strong and looks bullish for the near term.
USDCNY (6.8727) is trading stable. It would now be important to see if the pair breaks above interim resistance at 6.90/91 or faces stiff rejection from there and falls back towards 6.85 or lower from 6.90/91 itself. While no fresh uncertainties emerge, we may expect 6.90/91 to hold on the first testing.
Dollar Index (97.53) is trading near the 97 support and the 3-day and weekly charts suggest a possibility of a sharp rise in the near to medium term. The bullish sentiment towards 98-99 remains intact while the index remains above 97.
Euro (1.1204) has fallen from levels seen yesterday and while the currency moves below 1.12, it could attempt a fall towards 1.11 in the coming sessions.
Euro-Yen (122.88) has again come off contrary to our expectation of a rise back towards 123.30/50. While below 123, there is scope for re-testing support near 122.
Dollar Yen (109.65) is trying to rise a bit and could be fairly trading above 109.00/50 in the near term. A break above 110 would take it higher towards 111 at a faster pace.
Dollar Rupee (70.4450) came down from our earlier mentioned 70.60 contrary to our expectation of a possible rise towards 70.80/90. While we do not negate this upside possibility just now, near term could see another attempt towards 70.60. Note that the Saudi Arabia oil attacks yesterday has pulled up Brent Crude to 71.08 and this could possibly take Dollar Rupee higher in today’s session. We would keep an eye on price movement if it re-tests 70.60.
Aussie (0.6931) has dipped a bit and while below 0.6950, it could test 0.69.
INTEREST RATES
The US yields have fallen and looks weak for the near term. The 30Yr (2.85%), 10Yr (2.41%) and 5Yr (2.19%) have fallen by 1bps and as mentioned yesterday, could continue to move down towards 2.80% (30Yr), 2.40% (10YR) and 2.17% (5Yr) respectively before bouncing back from there.
The US-JGB 10Yr (2.46%) is down by 1bps and has enough scope to fall towards 2.45/40% in the near to medium term. View remains bearish.
The Indian 10Yr GOI (7.4560%) came down sharply to test crucial support near 7.4090% yesterday and while that holds, the yield could now move up towards 7.50/55% in the coming sessions.
Australia: Consumer Sentiment Steady For The Month
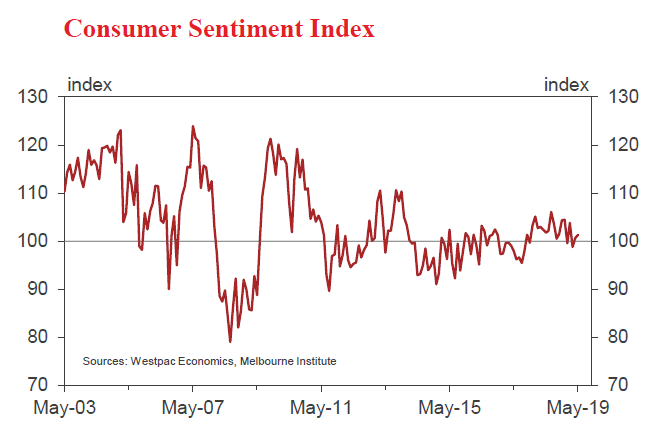
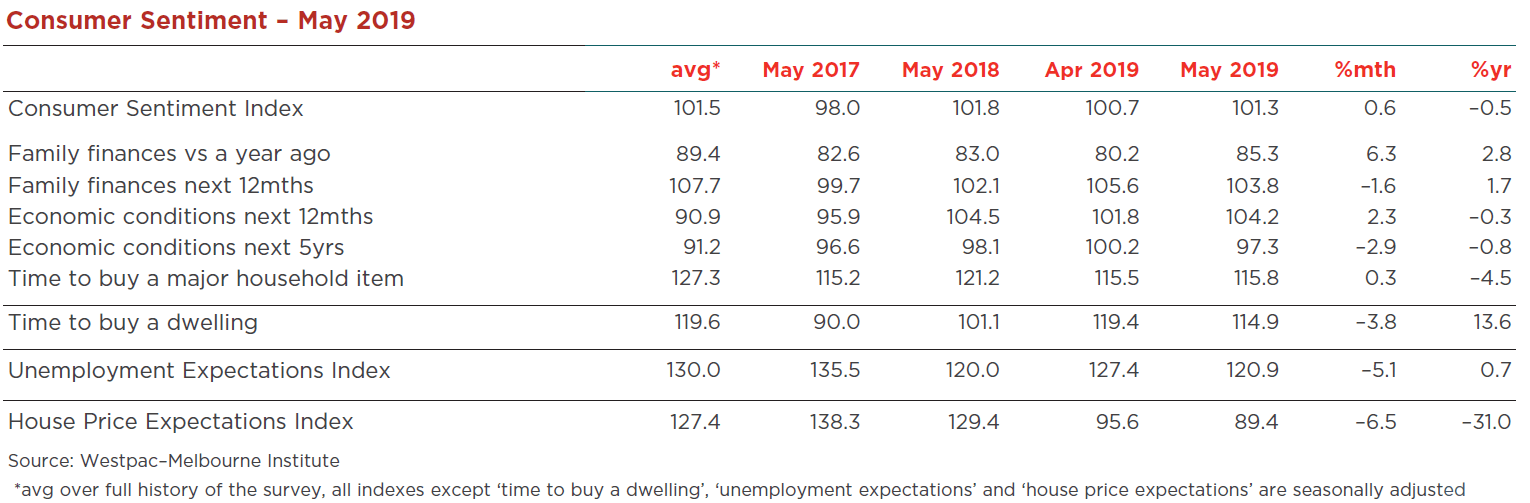
The overall movement in the Index in May is modest. It is also important to note that the Index has held above 100 for ten of the last twelve months.
Last month's survey showed a clear boost from the Federal Budget, which was in the middle of the April survey period. Readings before the Budget announcement were much lower than in the post Budget period, indicating that it had been well received by consumers.
Indeed the post-Budget Index reading was 104.3 meaning that sentiment in May has deteriorated by around 3% compared to post Budget levels. This probably reflects some ‘cooling off' from the initial confidence boost, which was substantial.
Despite the Reserve Bank ultimately deciding not to cut the cash rate at its May Board meeting it is likely that households are much more confident this month than previously that interest rates are likely to come down further. Media coverage both pre and post the Reserve Bank decision is pointing strongly to eventual interest rate relief.
The component indexes showed mixed moves this month. The sub-index tracking assessments of ‘family finances vs a year ago' showed a strong 6.3% gain in May. The post Budget survey result surprisingly showed no real lift in this component. The May lift is probably reflecting a delayed positive response to the Budget, along with the more optimistic outlook for interest rates. Note that this component had fallen by 10% over March/April and remains well below its long run average level.
Consumer expectations for ‘family finances next 12 months' slipped 1.6% following a solid 4.1% lift in April that reflected the tax measures in the Budget. However, this component is also below its long run average.
Sentiment around the economy also had a mixed month, with the ‘economic outlook, next 12 months' sub-index rising 2.3% but the ‘economic outlook, next five years' sub-index declining 2.9%.
Attitudes towards spending were largely unchanged with the ‘time to buy a major household item' sub-index edging up 0.3% to 115.8, a positive read but down 4.5% on a year ago and well below the long run average of 127 and the post Budget print of 121. The readings around both current finances and ‘time to buy a major item' remain consistent with the weak consumer spending growth seen through the second half of 2018 and the flat real retail sales print for the March quarter.
Job loss fears eased again in May. The Westpac-Melbourne Institute Unemployment Expectations Index recorded a 5.1% decline (recall that lower readings indicate that fewer consumers expect unemployment to rise in the year ahead). At 120.9 the index is back near recent lows and still comfortably below the long run average of 130.
Sentiment around housing deteriorated in May. The ‘time to buy a dwelling' index fell 3.8% to 114.9 in May, retracing from what was a four year high in April. The index has risen 28% from its mid-2017 low but is below its long run average of 120. Improving affordability continues to see a lift in buyer sentiment in New South Wales and Victoria with the May pull back more pronounced in Queensland and Western Australia.
The Westpac-Melbourne Institute Index of House Price Expectations posted a 6.5% drop, partially retracing the surprisingly strong 11.9% rise in April. Price expectations have been particularly volatile in New South Wales in recent months, but have still improved slightly since the start of the year. In contrast, price expectations have been pared back in Queensland and Western Australia, the latter showing a particularly sharp fall into negative territory and a two and a half year low in May.
The Reserve Bank Board next meets on June 4. On February 21 Westpac predicted that the Board would adopt an easing bias at its May meeting prior to cutting the cash rate at its August and November meetings.
Last week we saw the easing bias delivered following the May meeting and the Statement on Monetary Policy. The Bank has lowered its growth and inflation forecasts to levels that are barely acceptable – slightly below trend for growth and below 2% for core inflation.
Importantly, those forecasts are based on market pricing for interest rates which have a full rate cut priced in for August and another fully priced for the first half of 2020 – slightly more cautious than Westpac's forecasts.
So, even with rate cuts, the Bank's forecasts are barely acceptable. However the Bank is still somewhat puzzled by the tension between strong labour market prints (supported by today's survey) and the weak GDP and partial data. We expect that will be resolved over the next few months with the case for the August cut becoming clear. Markets and many commentators are more impatient, expecting a move as early as the June meeting. We think it will take more than one or two months' data for the issue to be resolved by the Bank
Aussie drops after wage price miss, consumer sentiment barely rose
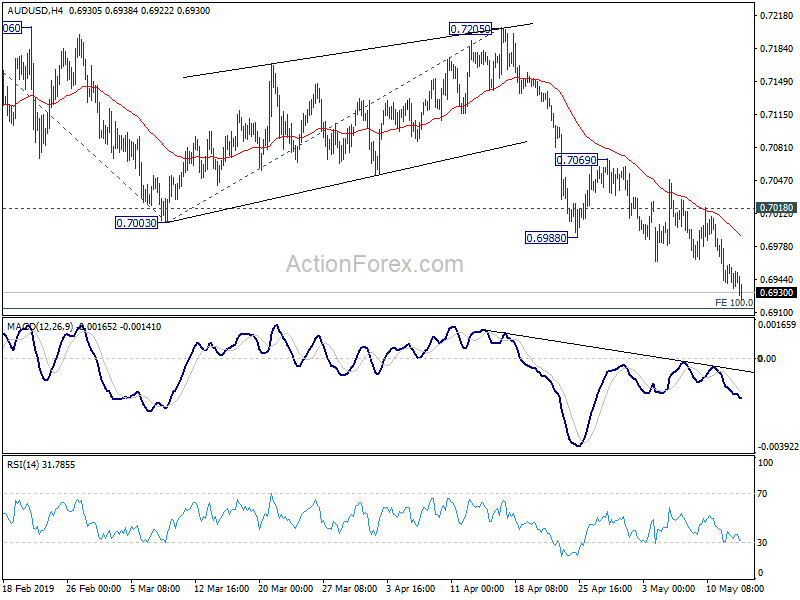
Australian Dollar weakens broadly today and is trading as the worst performing one for today. The Aussie is partly dragged down by poor Chinese data. It's own data provide no help too.
Wage Price Index rose only 0.5% qoq in Q1, below expectation of 0.6% qoq. ABS Chief Economist Bruce Hockman said: "Annual wages in seasonally adjusted terms grew 2.3 per cent for the third quarter in a row. The main contributors to growth over the quarter were regularly scheduled wage rises in the Health care and social assistance and Education and training industries, as was the case in the previous March quarter."
Westpac Consumer Sentiment rose 0.3% to 101.3 in May, up from 100.7. Westpac noted that easing bias was delivered by RBA at last week's meeting, with growth and inflation forecasts lowered to "barely acceptable" levels. More importantly, such forecasts are based on market pricing for a full rate cut for. Westpac maintained that the tensions between strong labor market and weak GDP will be resolved over the next few months. And the case of August RBA cut would become clear.
AUD/USD is on track to 100% projection of 0.7295 to 0.7003 from 0.7205 at 0.6913 with today's decline. We'll pay attention to downside acceleration should this level be broken firmly.
China retail sales growth slowed to lowest since 2003, industrial production and fixed asset investment missed too
Despite the rebound in US stocks overnight, Asian markets are mixed. Upside of recovery was capped by poor data from China. It's now rather apparent that the rebound in March was just temporary due to seasonal reasons. The slowdown in China is in place and could even worsen further as trade war with US drags on.
China industrial production growth slowed to 5.4% yoy in April, missed expectation of 6.5% yoy. That's also sharp deterioration from 4-year high of 8.5% yoy in March. Fixed-asset investment growth slowed to 6.1% ytd yoy, down from 6.3% and missed expectation of 6.4%.
More seriously, retail sales growth slowed to 7.2% yoy, down from 8.7% yoy and missed expectation of 7.2% yoy. That's also the lowest growth since May 2003. That dents hope of shifting the burden of the economy from exports to domestic demand growth. Unemployment rate, though, dropped to 5.2%.
UK PM May plans to bring back Brexit bill on June 3
UK Prime Minister Theresa May laid out her "plan" to complete the Brexit withdrawal agreement by the end of next month. Her spokesman said May is planning to put forward the bill again in the week beginning June 3. And he added "it is imperative we do so then if the UK is to leave the EU before the summer parliamentary recess."
May's Cabinet agreed to press head with talk with opposite Labour a meeting. As "Ministers involved in the negotiations set out details of the compromises which the government was prepared to consider in order to consider an agreement which would allow the UK to leave the EU with a deal as soon as possible." And, "it was agreed that it is imperative to bring forward the Withdrawal Agreement Bill in time for it to receive royal assent by the summer parliamentary recess."
However opposition Labour leader Jeremy Corbyn remained doubtful on the May's plan. His spokesman said Corbyn raised doubts over the credibility of government commitments, following statements by Conservative MPs and cabinet ministers seeking to replace the prime minister."
Gold Price Turns Positive Above $1,290, Could Test $1,310
Key Highlights
- Gold price started a fresh increase above $1,285 and $1,290 resistances against the US Dollar.
- A key bullish trend line is forming with support at $1,290 on the 4-hours chart of XAU/USD.
- The US Import Price Index advanced 0.2% in April 2019 (MoM), less than the +0.7% forecast.
- The US Retail Sales in April 2019 could increase 0.2% (MoM), less than the last +1.6%.
Gold Price Technical Analysis
After forming a support base above $1,265, gold price started a strong upward move against the US Dollar. The price broke the key $1,280 and $1,290 resistance levels to move into a positive zone.
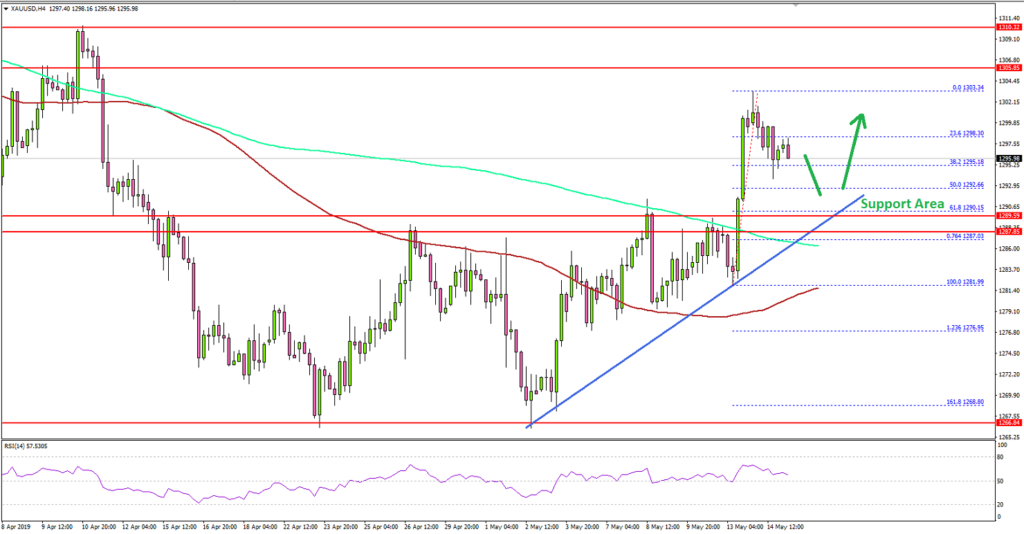
The 4-hours chart of XAU/USD indicates that the price gained bullish momentum after it broke the $1,288 pivot level and the 100 simple moving average (4-hours, red).
Finally, there was a close above $1,292 and the 200 simple moving average (4-hours, green). It opened the doors for more gains and the price climbed above $1,300. A swing high was formed near $1,303 and the price is currently correcting lower.
An immediate support is near $1,292 and the 50% Fib retracement level of the latest wave from the $1,281 swing low to $1,303 high. More importantly, there is a key bullish trend line forming with support at $1,290 on the same chart.
The main support is near $1,290 and the 61.8% Fib retracement level of the latest wave from the $1,281 swing low to $1,303 high. As long as the price is above $1,290 and the 200 SMA, it is likely to continue higher.
A break above the recent high at $1,303 might push the price towards the $1,308 and $1,310 resistance levels in the near term.
Looking at the major pairs, EUR/USD failed once again near the 1.1265 resistance area and GBP/USD traded below a couple of important supports near the 1.2950 level.
Economic Releases to Watch Today
- German GDP Q1 2019 (YoY) (Prelim) – Forecast 0.7%, versus 0.6% previous.
- German GDP Q1 2019 (QoQ) (Prelim) – Forecast 0.4%, versus 0% previous.
- Euro Zone GDP Q1 2019 (QoQ) (Prelim) – Forecast 0.4%, versus 0.4% previous.
- Euro Zone GDP Q1 2019 (YoY) (Prelim) – Forecast 1.2%, versus 1.2% previous.
- US Retail Sales April 2019 (MoM) – Forecast +0.2%, versus +1.6% previous.
- Canadian Consumer Price Index April 2019 (MoM) – Forecast +0.3%, versus +0.7% previous.
- Canadian Consumer Price Index April 2019 (YoY) – Forecast +1.7%, versus +1.9% previous.
Stocks recovered as Mnuchin will travel to China for trade talks again soon
US stocks recovered mildly overnight, partly due to a technical recovery, and partly cause Trump's administration tried to tone down trade war with China. DOW ended up 0.82% or 207.06 pts at 25532.05 but was kept well below 55 day EMA at 25690.77. S&P 500 rose 0.80% while NASDAQ rose 1.14%. Both were also capped by 55 day EMA.
Trump said "we're having a squabble with" China only., and "we have a dialogue going. It will always continue." Treasury spokesman also indicated that Steven Mnuchin will plan for another meeting with China, without details. The spokesman said: "As the secretary has indicated, the negotiations will continue. We do anticipate, as the secretary indicated yesterday, that we will plan for a meeting in China at some point soon." However, nothing is heard from Trade Representative Robert Lighthizer yet.
Daily Markets Broadcast
Wall Street bounces on trade hopes
US indices recovered most of Monday's sell-off yesterday as US President Trump issued soothing words about the state of play in the trade negotiations. Oil jumped following attacks on pumping stations in the Middle East.
US30USD Daily Chart
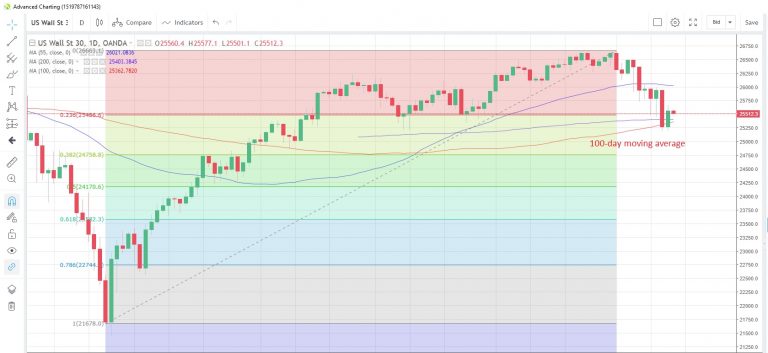
The US30 index rebounded with the biggest one-day gain in six weeks yesterday as Trump played down the recent worsening of the tariff spat
The index regained the 100-day moving average at 25,362 after closing below it for the first time since January 29 on Monday
US retail sales are expected to rise just 0.2% m/m in April, a slowdown from March's 1.6% gain. Fed's Quarles is scheduled to speak.
DE30EUR Daily Chart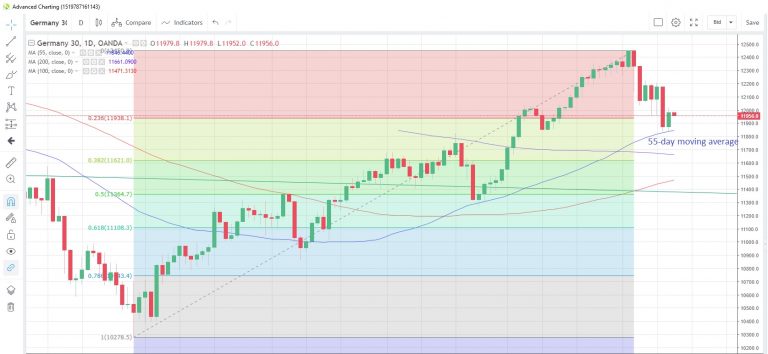
The Germany30 index shrugged off the threat of US tariffs on European car imports and rallied 0.9% yesterday
The 55-day moving average at 11,846 survived an initial test yesterday after the index rebounded off six-week lows
The German economy is expected to have grown 0.7% y/y in the first quarter, a slightly slower pace than the +0.9% recorded in Q4.
CN50USD Daily Chart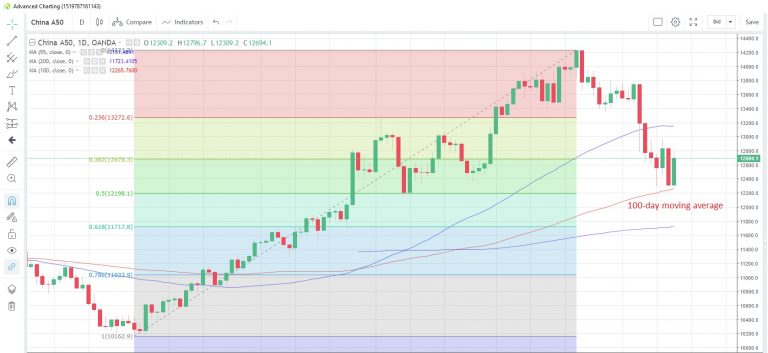
The China50 index rose the most in a month yesterday as markets took a breather from Monday's sell-off
The index held above the 100-day moving average at 12,265, which has supported prices since January 25
China's retail sales are seen rising 8.6% y/y in April after an 8.7% expansion in March. Industrial production is expected to expand 6.5% in the same month, a slower pace than March's +8.5%. Both data sets are due at 0200GMT.
GBPUSD Retains Its Downside Pressure On Further Weakness
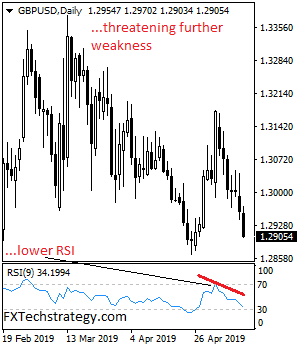
GBPUSD retains its downside pressure on further weakness. Support lies at 1.2850 as it look for more weakness. Below that level will open the door for more decline towards 1.2800 level. Further down, support comes in at the 1.2750 level where a break will turn focus to the 1.2700 level. Further down, support lies at the 1.2650 level. Its daily RSI is bearish and pointing lower suggesting further weakness. On the upside, resistance stands at the 1.2950 with a turn above here allowing for additional strength to build up towards the 1.3000 level. Further out, resistance stands at the 1.3050 level followed by the 1.3100 level. On the whole, GBPUSD retains its downside pressure on further weakness.