Sample Category Title
XAU/USD: Two Scenarios Likely
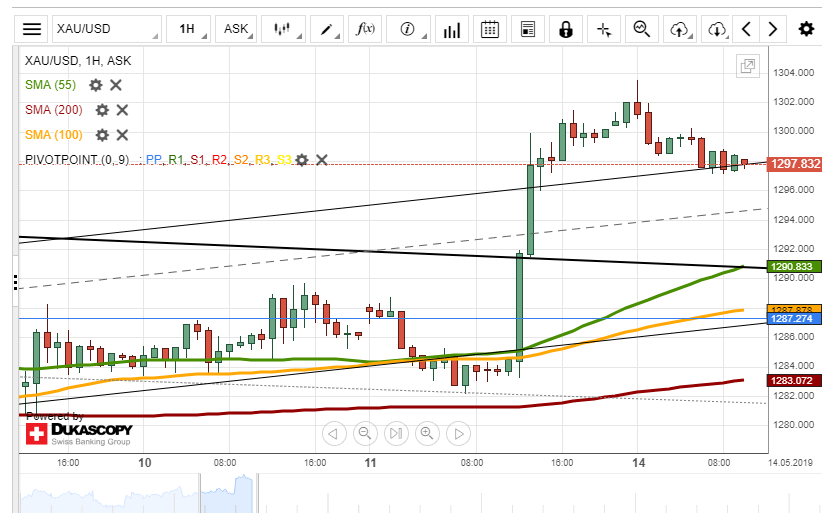
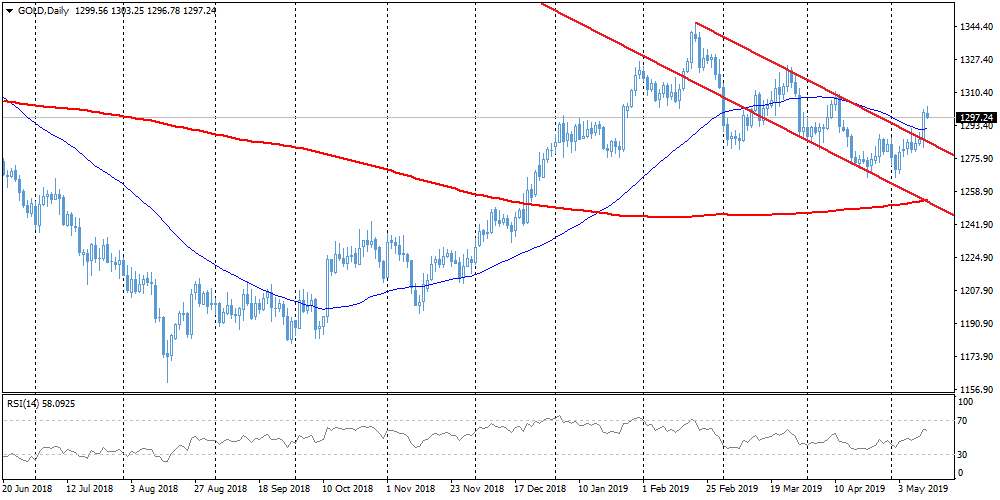
Yesterday, the XAU/USD exchange rate breached the falling wedge pattern north and skyrocketed to the 1,300.00 level.
From the one hand, if the bulls continue to prevail in the market, the rate could maintain its growth in the nearest future. The price for gold could target the psychological level at the 1,305.00 mark.
Otherwise, if the demand for gold as for the safe-haven asset decreases, the exchange rate could trade down. It is unlikely, that the price for gold could drop lower than the 1,290.00 mark due to the support of the 55–hour SMA.
US And China Are Trying To Keep Markets From Decline
The trade disputes escalation is driving force for the markets at the moment. The increase in tariffs on the part of the United States and the announcement of China’s response measures caused a powerful wave of pressure on the markets, which the politicians of both countries tried to ease. Both China and the United States do not overlook the situation in the financial markets, therefore they support the market participants in the belief that an agreement will be concluded. The U.S. noted that they want to hold public hearings on tariffs, and a high-ranking official in China noted that the world's largest economies “have the ability and wisdom” to resolve trade disputes. It is hard to remember when there was so much dissonance on the markets between disappointing actions so promising rhetoric.
Stocks
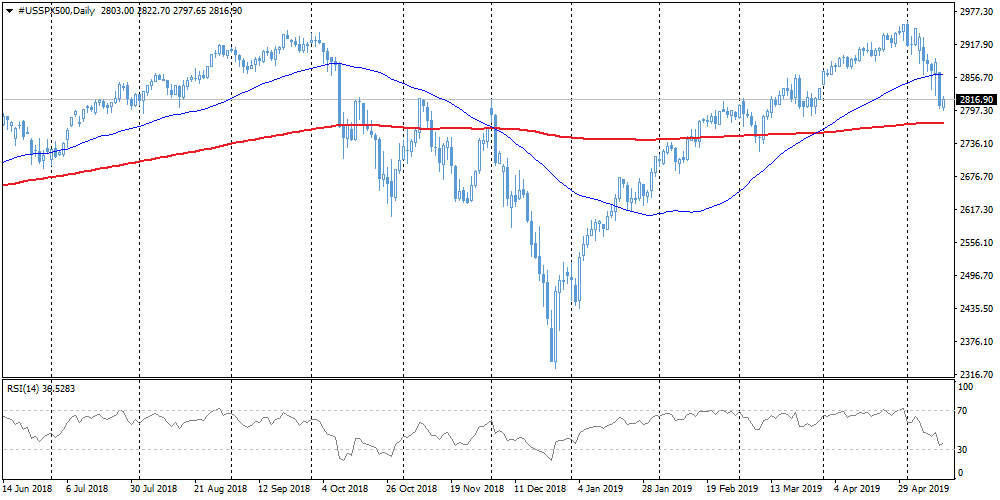
US indices: S&P 500 and Dow Jones lost more than 2.4% during trading in the US. On Tuesday, they rebounded slightly from 6-week lows, following politicians' attempts to regain faith in a deal. However, technically existing market dynamic is more like a short-term rebound than a longer-term reversal to growth. The S&P 500 with a powerful movement declined under a 50-day moving average. A sharp break of important levels is often a precursor to the development of the movement in the direction of a breakthrough. The next important support is the 200-day moving average on the S&P 500 passing through 2774.
EURUSD
The single currency was once again dropped on the approach to the MA50, which further underlines the importance of this resistance. Increased pressure pushed EURUSD down from 1.1260 to 1.1220 by Tuesday morning. Today, both the MA50 and the resistance of the downward corridor pass through 1.1260. Growth above this level is able to mark the breakdown of the downward trend. However, maintaining tension in the markets increases the chances of the pair reversing down to the lower border at 1.05. In the case of a trade conflict worsening, the pair has the potential to be there as early as May.
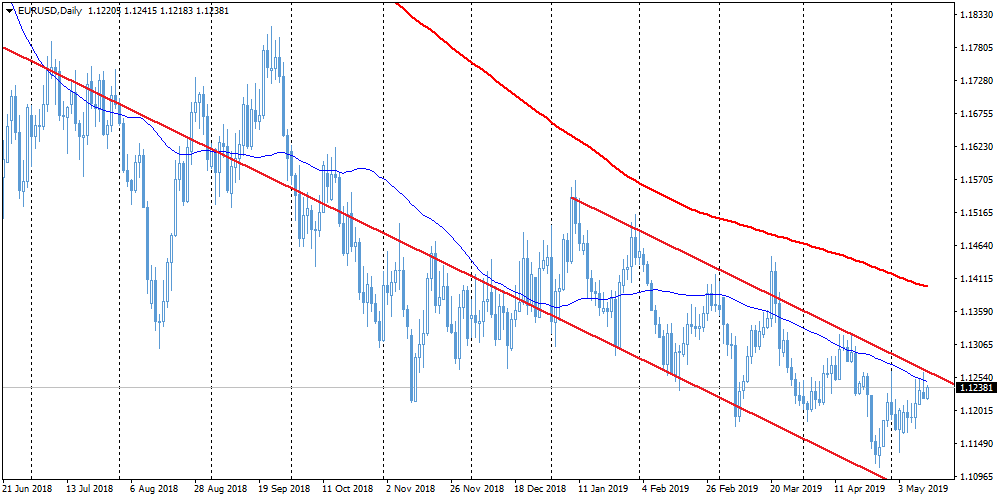
Chart of the day: Gold
The surge in stock market volatility has brought gold back into the spotlight of investors as a defensive asset in a period of turbulence. Gold sharply broke through the resistance of the downward channel at $1285 and rose to $1300. On Tuesday morning, market participants carefully took profits after a 1.3% jump following cautious purchases on stock markets. Technically, growth above $1310 will confirm the breakdown of the downward channel, which is able to attract the additional interest of buyers.
GBP/AUD 4H Chart: Buy Signals
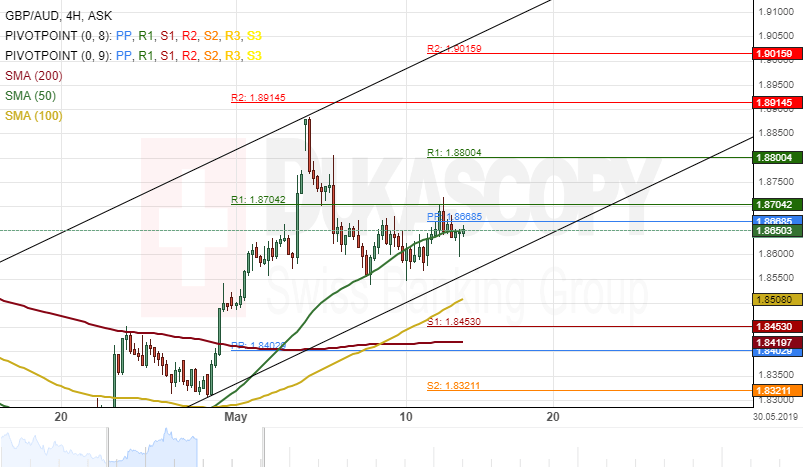
During last week's trading sessions, the British Pound depreciated about 247 base points against the Australian Dollar. The decline was stopped by the 50-hour simple moving average at 1.8550.
Everything being equal, it is likely that the GBP/AUD currency pair aims for the lower boundary of an ascending channel pattern at 1.8503 during the following trading sessions.
If the support level formed by the bottom border of the channel pattern holds, the currency exchange rate will continue its upside movement in the long-term.
Meanwhile, technical indicators flash bullish signals on both the smaller and the larger time-frame charts.
GBP/CAD 4H Chart: Sets For Breakout
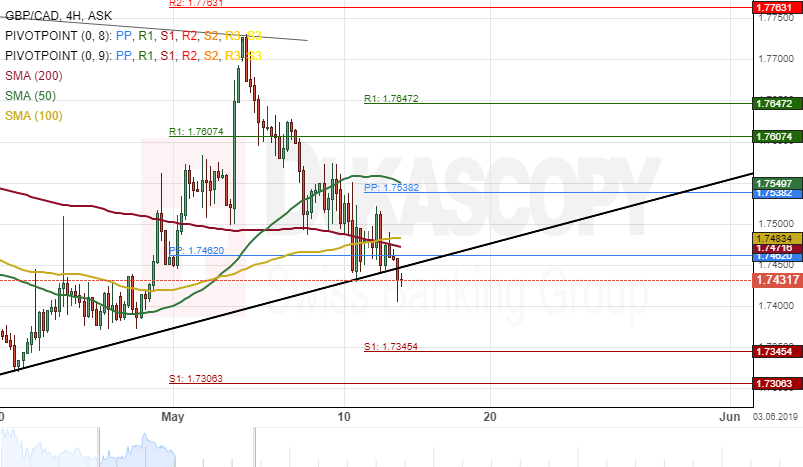
The British Pound depreciated about 233 base points against the Canadian Dollar during last week's trading session. The currency pair breached the 50-, 100– and 200-hour SMAs during this period.
The exchange rate was trading near the bottom border of an ascending channel pattern at 1.7462 during the morning hours of Tuesday's trading session and could be set for a breakout.
If this breakout occurs, a decline towards a support cluster formed by the combination of the weekly and the monthly PPs at 1.7306 could be expected during the following trading days.
However, if the channel pattern holds, a surge towards the 1.7700 mark might follow.
The Analytical Overview Of The Main Currency Pairs
The EUR/USD currency pair
Technical indicators of the currency pair:
Prev Open: 1.12299
Open: 1.12213
% chg. over the last day: -0.03
Day's range: 1.12185 – 1.12416
52 wk range: 1.1111 – 1.2009
EUR/USD keeps consolidating around 1.12150-1.12400. The technical picture is ambiguous, the market participants wait for additional drivers. The US/China trading conflict remains in the spotlight. Beijing had fired back with additional fees, totaling around 60 billion USD annually. Keep an eye on this issue. The quotes have good prospects for growth, open the positions from these issues.
The Economic News Feed for 14.05.2019:
ZEW Economic Mood Index (EU) – 12:00 (GMT+3:00);
Industrial Production Volume (EU) – 12:00 (GMT+3:00);
Import/Export Price Index (US) – 15:30 (GMT+3:00);
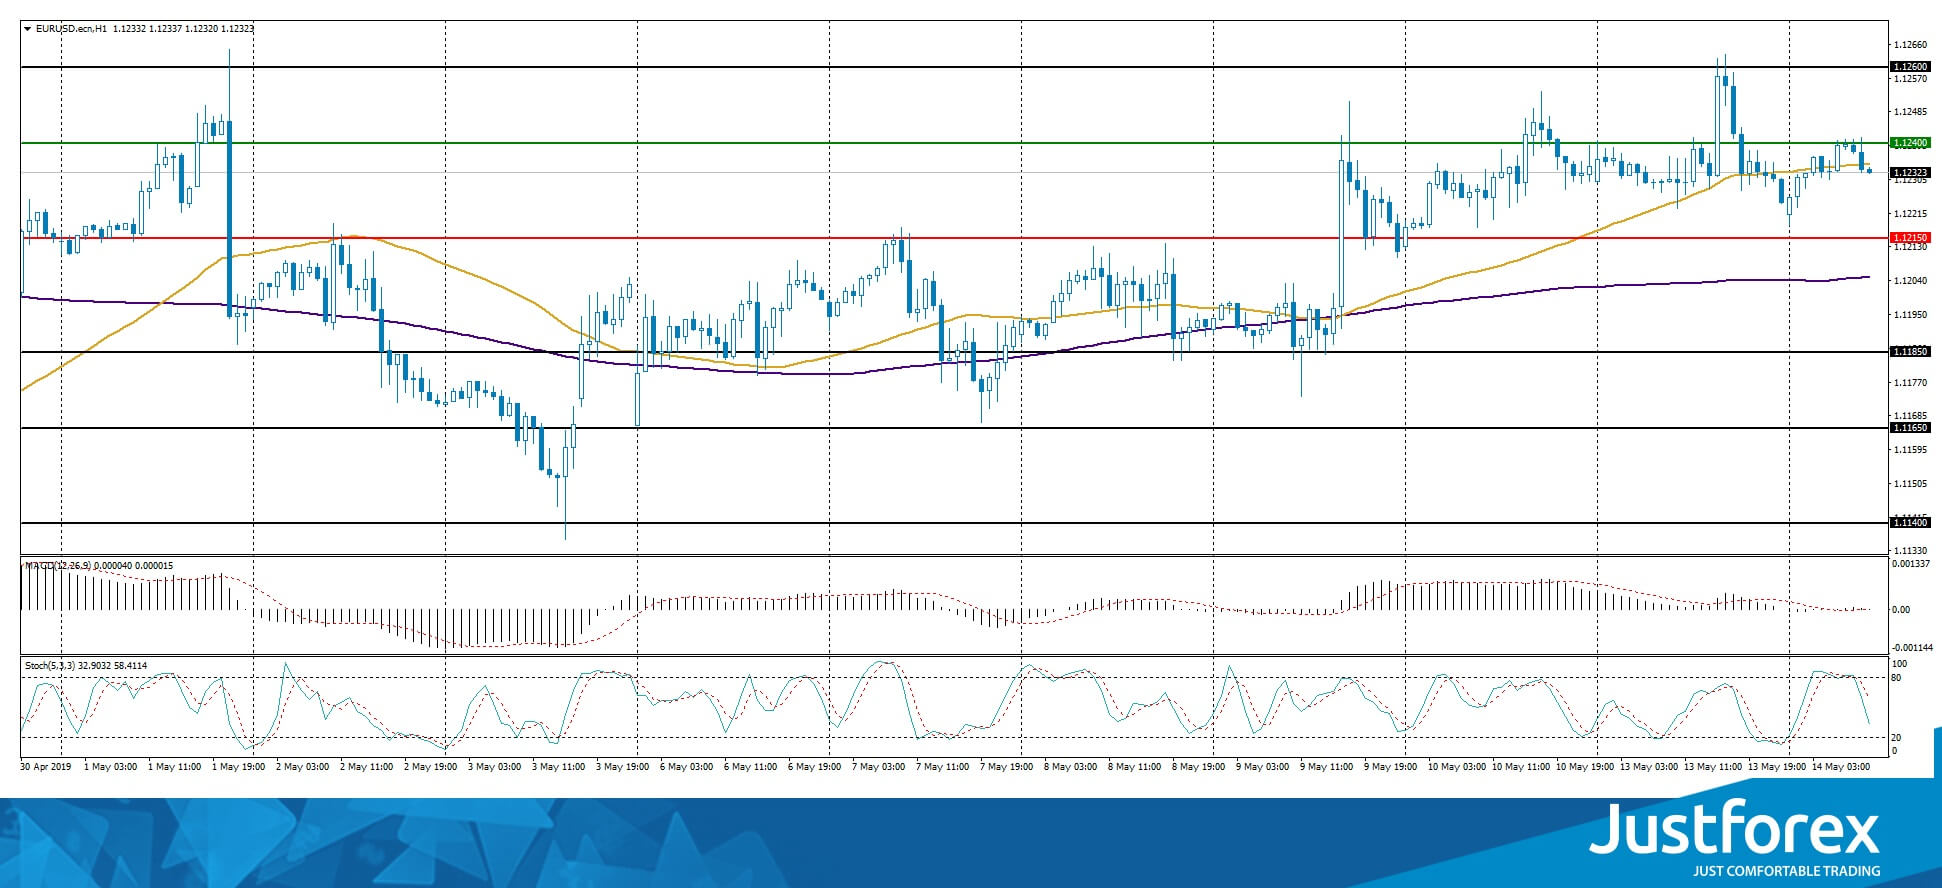
The indicators do not provide precise signals, the price has crossed 50 MA.
The MACD histogram is close to 0.
The Stochastic Oscillator is in the neutral zone, the %K line is below the %D line which points to the bearish mood.
Trading recommendations
Support levels: 1.12150, 1.11850, 1.11650
Resistance levels: 1.12400, 1.12600
If the price fixes above 1.12400, the quotes will grow toward 1.12600-1.12800.
Alternatively, the quotes can descend toward 1.11900-1.11700.
The GBP/USD currency pair
Technical indicators of the currency pair:
Prev Open: 1.29926
Open: 1.29926
% chg. over the last day: -0.33
Day's range: 1.29346 – 1.29699
52 wk range: 1.2438 – 1.3631
GBP/USD started to descend and updated the local minimums. GBP remains under pressure due to Brexit. The market participants are worried tha the ruling and the opposing parties won't be able to reach an agreement. The quotes are testing 1.29400 with 1.29800 acting as a mirror resistance. There are prospects for further descend. You should open positions from the key levels.'
At 11:30 (GMT+3:00) the UK will publish a labour market report.
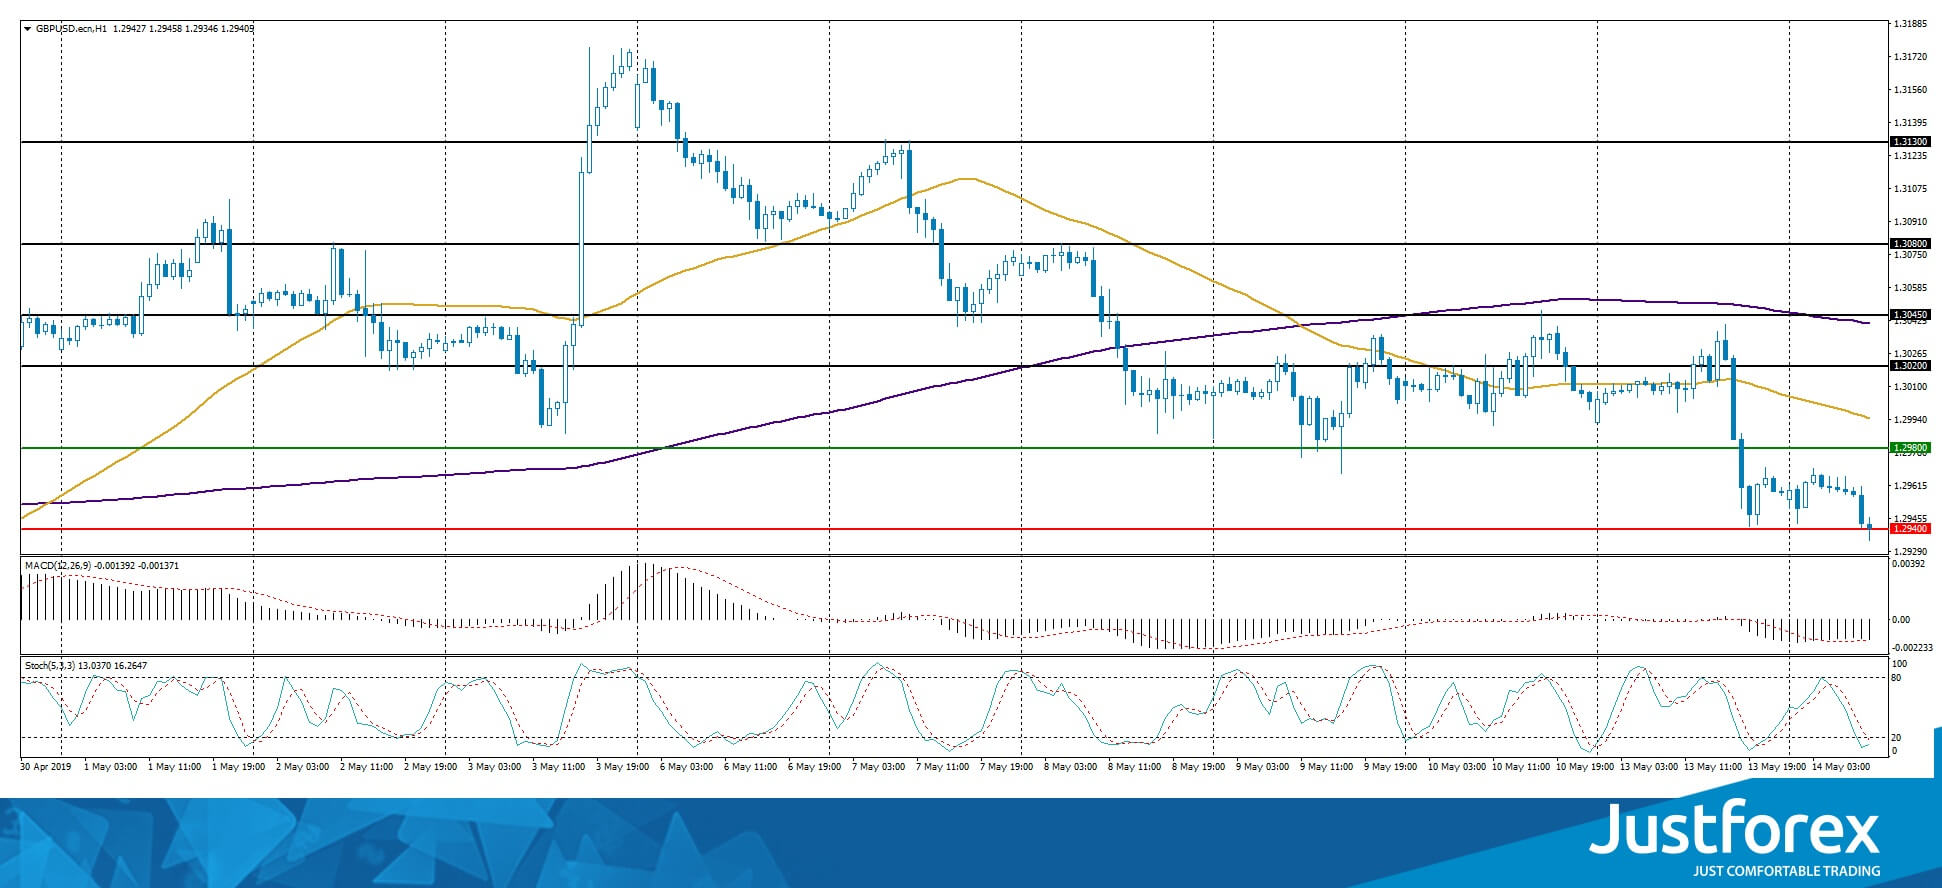
The price fixed below 50 MA and 200 MA which points to the power of the sellers.
The MACD histogram is in the negative zone and keeps falling which recommends selling GBP/USD.
The Stochastic Oscillator is in the oversold zone, the %K line is crossing the %D line. There are no signals at the moment.
Trading recommendations
Support levels: 1.29400, 1.29000
Resistance levels: 1.29800, 1.30200, 1.30450
If the price fixes below 1.29400, expect further descend toward 1.29000.
Alternatively, the quotes can recover toward 1.30200-1.30450.
The USD/CAD currency pair
Technical indicators of the currency pair:
Prev Open: 1.34208
Open: 1.34716
% chg. over the last day: +0.28
Day's range: 1.34593 – 1.34874
52 wk range: 1.2727 – 1.3664
USD/CAD started to grow. The instrument updated the local maximums. The qutoes are consolidating around 1.34550-1.34850. The market participants are waiting for additional drivers. You should keep an eye on the oil quotes and open positions from the key levels.
The Economic News Feed for 14.05.2019 is calm.
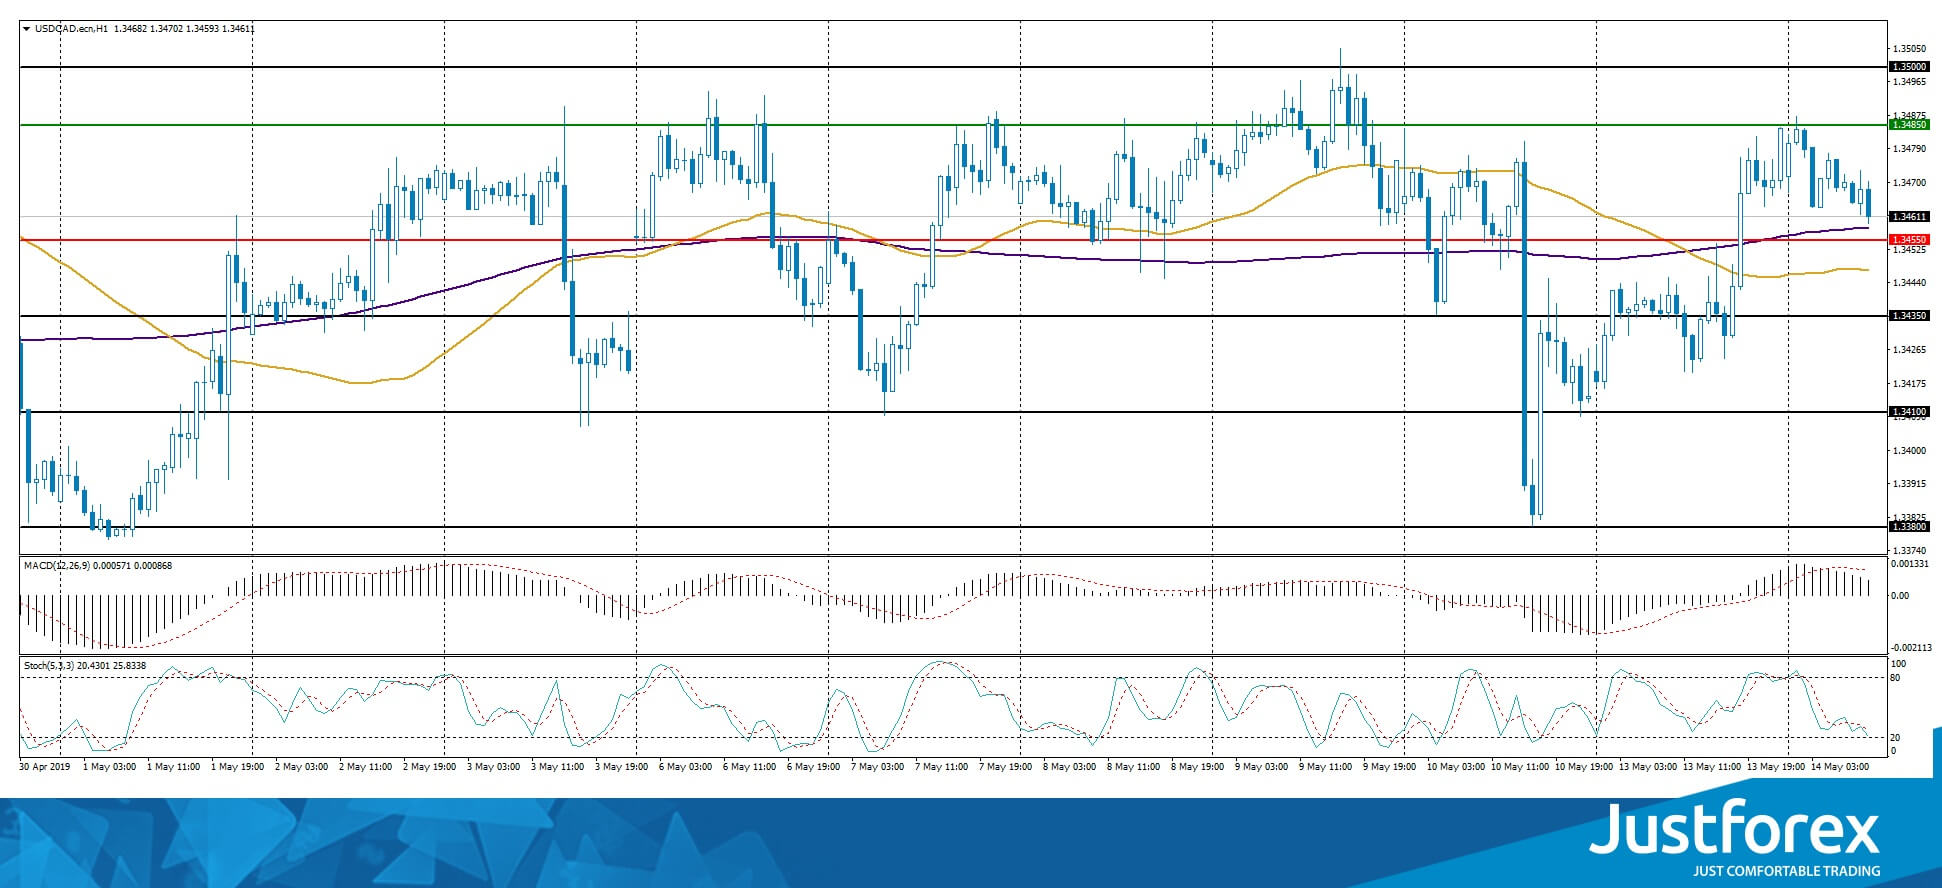
The indicators do not provide precise signals, the price is consolidating around 200 MA.
The MACD histogram is in the positive zone but below the signal line which gives a weak signal to buy USD/CAD.
The Stochastic Oscillator is in the neutral zone, the %K line is above the %D line which points to the bullish mood.
Trading recommendations
Support levels: 1.34550, 1.34350, 1.34100
Resistance levels: 1.34850, 1.35000
If the price fixes above 1.34850 expect further growth toward 1.35250-1.35400.
Alternatively, the quotes are descending toward 1.34300-1.34100.
The USD/JPY currency pair
Technical indicators of the currency pair:
Prev Open: 109.760
Open: 109.287
% chg. over the last day: -0.44
Day's range: 109.145 – 109.772
52 wk range: 104.97 – 114.56
USD/JPY started recovering after a long fall. Right now the quotes are consolidating. The local support and resistance levels are 109.350-109.750. The demand for the safe assets remains high due to the trading conflict escalation between the US and China. Keep an eye on the US Treasury bonds and open positions from the key levels.
The Economic News Feed for 14.05.2019 is calm.
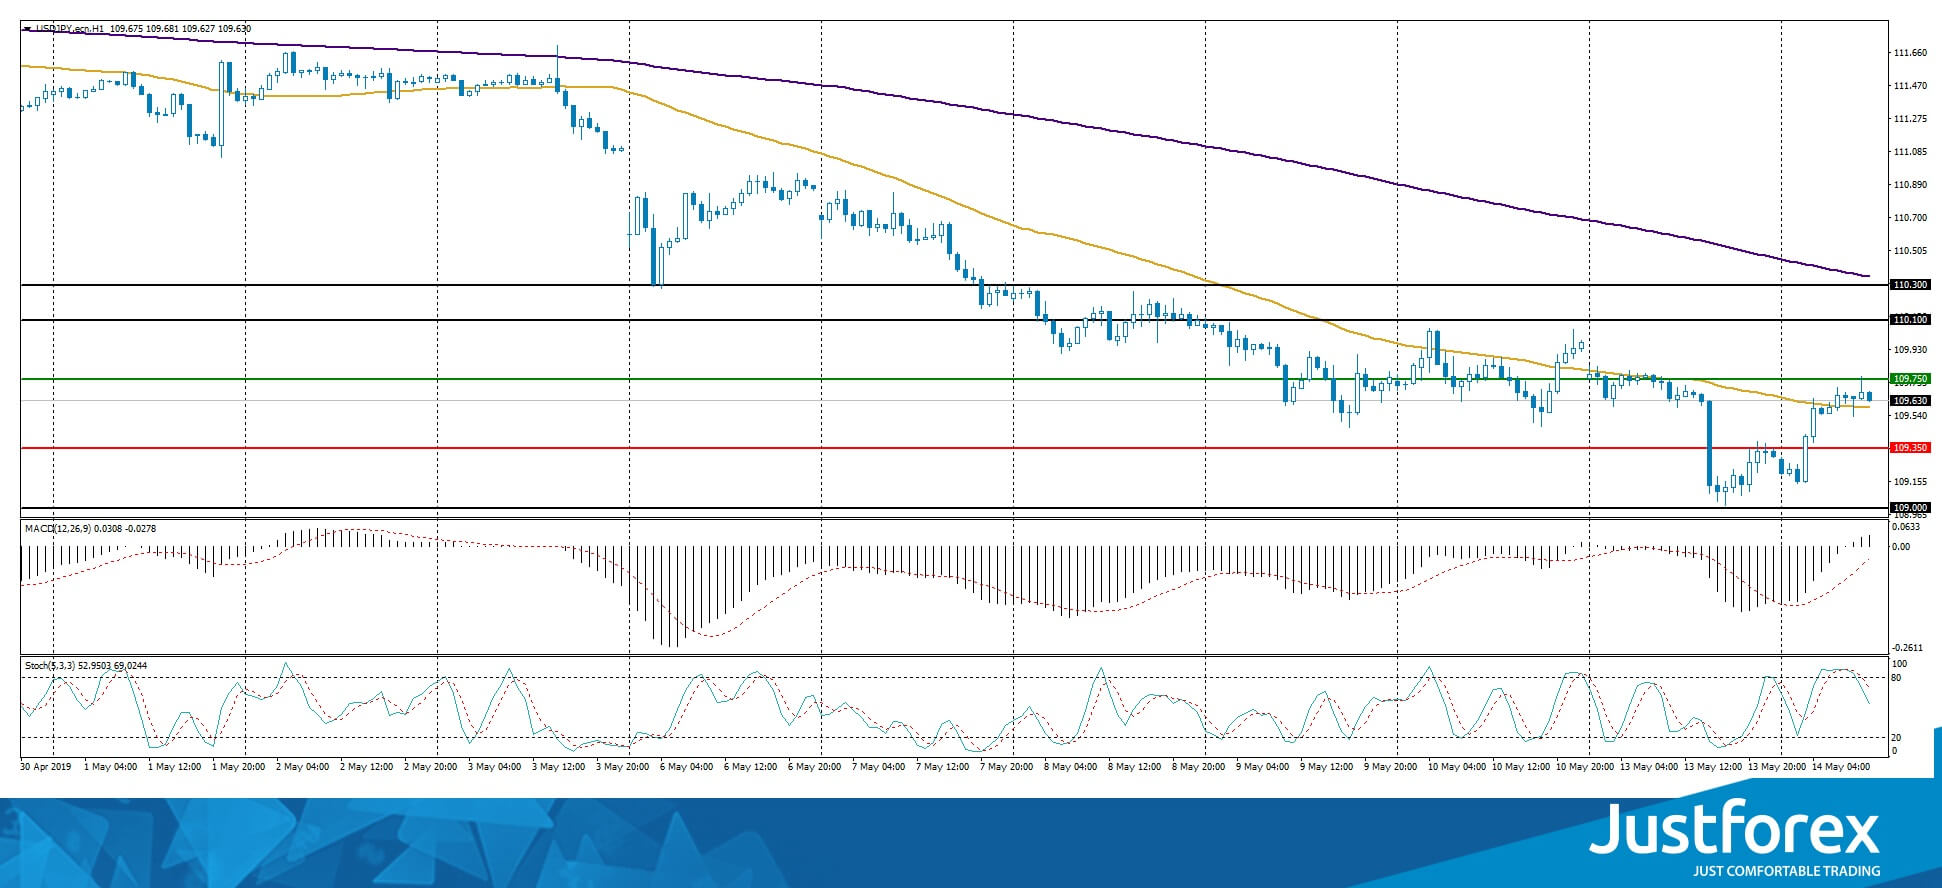
The indicators do not provide precise signals, the price has crossed 50 MA/
The MACD histogram moved into a positive zone which points towards a correction.
The Stochastic Oscillator is in the neutral zone, the %K line is below the %D line which recommends selling USD/JPY.
Trading recommendations
Support levels: 109.350, 109.000
Resistance levels: 109.750, 110.100, 110.300
If the price fixes above 109.750, expect a correction toward 110.100-110.300.
Alternatively, the quotes can fall toward 109.000.
China Strikes Back
The US dollar slightly strengthened against a basket of major currencies. The dollar index (#DX) closed in the positive zone (+0.04%). Investors are focused on the trade war between the US and China. It became known that China intended to impose duties on the US goods $60 billion worth starting on June 1 after Washington tariff raising on Chinese imports $200 billion worth. However, US President Donald Trump warned China not to strike back, otherwise, China will only get worse. "There is no reason for the U.S. Consumer to pay the Tariffs, which take effect on China today... Therefore, China should not retaliate-will only get worse!" – Trump tweeted. At the same time, the President hopes that countries will nevertheless be able to reach an agreement.
The news feed was fairly calm yesterday. Today we expect important economic data from the UK and the Eurozone. The euro demonstrates positive dynamics, as the German economy shows growth and investors hope that economic releases will support the improvements. We also recommend paying attention to the escalation of the trade conflict between the US and China.
The "black gold" prices are consolidating after the collapse the day before. At the moment, futures for the WTI crude oil are testing the mark of $61.00 per barrel. At 23:30 (GMT+3:00) the API weekly crude oil stock will be published.
Market Indicators
- Yesterday, the aggressive sales were observed in the US stock market due to trade disputes between the US and China: #SPY (-2.51%), #DIA (-2.48%), #QQQ (-3.47%).
- The 10-year US government bonds yield is also declining. Currently, the indicator is at the level of 2.41-2.42%.
The news feed on 2019.05.14:
- Data on the UK labor market at 11:30 (GMT+3:00);
- ZEW economic sentiment indices in Germany and the Eurozone at 12:00 (GMT+3:00);
- Export and import price indices in the US at 15:30 (GMT+3:00).
EUR/JPY Supported By SMAs
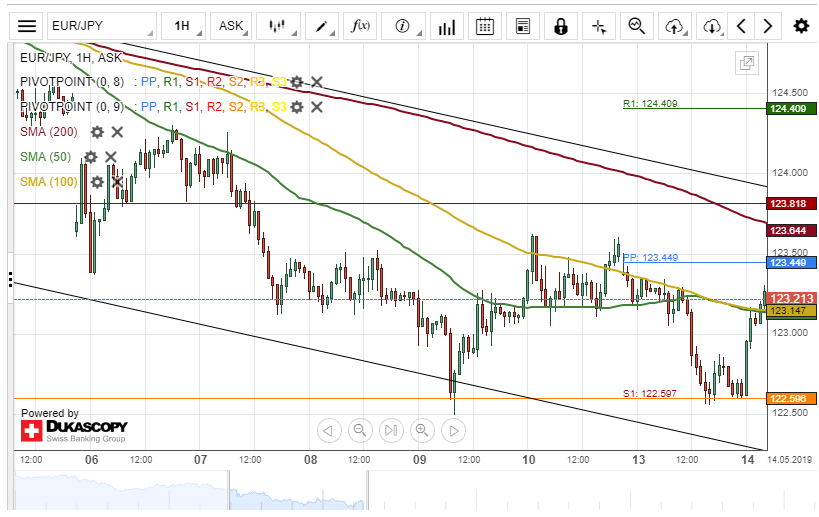
The Eurozone single currency depreciated about 0.59% in value against the Japanese Yen on Monday. The decline was stopped by a support level formed by the monthly S1 at 122.59.
A support cluster formed by the combination of the weekly and the monthly pivot points at 123.14 is currently providing support for the currency pair.
If this support level holds, a surge towards the 123.81 area could be expected within this session.
However, if the currency exchange rate breaches the support level, bears could be prepared to break the monthly S1 at 122.59 today.
AUD/USD Breaches Support Cluster
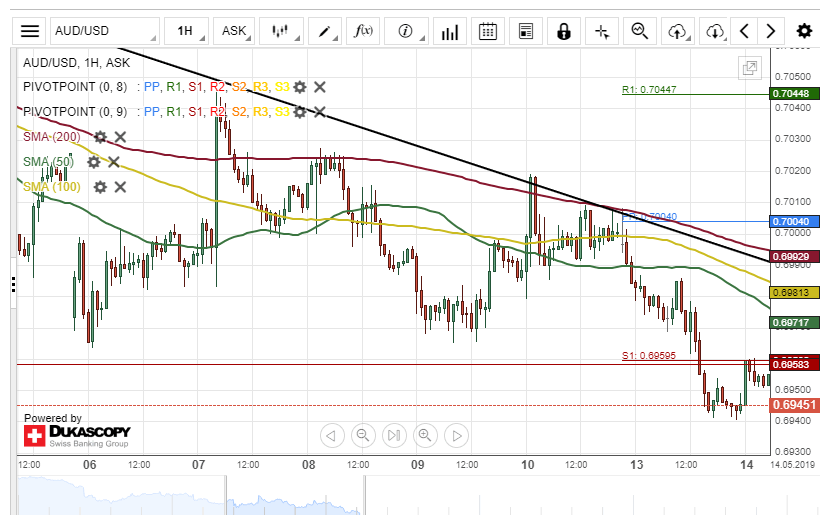
During yesterday's trading session, the Australian Dollar depreciated about 44 base points against the US Dollar. The currency pair breached a support cluster formed by the weekly and the monthly PPs at 0.6958 on Monday.
Technical indicators flash sell signals on both the smaller and the larger time frames. Therefore, the AUD/USD exchange rate could continue its southern movement within this session.
However, the currency exchange rate might reverse from the current price level at 0.6943 and aim for a resistance line set by the 50-hour simple moving average at 0.6975 during the following trading session
USD/CAD Sets For Breakout
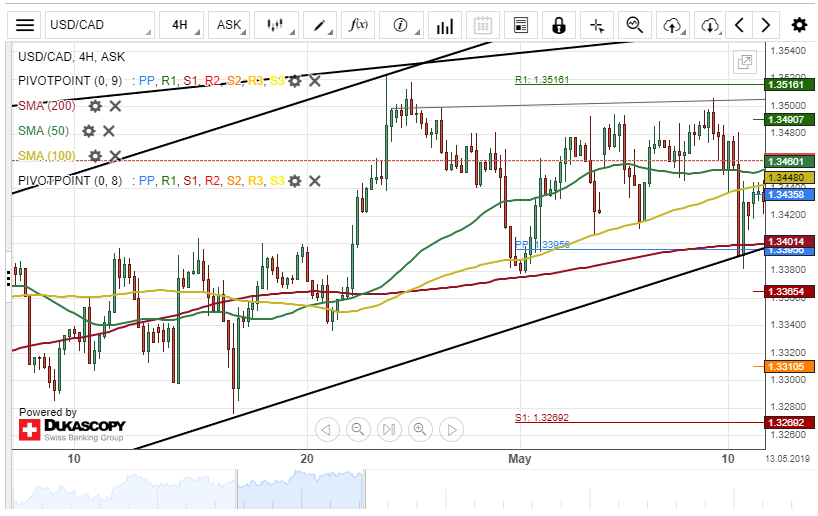
The US Dollar appreciated about 94 base points against the Canadian Dollar on Monday. The surge was stopped by a resistance level formed by the weekly R1 at 1.3490 during yesterday's session.
The 50-hour simple moving average is currently providing support for the currency pair at 1.3459.
If the support line holds, the currency exchange rate could eventually breakout from a significant resistance level at 1.3516.
However, if the USD/CAD currency pair passes the 50-hour SMA, a re-tests of the 200-hour moving average at 1.3401 could be expected today.
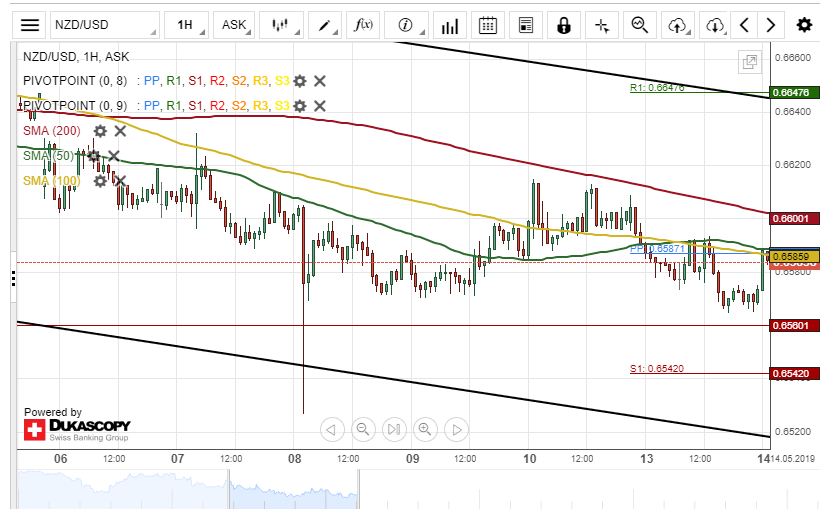
NZD/USD Sell Signals Today
The New Zealand Dollar traded with low volatility against the US Dollar on Monday. The currency pair made 26 base points movement during yesterday's trading session.
The exchange rate is currently pressure by a resistance cluster formed by the 50– and 100-hour SMAs at 0.6586.
If this resistance cluster holds, a decline towards the weekly S1 at 0.6542 could be expected within this session.
On the other hand, if the currency exchange rate passes the 50– and 100-hour simple moving averages, the 200-hour SMA could stop the bullish momentum.