Sample Category Title
AUD/JPY Possible Bounce Off The Monthly Support
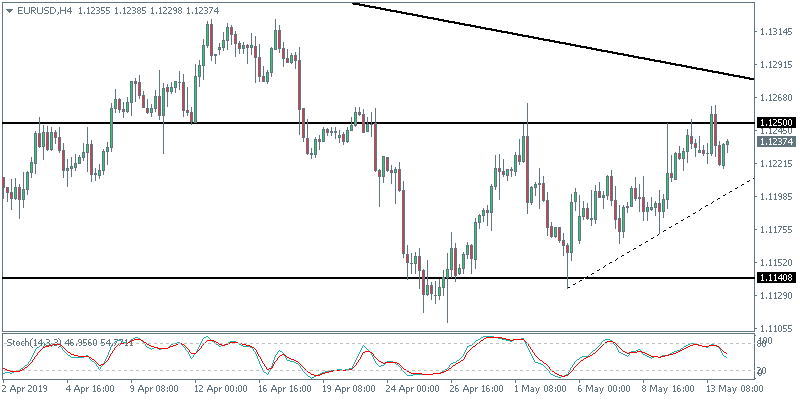
The AUD/JPY has reached the final M L5 camarilla level so we might see a bounce in the form of a counter trend move
Trade War between the US and China could also result in a lot of positive trade to Australia, as China may stop purchasing US agricultural products and energy from the US. Who is gonna fulfil that surplus? AUS and NZ. If that happens the Australian Dollar should benefit.
At this point technically speaking the AUD/JPY is at the M L5 camarilla looking for a bounce. 76.00-15 is the zone. The first target is 76.48. A close above and we should see 77.42. Of course, the AUD/JPY is a medium speed moving pair -ATR(5) is 72 pips so it might take some time to get there. Watch for a continuation of bearish trend only below 75.65.
EUR/CHF Daily Outlook
Daily Pivots: (S1) 1.1269; (P) 1.1320; (R1) 1.1347; More...
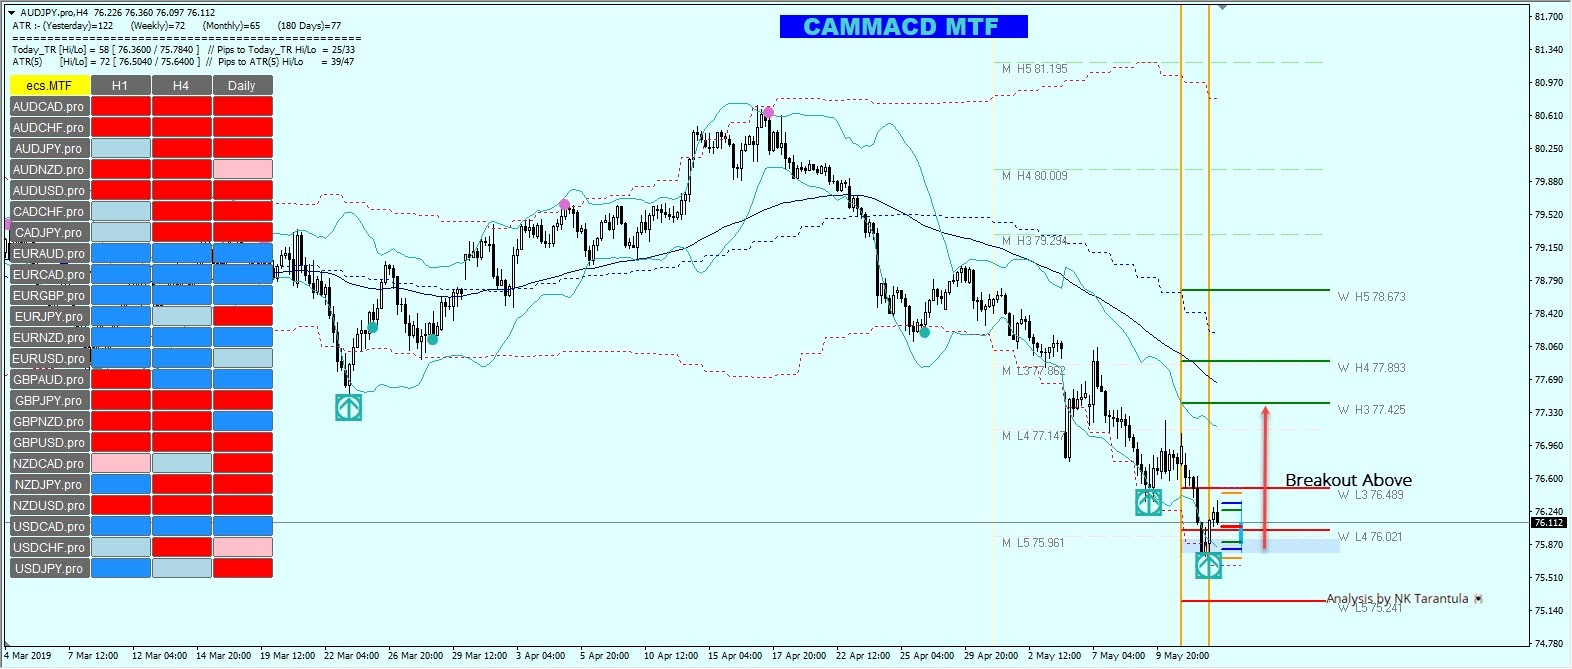
As long s 1.1350 support turned resistance holds, corrective fall from 1.1476 could still extend lower towards 1.1162 low. We'd expect strong support above there to bring rebound. On the upside, break of 1.1350 will suggests that the pull back has completed. Intraday bias will be turned back to the upside for 38.2% retracement of 1.2004 to 1.1162 at 1.1484 again.
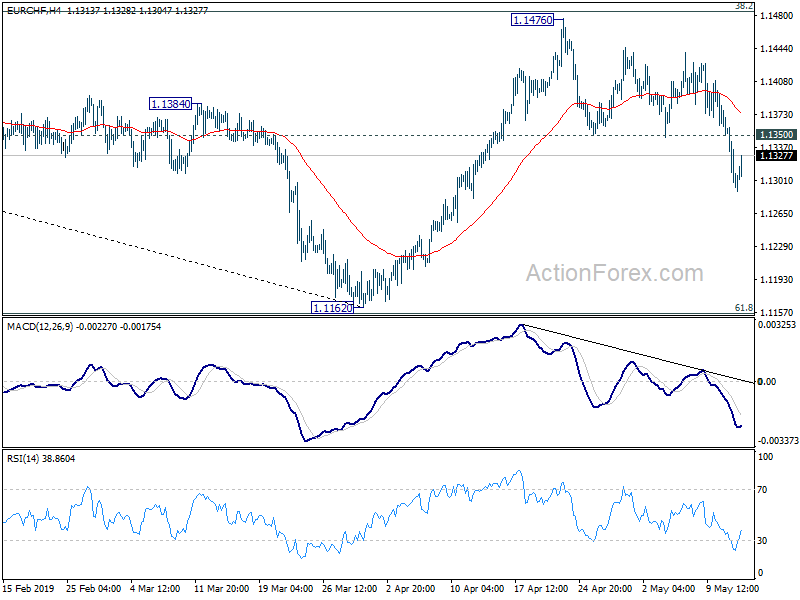
In the bigger picture, at this point, we're slightly favoring the case that corrective fall from 1.2004 has completed after being supported by 61.8% retracement of 1.0629 to 1.2004 at 1.1154. Decisive break of 1.1501 resistance should confirm and target 1.1713 resistance next. On the downside, firm break of 1.1154 is needed to confirm down trend resumption. Otherwise, medium term outlook will be neutral at worst.
EUR/USD Outlook: Bulls Regained Traction And Eye ZEW Data For Fresh Signals
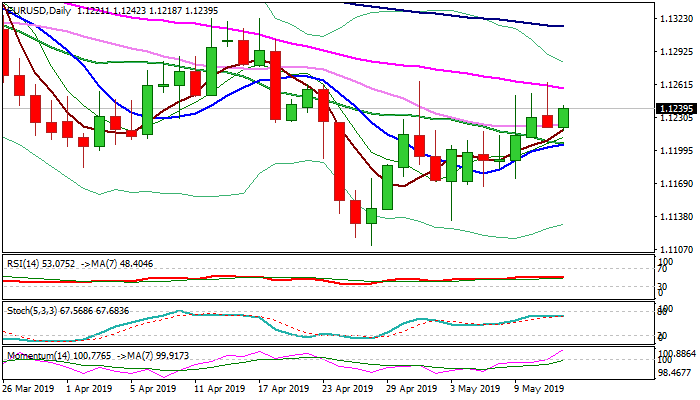
The Euro regained traction and probes again through pivotal Fibo barrier at 1.1240 (Fibo 38.2% of 1.1448/1.1111, as bulls so far failed three times to close above here) following strong upside rejection on Monday (rally was capped by falling 55SMA at 1.1257). Near-term structure remains firmly bullish, as momentum extends steep ascend and 5;10;20 SMA's are in bullish configuration. Bulls eye strong barriers at 1.1257 (55SMA) and 1.1273 (daily cloud base), despite facing strong headwinds, with sustained break here to open way for 1.13+gains.
Rising 5SMA (1.1219) tracks the advance and marks initial support, followed by converging 10/20SMA's (1.1205/06) on track to form bull-cross and further support the advance.
German ZEW data (May 5.1 f/c vs 3.1 prev) are eyed for fresh signals.
Res: 1.1257, 1.1263, 1.1273, 1.1300
Sup: 1.1224, 1.1219, 1.1205, 1.1173
GBP/USD Outlook: Close Below 200SMA Was Bearish Signal, UK Jobs Data In Focus
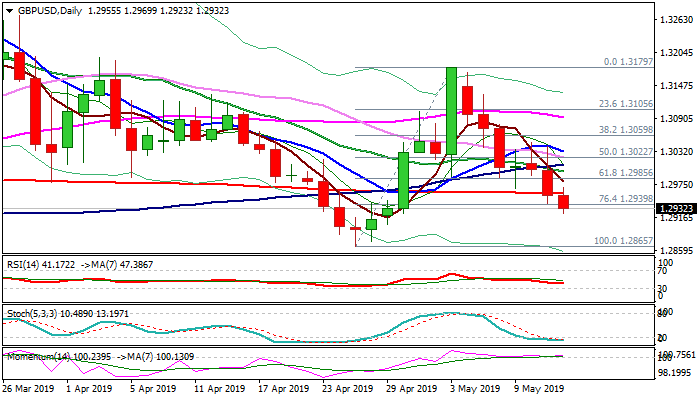
Cable extends weakness to new two-week low at 1.2923 in early European trading on Tuesday, pressured by fading optimism regarding Brexit talks between UK government and the main opposition party.
Extension of steep fall from 3 May high at 1.3179 broke below 1.2939 (Fibo 76.4% of 1.2865/1.3179) on Tuesday, adding to negative signal generated on Monday's close below 200SMA (1.2959).
Bears eye key near-term support at 1.2865 (25 Apr) as daily MA's in bearish setup support the notion, but flat momentum and oversold stochastic warn. UK jobs data are key event for pound today and eyed for fresh signals (Apr Avg earnings 3.4% f/c vs 3.5% prev, Apr jobless claims 24.2K f/c vs 28.3% prev).
Broken 200SMA marks solid barrier, which needs to cap and keep negative structure intact, while return and close above would slow bears.
Res: 1.2958, 1.2980, 1.2996, 1.3010
Sup: 1.2923, 1.2900, 1.2889, 1.2865
China Responds To Us Tariffs
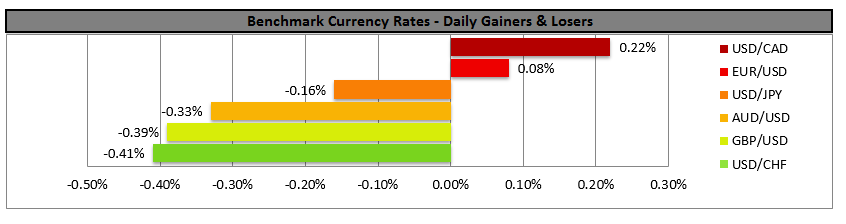
JPY strengthened yesterday as the US-Sino negotiations escalated further, increasing the risk averse climate in the markets. China announced tariffs on US products applicable from 1st of June, despite US president Trump warning them not to escalate the situation further, in a tweet earlier. The Chinese tariffs are to hit around $60 billion of US imports, according to media reports, with agricultural and energy products seeing tariffs of 25% among other products. The US seems to be preparing an additional round of tariffs, covering around $300 billion worth of Chinese imports, however these are not to be levied until late June probably. Until then US president Trump may meet Chinese President XI, at the G20 meeting in Japan. Currently we expect a risk off sentiment to be maintained and safe havens could find further support. USDJPY dropped yesterday finally breaking the 109.75 (R1) support line (now turned to resistance) and continued to test the 109.15 (S1) support level, yet bounced on it and corrected higher during the Asian session today. We maintain a bearish outlook for the pair as the downward trendline incepted since the 6th of May remains intact. Should the pair remain under the selling interest once again, we could see it breaking the 109.15 (S1) support line and aim for lower grounds. Should the pair’s long positions be favoured by the market, we could see the pair breaking the prementioned downward trendline, 109.75 (R1) resistance line and aim for the 110.30 (R2) resistance hurdle.
US tariffs on EU cars as well...
The US is planning to impose tariffs on EU cars as well, mainly targeting European cars. The US president is expected to meet a decision by Saturday May 18th and tensions are running high there as well. EU trade-chief Cecilia Malmstrom stated that in such a case the EU response could “happen quite rapidly”. The EU seems to be preparing a list of US products, worth around $22.5 billion. Should the two economies enter a trade war we could see the EUR initially weakening. EUR/USD showed high volatility yesterday testing just before the American session the 1.1260 (R1) resistance line and during the Asian session the 1.1220 (S1) support line, finally landing at the same levels. We could see the pair maintaining a sideways movement today, yet bullish tendencies may exist. The pair could prove sensitive to headlines regarding US tariffs on EU and/or Chinese products, as well as today’s financial releases. Should the bulls take over, we could see the pair breaking the 1.1260 (R1) resistance line and aim for the 1.1300 (R2) resistance level. Should the bears take over, we could see the pair breaking the 1.1220 (S1) support line and aim for the 1.1175 (S2) support barrier.
Other economic highlights, today and early tomorrow
During today’s European session, we get from Germany the final HICP rate for April and the ZEW economic sentiment indicator for May, from Sweden the CPI rate for April, from the UK the employment data for March and from the Eurozone the industrial output growth rate for March. In the late American session we get the API weekly crude oil inventories figure. In tomorrow’s Asian session, Australia’s wage price index for Q1 is due out, while from China we get the industrial output growth rate and retail sales for April. Also please be advised that Kansas Fed President Esther George will be speaking today.
EURUSD H4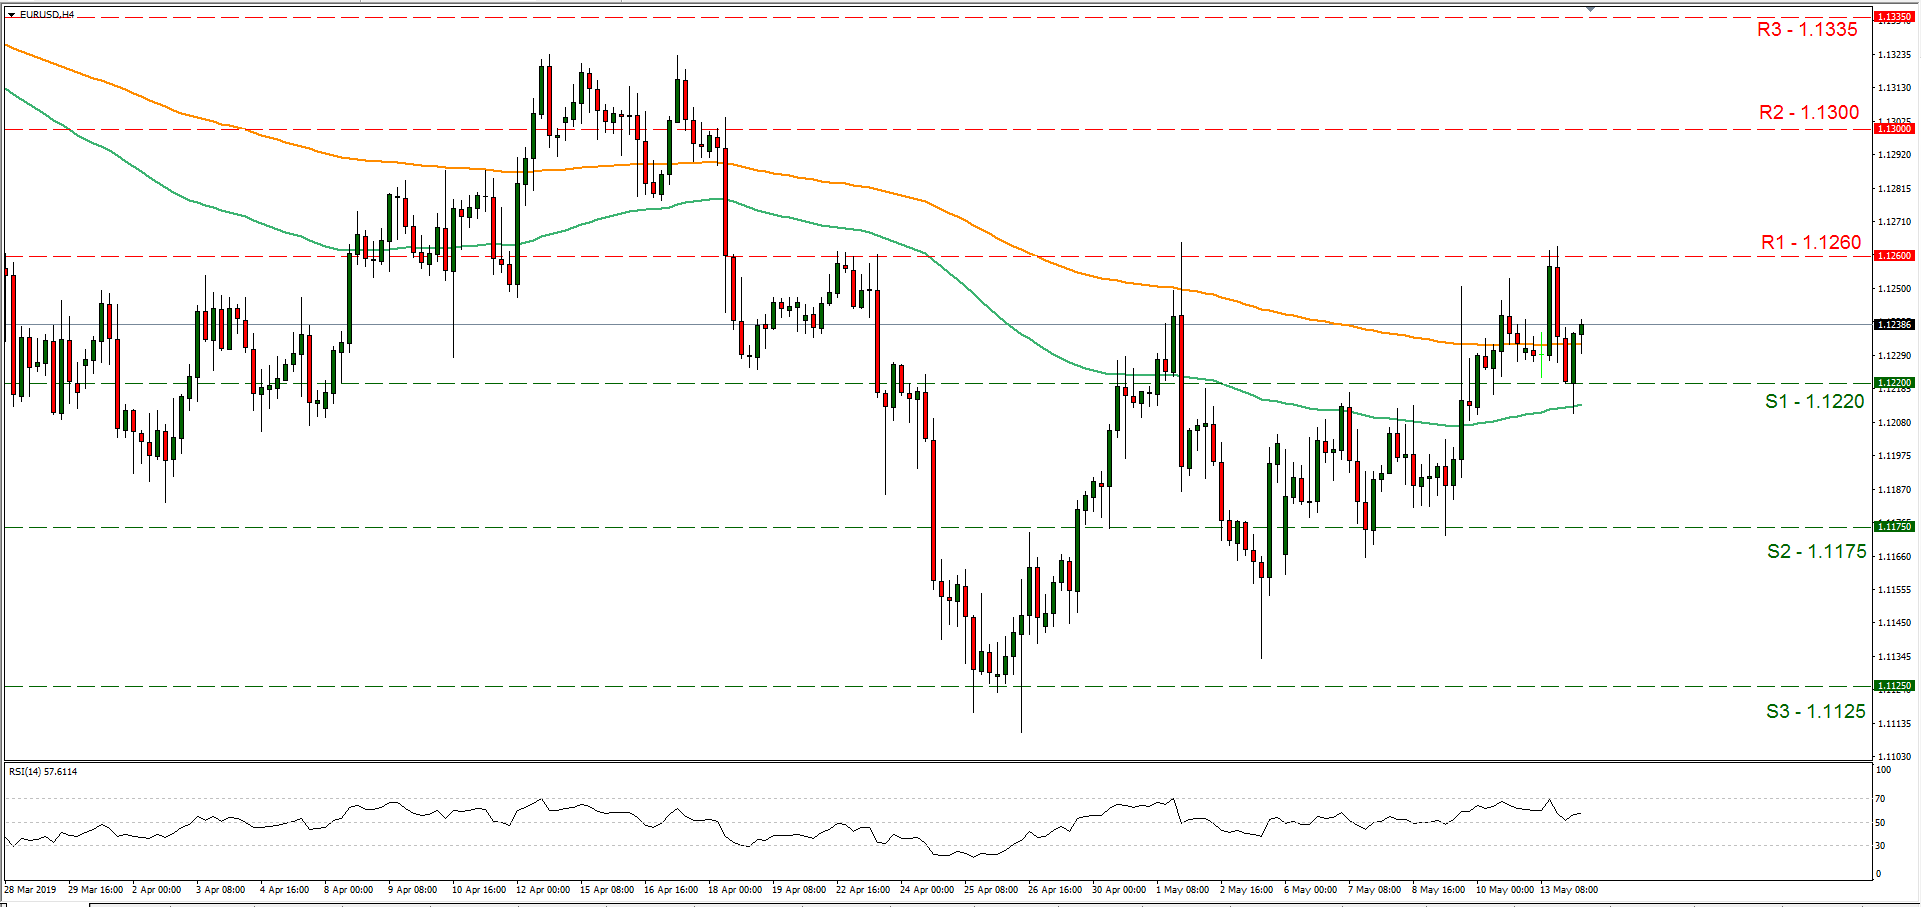
Support: 1.1220 (S1), 1.1175 (S2), 1.1125 (S3)
Resistance: 1.1260 (R1), 1.1300 (R2), 1.1335 (R3)
USD/JPY H4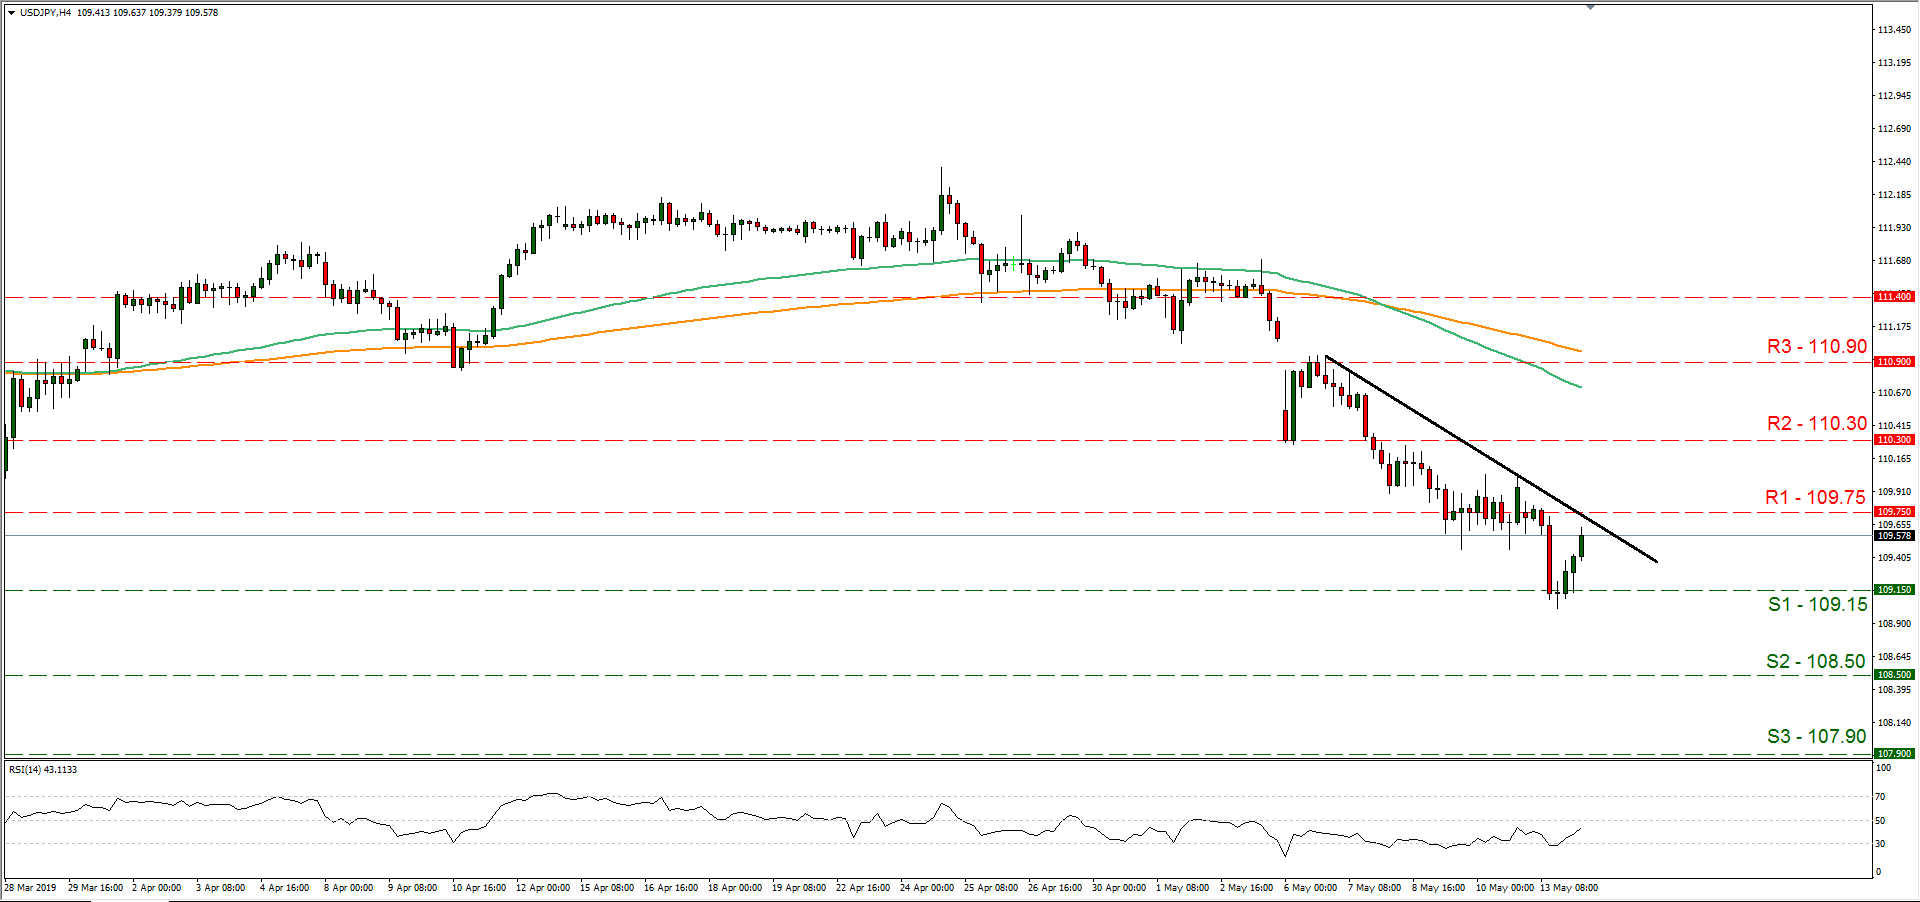
Support: 109.15 (S1), 108.50 (S2), 107.90 (S3)
Resistance: 109.75 (R1), 110.30 (R2), 110.90 (R3)
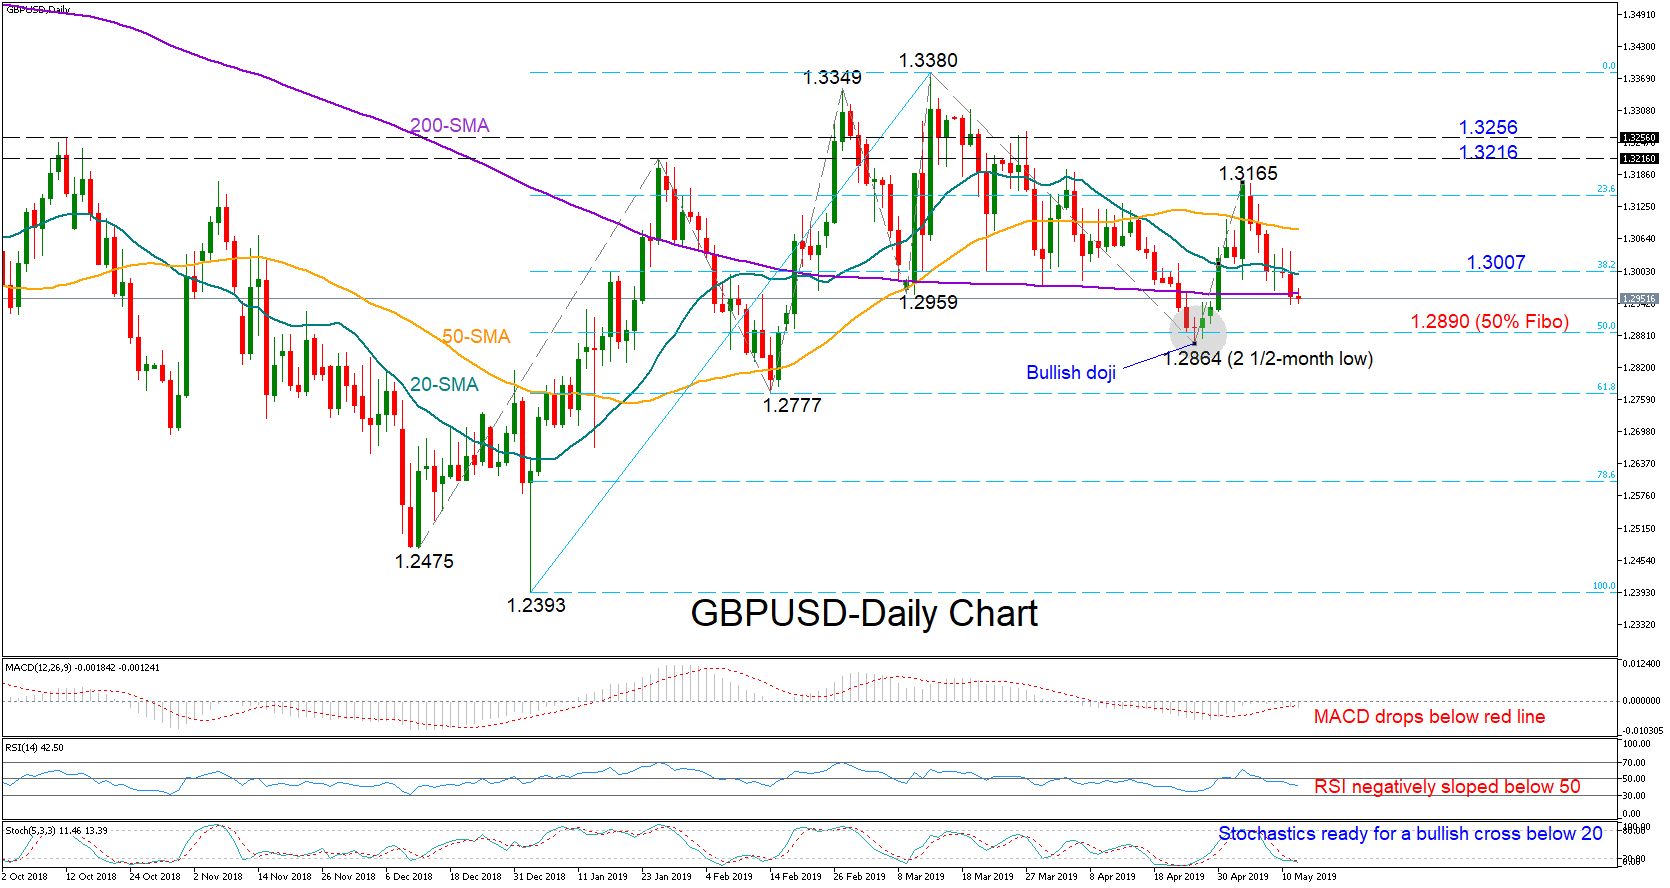
GBPUSD Tests 200-Day SMA, Stochastics Oversold
GBPUSD extended last week’s decline towards the 200-day simple moving average (SMA) on Monday and could lose further if the RSI and the MACD remain in bearish territory. The fast-stochastic oscillator, however, suggests that in the very short-term upside corrections are possible as the indicator heads for a bullish cross in oversold area.
The previous low of 1.2864 (bullish doji), which is slightly below the 50% Fibonacci of the upleg from 1.2393 to 1.3380, will be closely watched in case of additional bearish sessions as any break lower would return confidence to the downleg started from the 1.3380 peak. Further down, the next key support could be detected around the 61.8% Fibonacci and the February low of 1.2777.
Should the price jump above the 1.30 mark and the 20-day SMA, gains could last until the 50-day SMA currently at 1.3082. Moving higher, a decisive close above this month top of 1.3165 could drive the price up to the 1.3216-1.3256 area. If the market manages to overcome the latter, more buying may follow.
In the medium-term picture, the outlook remains neutral as long as the price fluctuates within the 1.2777-1.3380 area. The flattening 50- and the 200-day SMAs signal that an outlook reversal may not happen soon.
China Strikes Back On Trade, Risk Aversion Reigns As Investors Buckle Up Their Seatbelts
Caution and growing unease sum up the atmosphere for financial markets as investors buckle up their seatbelts and prepare for more twists and turns to come in response to escalating tensions between the world's two largest economies, and the negative repercussions this will have on global sentiment.
On Monday, Beijing wasted no time in retaliating against Trump's tariff hike, by unveiling tariffs of up to 25% on about $60 billion worth of US goods. With the US Trade Representative's office releasing a list of about $300 billion worth of Chinese goods that could be hit with a 25% tariff after Beijing's announcement, trade war fears are stepping into levels that we have not seen before.
Expect trade war fears to remain a major theme denting investor confidence. The lack of appetite for risk has been reflected across Asian markets this morning with stocks flashing red as of writing. European shares are looking to trade lower as the risk-off vibe from Asian markets encourages investors to maintain a safe distance from riskier assets while pursuing safe-haven investments. The Yen has given back some of its recent gains, but it is still the preferred asset of choice for currency traders.
Trump says he will meet China's Xi Jinping…but are markets listening?
President Donald Trump has said he will meet President Xi Jinping at the G20 summit in late June. However, given the constant twist, turns and numerous disappointments over trade talks, this statement could well fall on deaf ears.
Markets are likely to take Trump's words with a few pinches of salt, given the many situations in the past which have not resulted in the easing of trade tensions between the United States and China.
Gold to remain star of the show
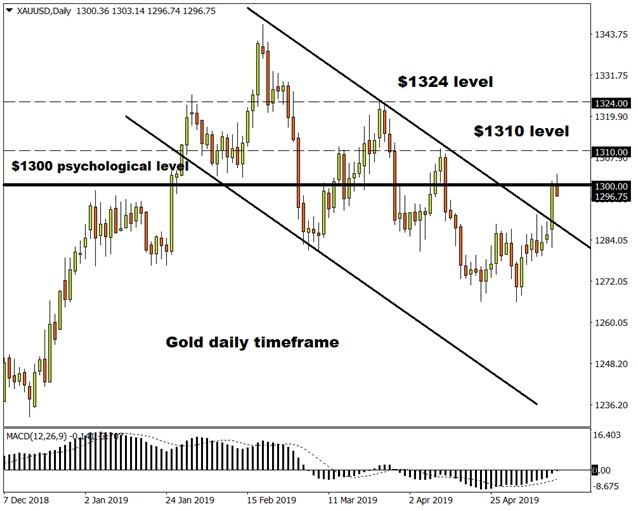
Gold has experienced an incredible appreciation early this week with prices sprinting towards the psychological $1300 level as risk aversion sent investors rushing to safe-haven assets. Appetite for the precious metal is set to remain robust amid market fears over sizzling trade tensions negatively impacting global economic growth.
In regards to the technical picture, Gold is turning bullish on the daily charts as prices have broken above the previous higher low at $1290. A solid breakout and daily close above $1300 is likely to encourage a move higher towards $1310 and $1324, respectively.
Commodity spotlight – WTI Oil
Oil bulls look exhausted and ready for early retirement this quarter, and this continues to be reflected in price action. Brent futures have fallen by some 6 percent since theyear-to-date high of $74.75/bbl on April 25 to now remain mostly stuck around the $70/bbl floor.
Bulls are struggling to find any support from geopolitical risks in the Middle East, supply disruptions in Nigeria, Venezuela and OPEC-led supply cuts. Growing uncertainty over US-China trade developments have clearly clouded the global demand outlook for Oil and this continues to weigh on prices.
All eyes will be on this week's OPEC+ committee meeting in Jeddah which investors will be scrutinizing for fresh clues about the future of the OPEC+ production cut campaign. Will OPEC agree to reduce or eliminate the production cuts in June? This is a question on the minds of many investors.
Gold Surges On Risk-Off Sentiment
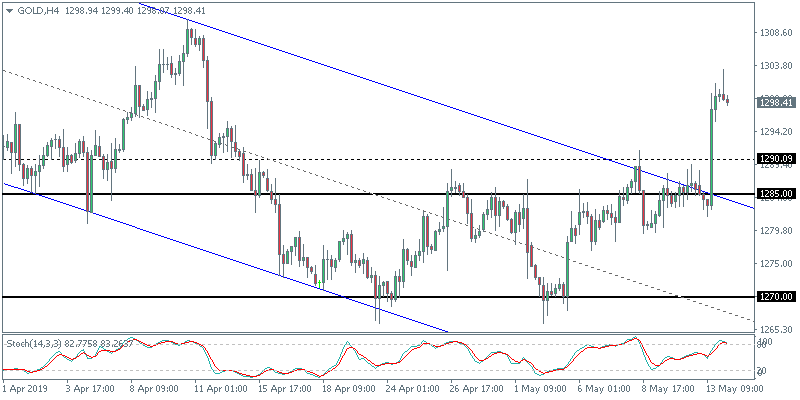
The precious metal surged over 1% on Monday. The gains came during the early NY trading session after reports about China raising tariffs on US goods made news. Gold touched intraday highs of 1300 before retreating slightly. The precious metal has been trading choppy, tracking the global cues.
Will Gold Maintain the Upside Bias?
After the breakout from the 1285 resistance level, gold prices quickly advanced to test the 1300 price point. However, the daily chart continues to point to the divergence which could see price stabilizing in the near term. A retest of the 1285 level could see this price level turning to support. If gold holds this level, we expect to see a gradual shift to the upside.
Oil Declines 1.2% On Slowing Growth Concerns
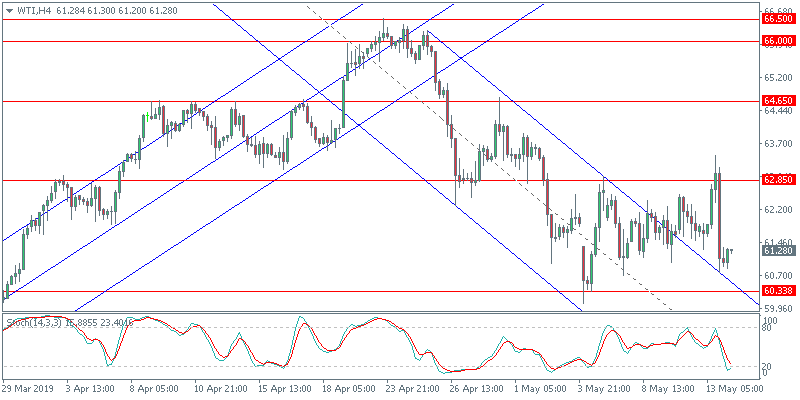
WTI Crude oil prices plummeted 1.2% on the day after price briefly tested intraday highs of $62.85. The declines came on worries that the escalating trade wars could potentially hit global growth. Meanwhile, news reports about two Saudi oil tankers being sabotaged led to a brief rebound in price earlier in the day.
WTI Crude Oil Could Remain Flat
Despite the intraday bounce, the short term outlook for oil prices remain flat. Trading within the established range of 62.85 and 60.33, we do not see this range being breached. The bias remains to the downside for the moment as oil prices could establish the support at 60.33 more firmly. Failure to retrace back to 64.65 could see price starting to build the upside momentum if the lower end of the range holds the declines.
Euro Muted, Waits For Industrial Production Data
The common currency was muted to the trade war tensions as it fell 0.08% on the day. Lack of fundamentals kept the euro currency confined to its recent range. The economic docket today will see the release of the final inflation figures for Germany and the ZEW economic sentiment index. This is later followed by the Eurozone's industrial production data.
Will the Euro Breakout from its Range?
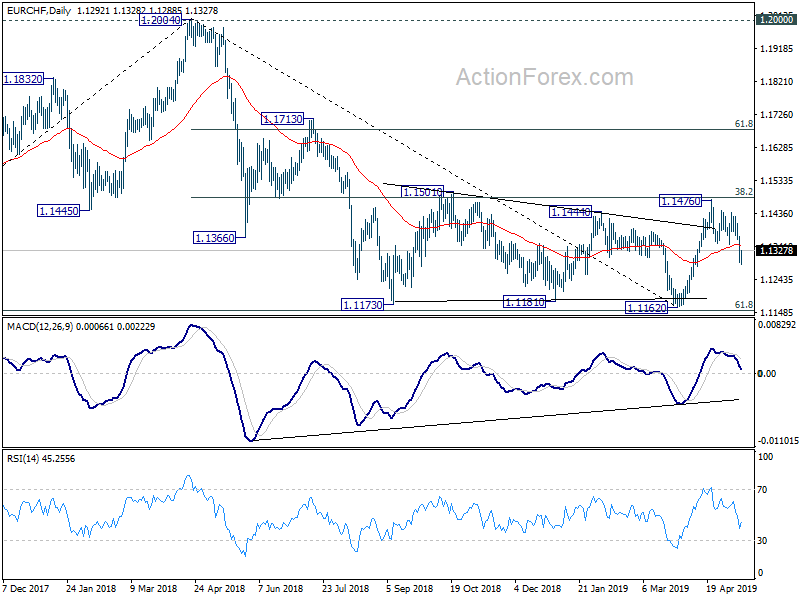
Price tested the upper end of the range at 1.1250 but after a brief attempt, settled back lower. In the process, EURUSD has been posting a modest uptrend. The minor trend line will be critical as a break down will see price retreating and potentially testing the lows again at 1.1140. We do not expect to see the common currency breakout from this range at this point.