Sample Category Title
Elliott Wave Analysis: AUD/USD And AUD/JPY Can Face Support, And A Bullish Run
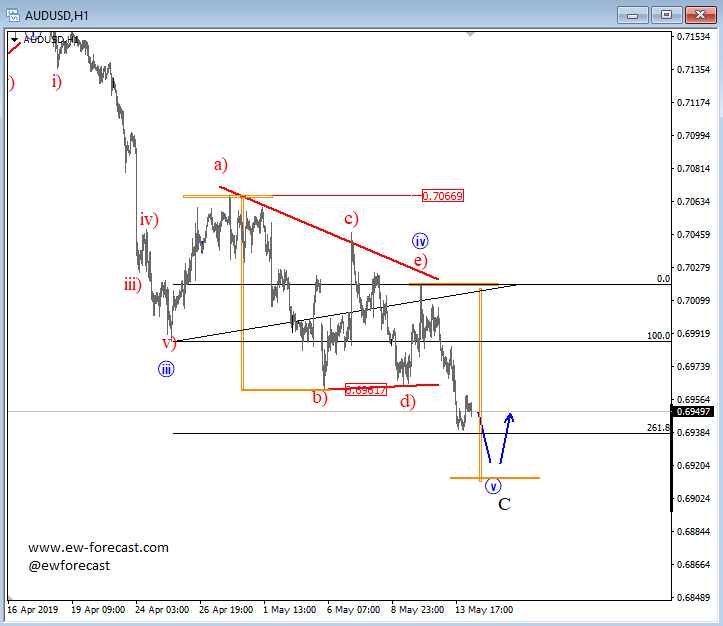
AUDUSD came out of a triangle as expected so it represents final leg down of a higher degree trend. If that is going to be the case then bears will slow down and bulls will wake up soon. Our attention would be on a five wave bounce to confirm a low in place. Under such scenario even AUDJPY would be very interesting if USDJPY would continue higher at the same time.
AUDUSD, 1h
AUDJPY, 4h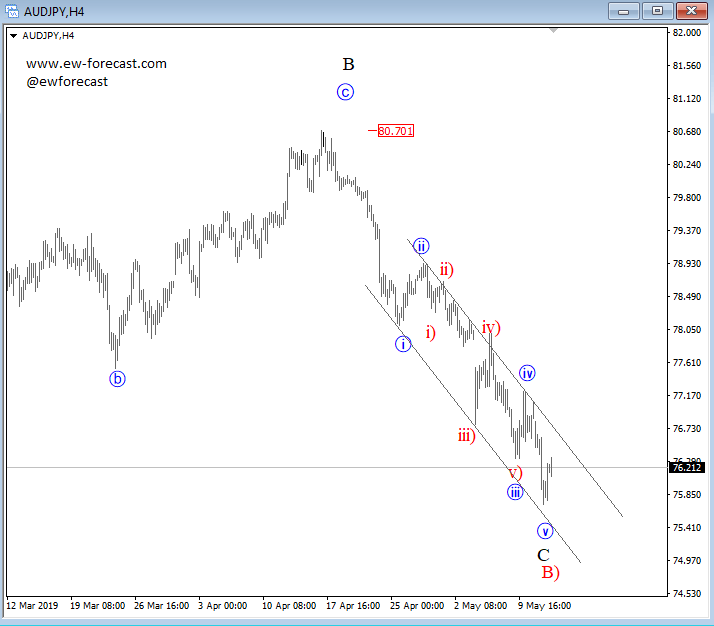
Gold Remains The Safe Haven Of Choice
Dead cat bounce?
A messy start to the week in markets is being given a temporary break on Tuesday, something that may just be a dead cat bounce at an otherwise nervy time.
The announcement of increased tariffs between the US and China has clearly shaken investors and once again we're already talking about the next round. We've gone full circle from a deal to being a matter of time from being done to the prospect of full tariffs between the world's two largest economies. The global economy was already vulnerable and investors had gradually come back on board but this is not a good development and the Fed is going to be reluctant to save the day, as we've already seen.
If we get full tariffs on China, the question then becomes where Trump targets next. If his ratings don't suffer and even improve, does he turn his attention to Europe? Or anywhere else, for that matter. Next month's G20 has suddenly become the event of the year so far and the only thing that may be stopping markets plummeting more is the belief that an agreement will be reached there. I'm not so sure.
Another FOMO rally in bitcoin?
Bitcoin is enjoying another good day, trading back above $8,000 and increasing its gains since Saturday to more than 25%. There's been no shortage of explanations for the recent spike, some more ludicrous than others and none that are nearly significant enough to match the size of the leap we've seen. The only thing that's clear is that cryptos may be maturing in many ways but price action hasn't changed.
Until it does, I struggle to see institutional investors wanting to get too involved. These big gain days look great and people are always attracted to the prospect of big gains but last year showed us what the flip side of that looks like and it's ugly. The Fidelity story is obviously interesting but this would be some delayed reaction. Bitcoin has rallied plenty in the past because of FOMO, this doesn't look any different.
Gold remains the safe haven of choice
It took some time and there was some clear feet dragging but eventually gold reacted as you'd expect to yesterday's stock market sell-off and overall risk aversion, reasserting its position as a traditional safe haven (the notion that it's being replaced by bitcoin really is ridiculous). A battle around $1,290 was fierce at one stage but once it became clear that US investors were not about to buy the dip at the open, gold took off.
The rally took us just above $1,300 where we've now seen some profit taking. This is just shy of 50% of the decline from this year's high in February to the lows in April which makes roughly the $1,300-$1,320 area very interesting indeed. A rotation around here would suggest the momentum remains with the bears, while a break above could be a good bullish signal.
USD/JPY Outlook: Daily Cloud Base To Cap Correction And Keep Bears In Play
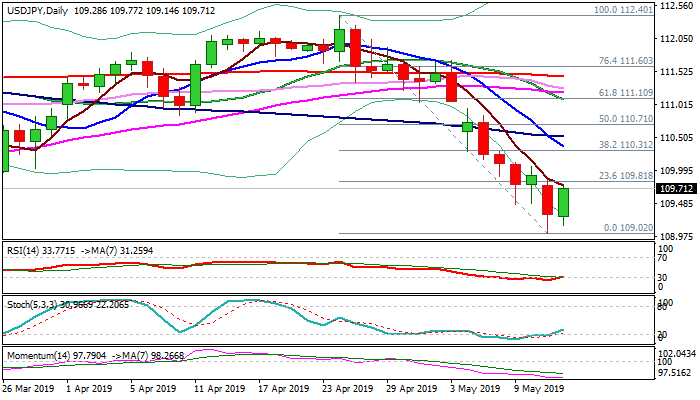
The pair bounces on Tuesday after falling to new 2 ½ month low at 109.02 the previous day, as markets recover from initial shock on signals of US/China trade conflict escalation.
Profit-taking boosted recovery that was also signaled by oversold studies and bullish divergence on daily slow stochastic.
Near-term picture is bearish and current action is seen as positioning ahead of fresh weakness, with upticks expected to stay below key barrier at 110.31 (Fibo 38.2% of 112.40/109.02 / daily cloud base, reinforced by falling 10SMA) to keep bears intact, for renewed attack at 109 handle and possible extension towards target at 108.49 (Fibo 50% of 104.59/112.40 31 Jan higher low).
Only sustained break above 110.31 would sideline bears and allow for stronger correction.
Res: 109.76, 110.00, 110.31, 110.71
Sup: 109.60, 109.42, 109.02, 108.49
Bitcoin At 10-Month High, TRY Under Pressure
Bitcoin rose to a 10-month high
Investors almost forgot about crypto-currencies as the crypto-winter kept prices low. At the end of the month of March, Bitcoin price were stalling below the $4,000 threshold as the outlook for this emerging asset class remained clouded. However, over the first half of May, the price of Bitcoin more doubled as it reached $8,330 on Tuesday morning. Over the same period, the market capitalisation of the most famous cryptocurrency increased by $73 billion to $146 billion. Similarly, the surge gave a boost to the entire market as the aggregate market capitalisation of the entire market (around 2170 digital assets) jumped $146bn to $243bn, up 66% in roughly two weeks.
Many theories have been put forward to explain why demand for cryptocurrencies has increased steadily over the last few months. Indeed, the total market capitalisation printed a low at $100bn on December 15th last year. Since then it has moved only one way: up. Technical analysis is often put forward to explain crypto markets, while fundamental analysis is often overlooked. Recently, it looks like Bitcoin behaved like a safe-haven assets against the backdrop of worsening risk sentiment, thanks to heightened US-China trade tensions and escalating confrontation between Iran and the US over the former’s nuclear program. However, we believe that despite the fact that cryptos have remained in the shadow lately, the global environment as kept improving: regulators and legislators had time to determine how cryptos should be regulated, more and more retailers adopted them as mean of payment (Amazon, Microsoft, Whole Food, Bed Bath & Beyond, Lowe’s, and many more) and institutional money kept flowing slowing into cryptos.
Crypto prices have rose massively lately and in a short period of time. Even though, we remain bullish on Bitcoin, and cryptos in general, we doubt that the current pace of increase is sustainable. Therefore, that would not be a surprise to us should the market experiences a sharp correction in the coming days. For now, Bitcoin is stuck below the $8,480 resistance (high from July 25th 2018).
TRY under renewed pressures amid trade war, election re-run
Things have not taken the turn expected by investors. The rise of US trade duties on Chinese products pushed Chinese authorities to take a similar step and impose additional tariffs ranging from 5% to 25% on a total of $60 billion-worth US products such as natural gas, vegetables or cosmetics. Consequently, risk aversion rises, thus increasing demand for safe-haven currencies (CHF, JPY) at the expense of AUD, NZD, SEK, NOK or EM currencies such as the Turkish lira. Yet risks of an open trade war between both nations remains very unlikely, as the long-awaited Trump-Xi meeting is supposed to take place during the 28-29 June 2019 G20 meeting in Osaka. There is therefore more to be expected from both sides in the coming weeks when it comes to negotiations.
The recent developments have maintained the Turkish lira under heavy pressures, despite the Central Bank of Turkey (CBT) attempt to close the gap in Turkish lira by suspending funding of its 1-week repo rate (24%), and so forcing financial institutions to finance at a higher overnight rate (25.50%). Furthermore, a re-run of mayoral elections in the capital is not helping. The release of current account balance, although presenting a narrower trade deficit gap ($-0.59 billion), does not provide much of a sign of optimism as both exports and imports are in a downtrend, suggesting a lower growth outlook. Accordingly, we can expect the CBT to maintain more stimulus in this backdrop, which should prompt further lira weakness.
Currently trading at 6.0658, USD/TRY is head along 6.1295 short-term.
Markets Steadier After Trump’s Comments, Gold Eases From Highs
- China retaliates by raising its own tariffs against US products, throwing markets into turmoil
- But some optimism returns to markets after Trump says he thinks trade talks will “be very successful”
- Gold softer after surging on Monday, stocks sell-off eases
Volatility eases as Trump keeps trade deal hopes alive
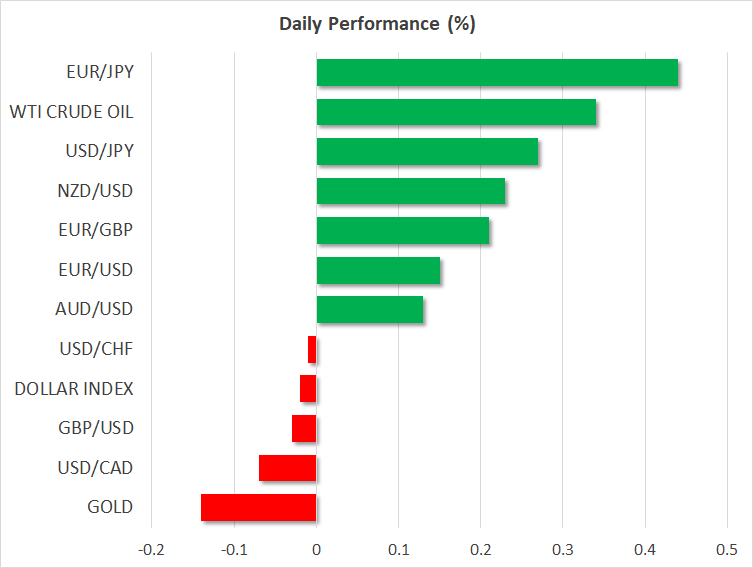
After a day of turmoil in financial markets, things got off to a steadier start on Tuesday with the help of more upbeat comments by US President Trump. Global equities plunged on Monday, along with the US dollar, while gold soared after China retaliated to Trump's tariff hike by raising the levies on more than 5,000 US imports, amounting to $60 billion. In addition to the tariff increases already announced, the Trump administration is studying the possibility of slapping duties on all remaining imports from China.
Stocks in the US suffered their biggest one-day loss since early January, with all three main indices ending the day more than 2% lower. However, stock futures are suggesting Wall Street will open around 0.5% higher today as markets bet that China and the US will find a way to work through their differences.
There was some relief yesterday after Trump said no decision had been taken yet on the remaining tariffs. Sentiment was further boosted later in the day when Trump was quoted as saying “I have a feeling it's going to be very successful” with regards to the trade talks.
Gold retreats from highs as risk assets recover
The turnaround in risk sentiment dragged the safe-haven gold away from one-month highs, having only just managed to break above the $1300 level. Though, technicals for the precious metal remain bullish in the short term, pointing to plenty of caution still in the markets.
The risk-sensitive Australian and New Zealand dollars edged higher on Tuesday but only marginally, while the Chinese yuan reversed its earlier gains to fall to fresh 4½-month lows against the US dollar.
The greenback was able to make a more notable rebound, however, rising from 3-month troughs below the 109-yen level to climb to around 109.65 yen in early European trading as US Treasury yields pulled away from their lows. On a broader level, the dollar index was steady around 97.35.
With the US data schedule looking relatively light until tomorrow's April retail sales report, trade headlines are expected to continue to be the main driver for the dollar as well as for overall market sentiment.
Pound under pressure on falling Tory support for cross-party Brexit talks
The euro continued to breeze its way through the current turbulence, holding steady in the $1.1215-1.1265 range. Traders will be watching Eurozone industrial output numbers for March and the German ZEW economic sentiment gauge for May due later in the session for the latest clues about the health of Europe's economy amid some tepid signs of a turnaround.
The pound remains on the backfoot, however, slipping below the $1.30 on growing doubts about whether Prime Minister May will be able to strike an agreement with the opposition Labour party to win cross-party support for her Brexit deal.
There is growing opposition from within her Conservative party for May to ditch talks with Labour as she faces calls to resign, while Labour MPs are unlikely to back the deal unless it's attached with a promise to hold a second referendum. May is reportedly planning to reopen talks with the European Union to discuss possible changes agreed with Labour to the political declaration on the future relationship. However, markets remain unconvinced and there could be further losses in store for cable now that it's once again breached its 200-day moving average.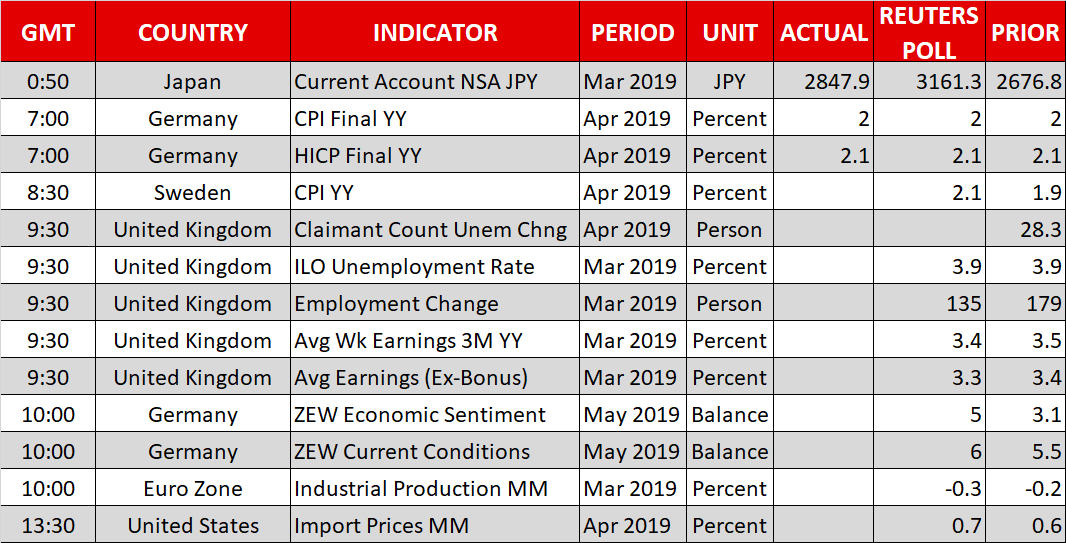
Forex Technical Analysis: EUR/USD, USD/JPY, GBP/USD
EUR/USD
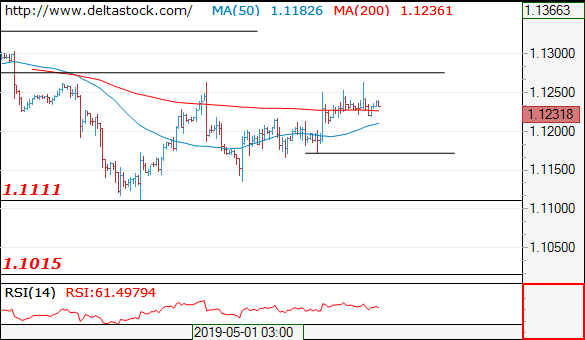
Current level - 1.1231
My outlook here is bearish, for a break through 1.1170 trigger, towards 1.1110 low. Initial resistance lies at 1.1275.
| Resistance | Support | ||
| intraday | intraweek | intraday | intraweek |
| 1.1275 | 1.1330 | 1.1170 | 1.1010 |
| 1.1275 | 1.1450 | 1.1110 | 1.0860 |
USD/JPY
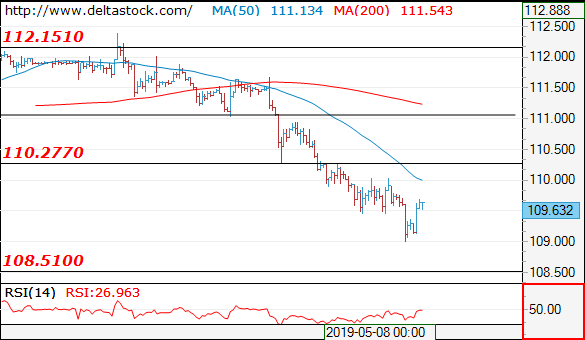
Current level - 109.63
There is a minor reversal at 109.00, but the signal is weak on the senior frames, so my outlook here is neutral.
| Resistance | Support | ||
| intraday | intraweek | intraday | intraweek |
| 110.30 | 113.20 | 109.00 | 108.50 |
| 111.65 | 114.50 | 108.50 | 107.40 |
GBP/USD
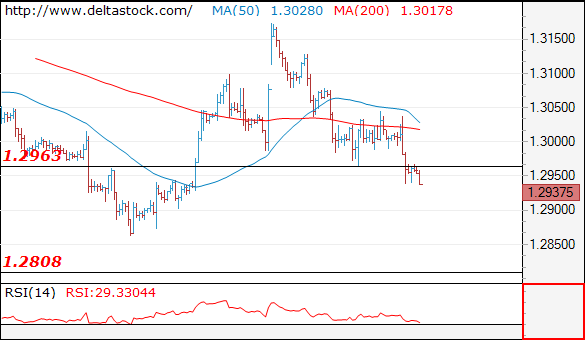
Current level - 1.2937
The pair broke through 1.2960 and the bias is bearish, for a slide towards 1.2860 lows. The latter should provoke another, third consolidation leg, towards 1.3050.
| Resistance | Support | ||
| intraday | intraweek | intraday | intraweek |
| 1.2960 | 1.3340 | 1.2860 | 1.2860 |
| 1.3050 | 1.3450 | 1.2810 | 1.2610 |
GBP/JPY Daily Outlook
Daily Pivots: (S1) 140.95; (P) 141.91; (R1) 142.62; More...
Intraday bias in GBP/JPY remains on the downside at this point. Rebound from 131.51 should have completed at 148.87 already. Deeper fall should be seen to 61.8% retracement of 131.51 to 148.87 at 138.14 next. Sustained break there will pave the way to retest 131.51 low. On the upside, above 143.24 minor resistance will turn intraday bias neutral and bring consolidations, before staging another decline.
In the bigger picture, current development suggests that GBP/JPY was rejected by 149.98 key resistance. And medium term fall from 156.59 is still in progress. Break of 131.51 will target 122.36 (2016 low). On the other hand, decisive break of 149.98 should confirm that medium term fall from 156.59 (2018 high) has completed at 131.51 already. Further rally would be seen back to 156.59 resistance and above.
EUR/JPY Daily Outlook
Daily Pivots: (S1) 122.34; (P) 122.91; (R1) 123.27; More....
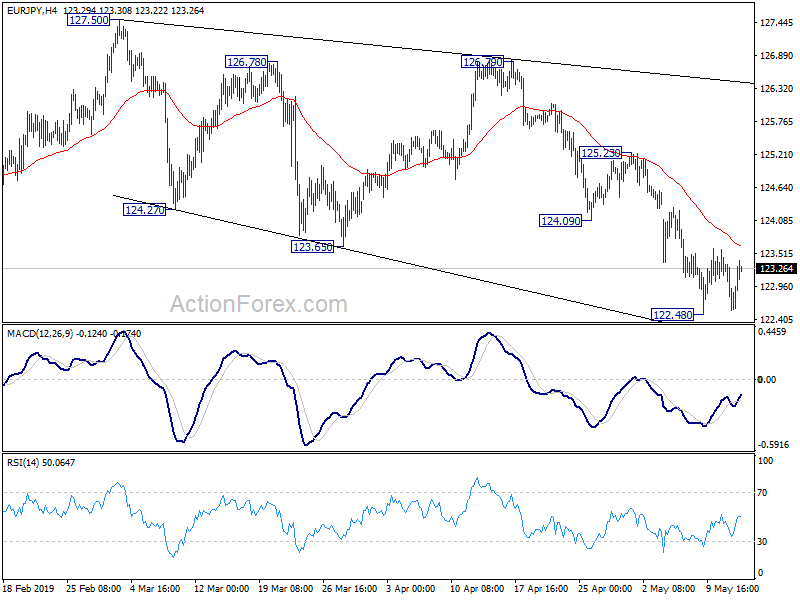
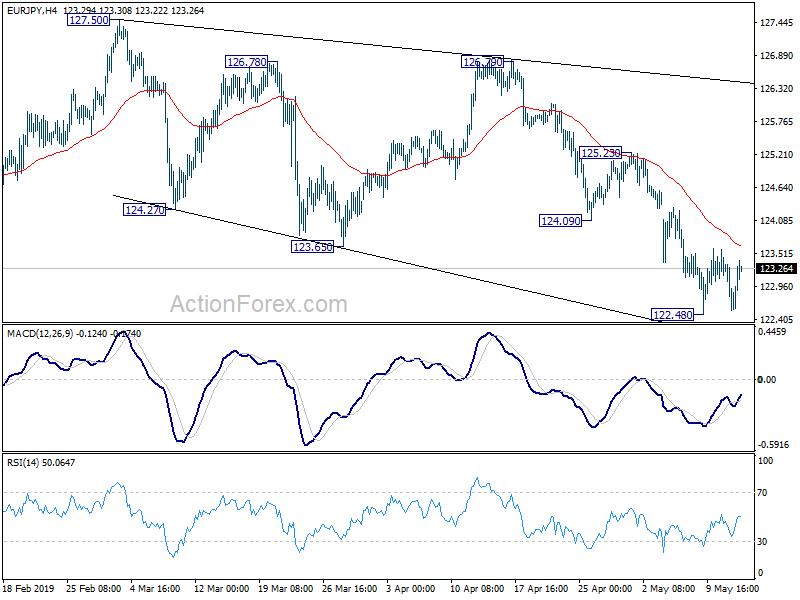
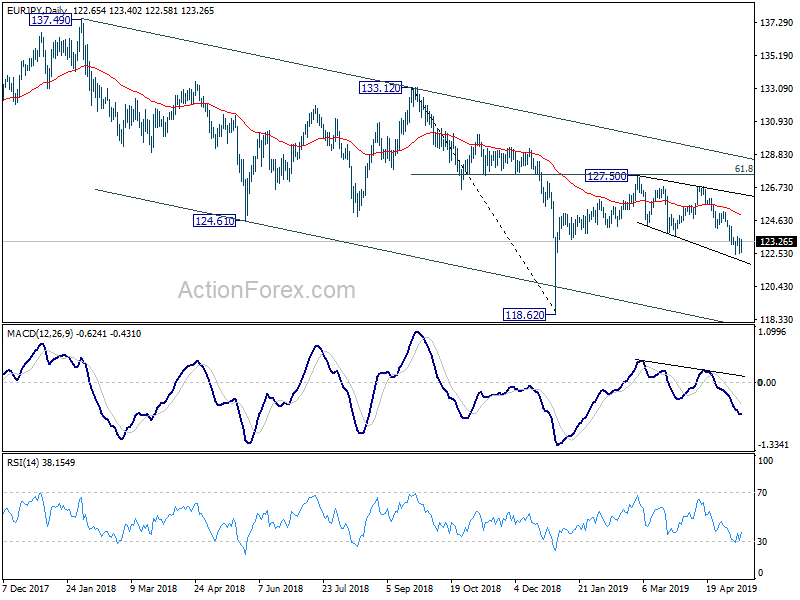
EUR/JPY is staying in consolidation from 122.48 temporary low and intraday bias remains neutral first. In case of stronger recovery, upside should be limited by 124.09/125.29 resistance zone to bring fall resumption. Current development suggests that rebound from 118.62 has completed at 127.50 already. On the downside, break of 122.48 will target retest of 118.62 low.
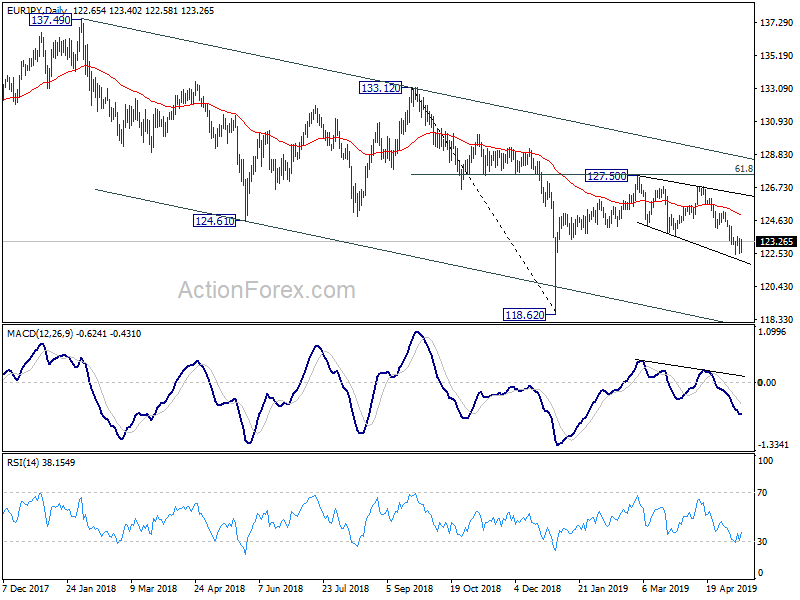
In the bigger picture, current development argues that rebound from 118.62 is merely a correction and has completed at 127.50. EUR/JPY is staying in long term falling channel from 137.49 (2018 high). Decisive break of 118.62 will confirm resumption of this medium term fall and target 109.20 low. For now, this will be the favored case as long as 125.23 resistance holds.
EUR/GBP Daily Outlook
Daily Pivots: (S1) 0.8630; (P) 0.8656; (R1) 0.8689; More...
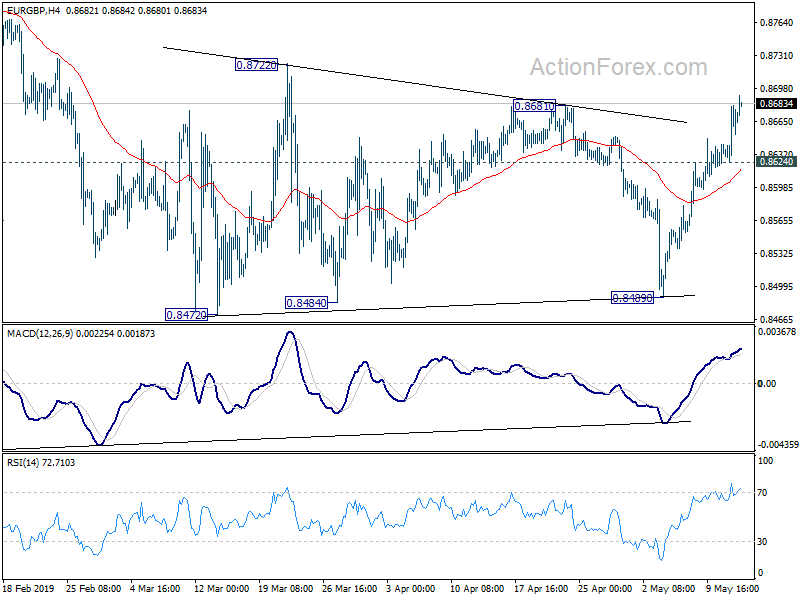
EUR/GBP rises to as high as 0.8691 so far. The break of 0.8681 resistance dampens our bearish view. Instead, it suggests that, at least , consolidation pattern from 0.8472 is extending with another rising leg. Intraday bias is back on the upside for 0.8722 first. Break will target 0.8840 resistance. On the downside, break of 0.8624 minor support will turn bias back to the downside for 0.8472 low instead.
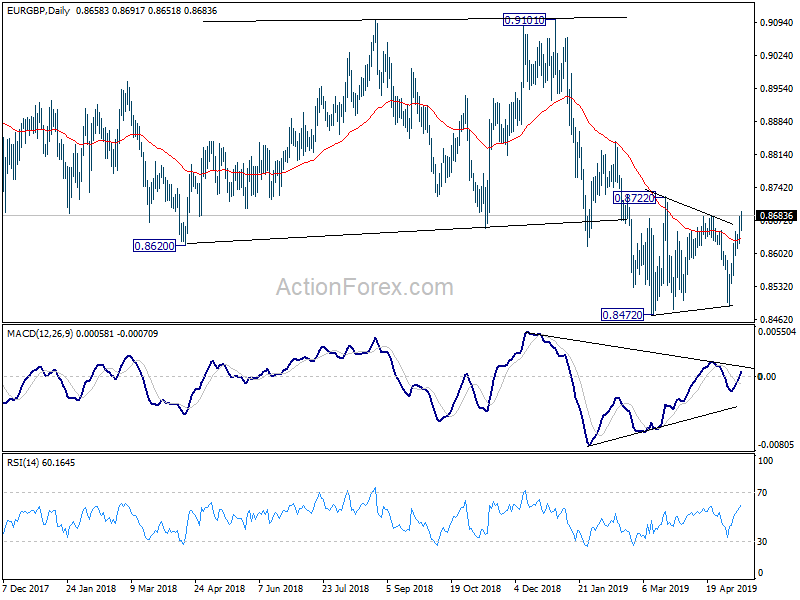
In the bigger picture, medium term decline from 0.9306 (2017 high) is seen as a corrective move. Current development suggests that it's extending through 0.8312 support towards 50% retracement of 0.6935 (2015 low) to 0.9306 at 0.8121. We'll look for strong support around there to contain downside to complete the correction. But for now, break of 0.8681 resistance is needed to be the first sign of medium term bottoming. Otherwise, outlook will stay bearish in case of recovery.
EUR/AUD Daily Outlook
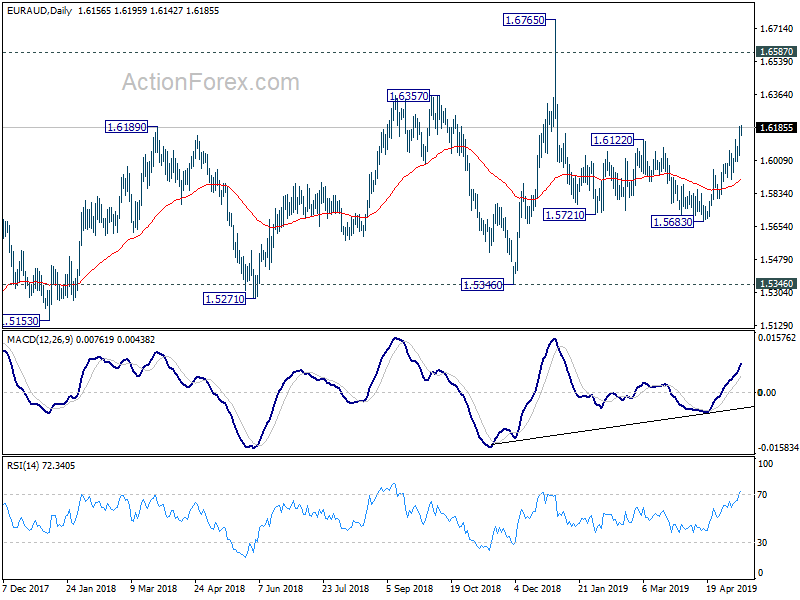
Daily Pivots: (S1) 1.6078; (P) 1.6133; (R1) 1.6220; More...
Intraday bias in in EUR/AUD remains on the upside at this point. Prior break of 1.6122 resistance indicates that correction form 1.6765 has completed with three waves down to 1.5683. Further rise should be seen back to retest 1.6765 high. On the downside, below 1.6086 minor support will turn intraday bias neutral and bring consolidation first, before staging another rally.
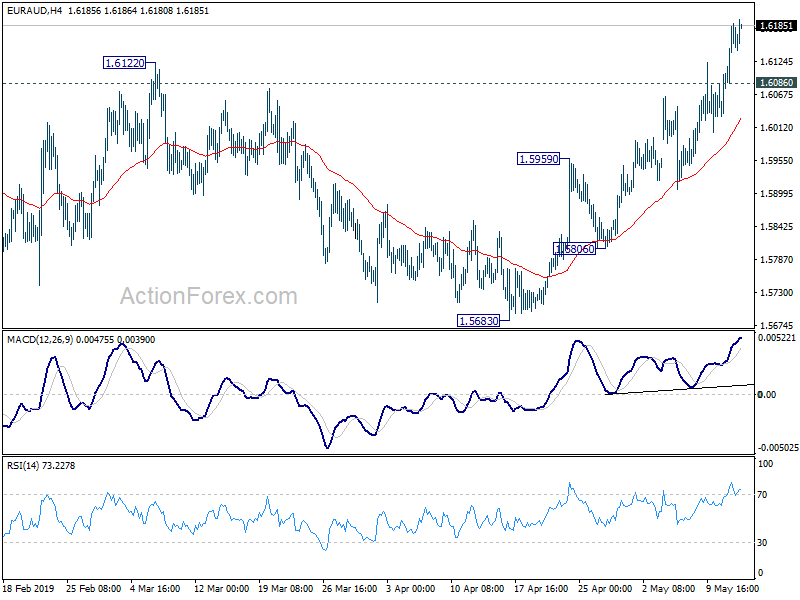
In the bigger picture, as long as 1.5346 support holds, outlook will still remain bullish. Up trend from 1.1602 (2012 low) is expected to resume sooner or later. Break of 1.6765 will target 61.8% retracement of 2.1127 (2008 high) to 1.1602 at 1.7488 next. However, firm break of 1.5346 key support will indicate trend reversal, with bearish divergence condition in weekly MACD, and turn outlook bearish.