

Sample Category Title
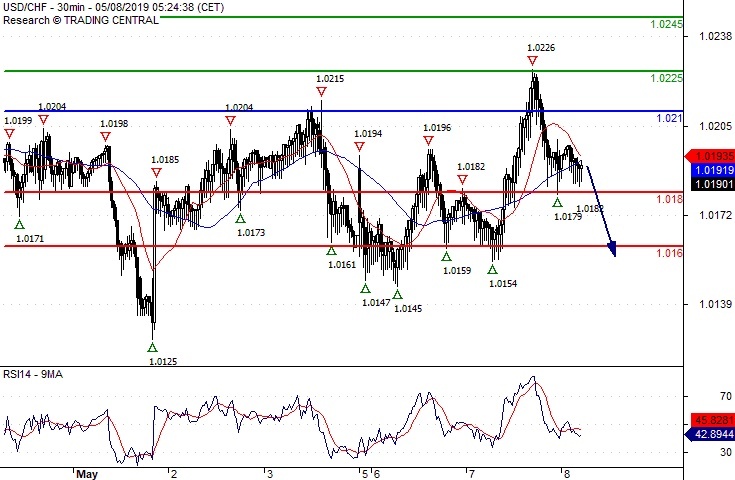
USD/CHF Towards 1.0160
Pivot (invalidation): 1.0210
Our preference Short positions below 1.0210 with targets at 1.0180 & 1.0160 in extension.
Alternative scenario Above 1.0210 look for further upside with 1.0225 & 1.0245 as targets.
Comment A break below 1.0180 would trigger a drop towards 1.0160.
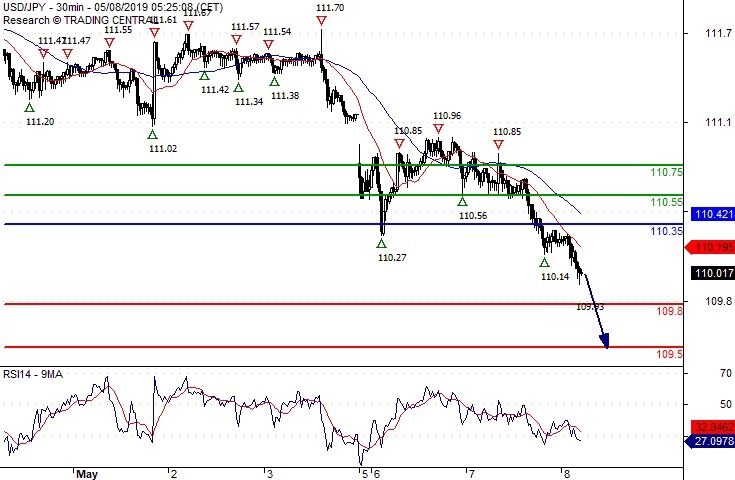
USD/JPY Watch 109.50
Pivot (invalidation): 110.35
Our preference Short positions below 110.35 with targets at 109.80 & 109.50 in extension.
Alternative scenario Above 110.35 look for further upside with 110.55 & 110.75 as targets.
Comment The RSI has broken down its 30 level.
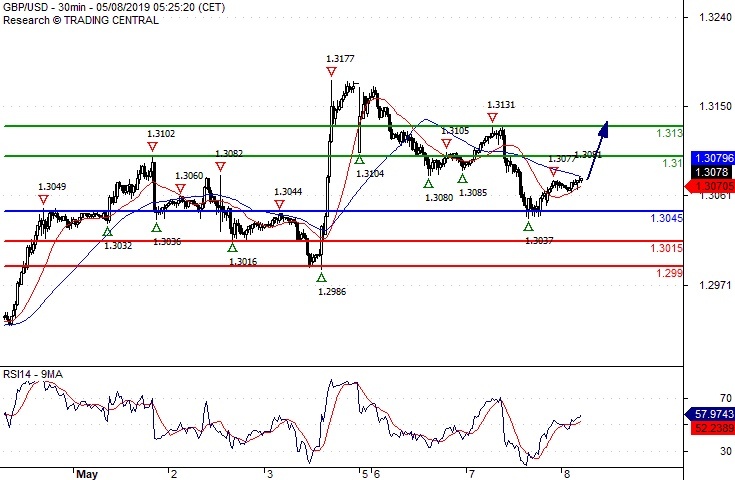
GBP/USD Turning Up
Pivot (invalidation): 1.3045
Our preference Long positions above 1.3045 with targets at 1.3100 & 1.3130 in extension.
Alternative scenario Below 1.3045 look for further downside with 1.3015 & 1.2990 as targets.
Comment The RSI calls for a new upleg.
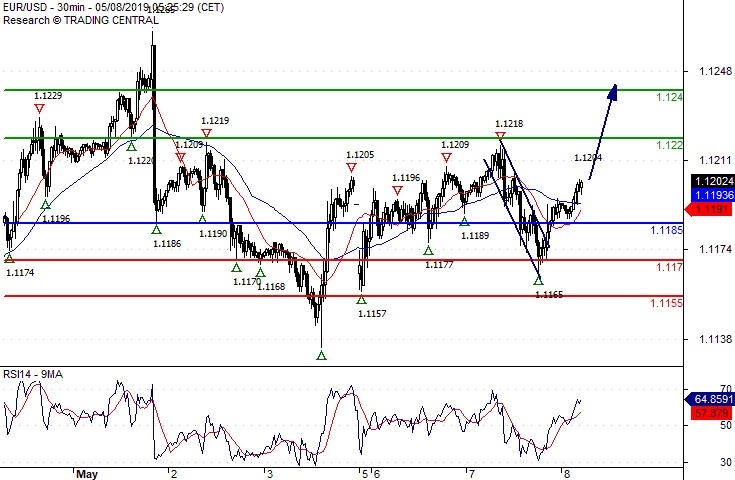
EUR/USD Further Advance
Pivot (invalidation): 1.1185
Our preference Long positions above 1.1185 with targets at 1.1220 & 1.1240 in extension.
Alternative scenario Below 1.1185 look for further downside with 1.1170 & 1.1155 as targets.
Comment The RSI is bullish and calls for further advance.
China exports to US dropped -9.7% from Jan to Apr, imports dropped -30.4%
Latest trade data from China showed that growth in exports in other regions in 2019 so far was merely enough to offset contraction of -9.7% ytd yoy in exports to US. Total export grew a mere 0.2% ytd yoy. On the other hand, total exports contracted -2.5% ytd yoy, as dragged down by -30.4% ytd yoy contraction in exports from US. Trade with EU remained relatively healthy.
In USD terms, in April,
- Total trade grew 0.4% to USD 373.14B.
- Exports contracted -2.7% yoy to USD 193.49B.
- Import rose 4.0% yoy to USD 179.65B.
- Trade surplus came in at USD 13.84B
In USD terms, from January to April total:
- Total trade contracted -1.1% yoy to USD 1399.82B.
- Exports rose 0.2% yoy to USD 744.61B.
- Imports dropped -2.5% to USD 655.21B.
- Trade surplus came in at USD 894.0B.
With US, from January to April total
- Total trade contracted -15.7% yoy to USD 161.2.
- Exports to US contracted -9.7% yoy to USD 122.4B.
- Imports from US dropped -30.4% yoy to USD 39.8B.
- Trade surplus came in at USD 82.6B.
With EU, from January to April total:
- Total trade grew 5.9% yoy to USD 220.1B.
- Exports to EU rose 8.3% yoy to USD 131.5B.
- Imports from EU rose 2.5% yoy to USD 88.5B.
- Trade surplus came in at USD 43B.
With AU, from January to April total:
- Total trade grew 6.65 yoy to USD 51.1B.
- Exports to AU rose 3.4% to USD 14.3B.
- Imports from AU rose 7.9% to 36.8B.
- Trade deficit came in at USD -36.8B.
European Markets Poised To Open Lower | Brent May See A Relief Rally
The threat of higher tariffs on China by the US is still the dominant force in the markets and investors are largely under the influence of the this. The US Trade Representative Robert Lightizer echoed president Trump’s message yesterday by confirming that increase in tariffs are going to take effect on Friday, if there is no deal with China before that.
Asian trading session has been feeble as a result of this and European markets are picking up the momentum where they left off yesterday. Major US benchmark indices also closed lower yesterday and the US futures are not looking pretty as well. If no common ground is established between the US and China, these worries would crush the markets and this could easily intensify the sell-off.
However, market participants still firmly believe that a deal is the final outcome. This is one of the reason that we have not seen the volatility index exploding again like it did when Trump initially tweeted about this. It is important to keep in mind that the volatility index has hit the highest point for this year and touched the level of 21.09 yesterday.
Another likely scenario which investors are looking at is that the additional tariffs introduced by President Trump may kick in first before China and US make a deal and this would only make the negotiations more arduous. If there is no deal between the two super powers by Friday, we are expecting the global equity markets to drop by at least 20 percent.
We are still in the earning season and the results so far have been pretty much astonishing, but if the tariffs are raised from 10% to 25% on $200 billion of Chinese good, it would also impact the S&P500 earning. These earnings can easily drop as much as 10% and the longer it lasts, the worse it would become.
Oil prices have been out of luck for the past few days and a positive signal has emerged. Speaking from a technical analysis perspective, the golden cross- when the 50-day moving average crosses above the 100-day moving average, has taken place for the Brent oil prices. It is likely that the path of least resistance may remain to the upside.
AUDUSD Finds Strong Support At 4-Month Low, Creates Bearish Triangle
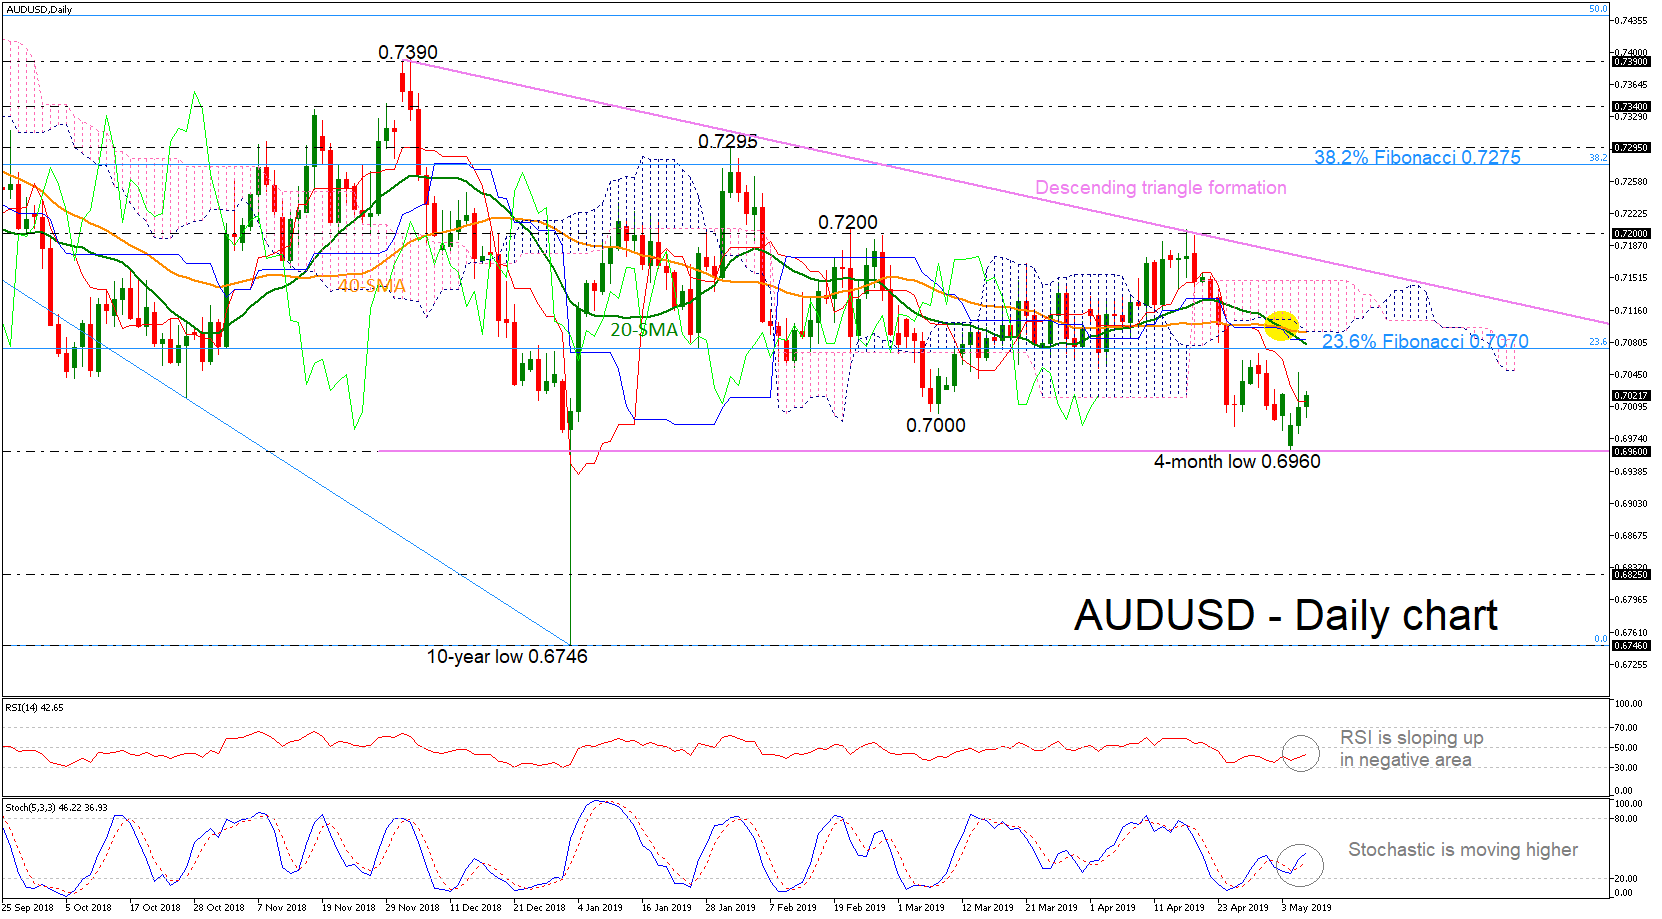
AUDUSD is looking more positive as prices have climbed above the 0.7000 handle after bouncing off the four-month low of 0.6960, however, it is creating a descending triangle formation starting from 0.7390 and finding significant support at 0.6960 over the last five months.
Currently, the pair is hovering near the red Tenkan-sen line with the technical indicators suggesting a possible upside correction. The RSI indicator is sloping upwards in the negative territory, while the stochastic oscillator is moving higher after it posted a bullish cross between the %K and %D lines in the daily chart.
Should the pair extend its positive move, the next resistance could come around the 23.6% Fibonacci retracement level of the downleg from 0.8135 to 0.6746, around 0.6960. Slightly above this hurdle, the bearish cross within the 20-and 40-simple moving averages (SMAs) as well as the lower surface of the Ichimoku cloud is taking place near 0.7090. Even higher, the price could meet resistance at the falling trend line of the triangle pattern around 0.7150.
Otherwise, if the there is a break of the strong support of 0.6960, the price could touch 0.6825, taken from the low on January 2016, before meeting the ten-year low of 0.6746.
Summarizing, in the short-term, the price is turning slightly bullish, though, in the medium-term, we are expecting more losses once if there is a daily close below the descending triangle.
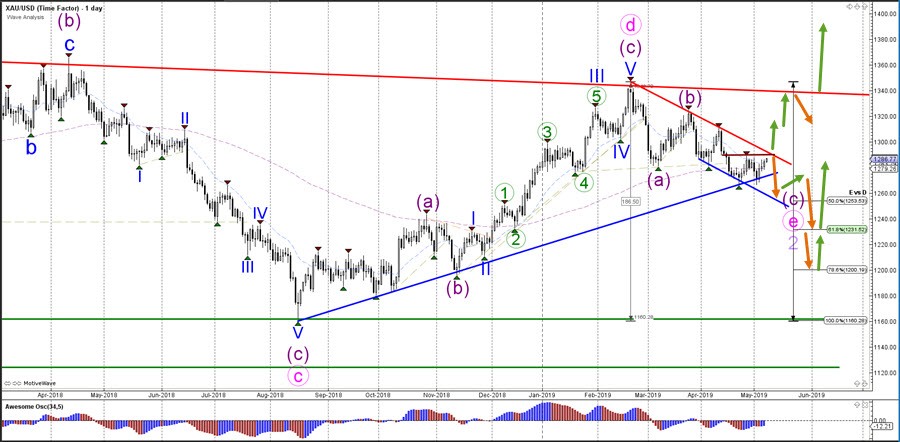
XAU/USD Challenges Resistance Zone In Downtrend Channel
The XAU/USD bull breakout above the resistance (red) line of the downtrend channel could indicate the end of the bearish price swing and aim for the next resistance trend line (red) whereas a bearish bounce could favor a downtrend continuation once price breaks below the key support line (blue). A bearish break aims for the Fibonacci levels of wave E vs D.
The XAU/USD seems to be completing a larger ABC (orange) correction within a wave 4 retracement (green) but the current wave outlook is only valid if price fails to rbeak above the resistance zone. A break below the support lines (blue) could confirm this wave pattern and indicate a downtrend continuation. On the other hand, a bullish break above the resistance (red) invalidates this wave pattern and indicates potential bullish momentum.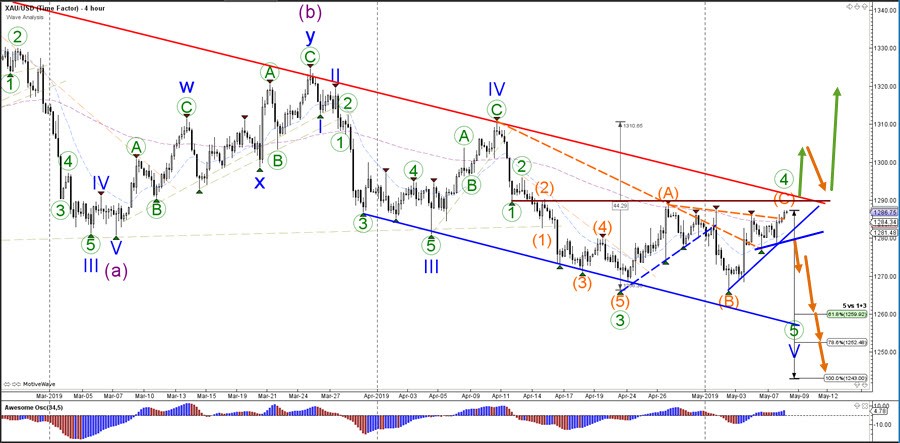
Elliott Wave View: Further Weakness In GBP/JPY
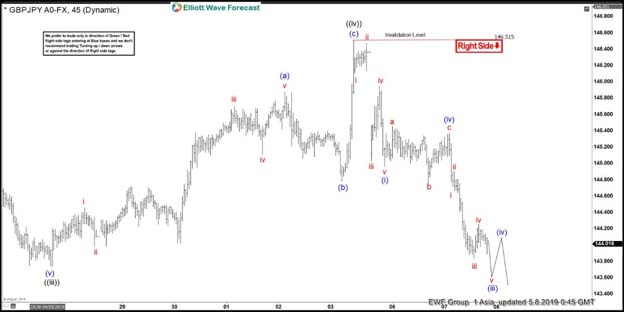
Short Term Elliott Wave view on GBPJPY suggests that further downside is expected. On the chart below, wave ((iii)) ended at 143.74 and wave ((iv)) bounce ended at 146.51. Pair has since broken to new low below 143.74, validating the downside bias. Internal of wave ((iv)) unfolded as a zigzag Elliott Wave structure where wave (a) ended at 145.87, wave (b) ended at 144.78, and wave (c) ended at 146.5.
Wave ((v)) is currently in progress as an Elliott Wave impulse structure. Down from 146.5, wave (i) ended at 144.96, wave (ii) ended at 145.37, and wave (iii) ended at 143.62. Internal of wave (i) and (iii) also subdivided as an Elliott Wave impulse in lesser degree. Expect wave (iv) bounce to fail in 3, 7, or 11 swing for further downside. We don’t like buying the pair. Potential target for wave (iv) is 23.6 – 38.2 Fibonacci retracement of wave (iii) which comes at 144.28 – 144.48 area. Ideally the rally does not extend to more than 50% of wave (iii) at 144.48 as that can increase the risk that the cycle from May 3 high has ended. As far as wave (ii) pivot at 145.37, and more importantly pivot at 146.5 stays intact, the right side remains lower.
GBPJPY 1 Hour Elliott Wave Chart
Currencies: EUR/USD Still Going Nowhere Even As Trade Tensions Persist
- Rates: Core bonds profit from trade-related risk aversion
Main US and European stock markets lost up to 2% and the technical pictures suggests room for more losses. Core bonds profited from risk aversion and might continue to do so. The eco/event calendar remains thin. A speech by ECB President Draghi and a US 10-yr Note auction are wildcards. - Currencies: EUR/USD still going nowhere even as trade tensions persist
The euro lost temporary ground after the European Commission further downgraded EMU growth forecasts. However, EUR/USD held within established ranges. US-China trade talks continue to set the tone for global trading. At least for now, uncertainty doesn't help the dollar. Sterling eases a Brexit deal looks still far away.
The Sunrise Headlines
- US equity markets fell by more 1.5% with technology shares underperforming (Nasdaq -1.96%). Asian shares are trading with losses this morning with Japanese shares underperforming on a strong yen.
- China will keep calm against threats of higher US tariffs, calling the approach 'regrettable', and has confidence in its ability to face the trade challenges. VP Liu He will arrive in Washington tomorrow to resume the negotiations.
- New Zealand's central bank cut its interest rates to a historic low 1.50% and hinted at further rate cuts if necessary. Governor Orr said the unexpected weakness in inflation and a weaker employment outlook warranted the move.
- UK PM May and Labour leader Corbyn had another inconclusive round of negotiations, further denting hopes of a cross-party Brexit deal. May faces the UK parliament today, with her government starting to eye other options.
- Japan's Nikkei services PMI declined from 52.0 in March to 51.8 in April. A strong domestic demand keeps the industry in expansion territory (>50). Subindexes new businesses and export business have both decreased.
- Chinese exports decreased -2.7% (Y/Y) in April, down from a 13.8% (Y/Y) increase in March and well below expectations. Imports expanded by 4% (Y/Y), beating market estimations (-2.1% (Y/Y), leading to a trade surplus of $13.84 bn.
- Today's economic calendar is close to empty in both the US and the EMU. Speeches by ECB president Draghi and Fed's Brainard are wildcards. The US and Germany tap the market.
Currencies: EUR/USD Still Going Nowhere Even As Trade Tensions Persist
EUR/USD going nowhere as trade tensions persists
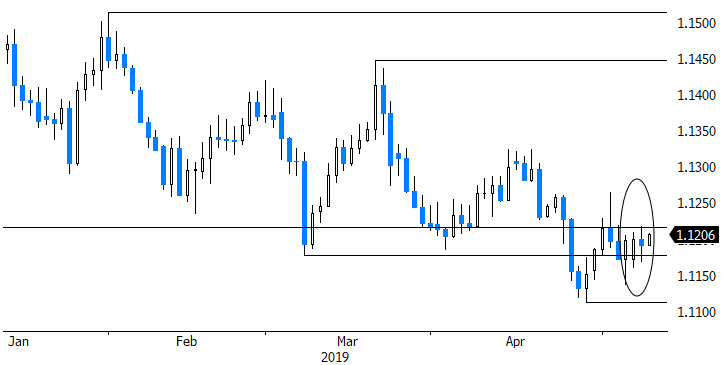
EUR/USD traded with a tentative negative bias yesterday, but all in all the pair was little affected by the global risk-off sentiment. The pair initially hovered in the 1.12 area. Intraday EUR/USD momentum turned a bit more fragile as the EC further downgraded the 2019/2020 EMU growth forecast. However, the intraday swings were confined to the established ranges. EUR/USD closed at 1.1191 (from 1.1199). USD/JPY suffered more from the risk-off sentiment, drifting further south in the 110 big figure to close the day at 110.26.
This morning, uncertainty on the US-China trade talks continues to dominate global trading. High level talks are still said to take place tomorrow. The outcome remains highly uncertain. Asian equities are trading in negative territory. Losses on Chinese markets are modest. Japan underperforms. USD/JPY is testing the 110 level. The Yuan stabilizes (USD/CNY 6.77 area). The China April trade surplus narrowed to $13.84 bln from $32.42 in March, but it is unlikely this report will ease US frustrations. The dollar again hardly profits from the trade tensions. EUR/USD returned to the 1.12 area. The RBNZ cut its policy rate to a record low 1.50% on recent soft inflation and less strong labour data. Another cut in 2020 is possible. NZD/USD dipped temporarily below 0.6550, but currently trades again in the high 0.65 area.
There are few important data except for German March production today. More sentiment driven trade driven by headlines/speculation on the Sino-US trade rift might be on the cards. Of late, the dollar hardly profited from solid US data and/or a context (risk-off) that is usually USD supportive. FX (and other) markets hold on to a scenario of further Fed rate cuts if the global context deteriorates. US/president Trump also doesn't want a stronger dollar. This maybe caps further USD gains, too. We maintain the view that the EUR/USD 1.1110 support area won't be that easy to break.
Sterling eased further off the ST top reached at the end of last week. EUR/GBP rebounded further off the 0.85 support area. Comments on the Brexit talks between the government and the labour opposition suggest no meaningful progress. This will probably oblige the UK to hold EU elections at the end of this month. A test of the 0.8473/0.85 range bottom is rejected. For now, we don't expect sterling to get additional support from investors anticipating a political agreement on Brexit. More trading in the EUR/GBP 0.85/0.87 range might be on the cards.
EUR/USD: uncertainty on global trade doesn't help the dollar