Sample Category Title
NZD And Chinese Trade Data Down
NZD plummets after RBNZ became the first central bank to resume easing
Following the Reserve Bank of New Zealand’s decision to cut the Official Cash Rate to record low 1.50%, the Kiwi tumbled to a fresh multi-month low during the Asian session with NZD/USD hitting 0.6527, down 1.18% on the day. However, the Kiwi quickly trimmed its daily losses as the currency pair climbed back to 0.6592 during the European morning. Improvement in the overall risk sentiment - i.e. the recovery in equities - also helped the Kiwi to climb higher.
The RBNZ’s decision wasn’t really a surprise as most economist anticipated such a dovish move. The unexpected weakness in inflation and the disappointing job report in the first quarter gave the RBNZ no option but to ease monetary policy. The consumer price index slid to 1.5%y/y in the March quarter, while economists expected an increase of 1.7%. Even though the unemployment rate dropped to 4.2% in 1Q, the employment change contracted 0.2%q/q, which shows that this level was reached only because of a reduction of the participation rate (from 70.9% to 70.4%).
The RBNZ, together with the RBA, are amongst the few central banks that have still some room to manoeuvre in term of monetary policy. In addition, unlike the Federal Reserve, they haven’t started to tighten monetary policy, which makes it easier to resume easing. The RBNZ would likely remain data dependant in the coming months with the probability skewed toward another cut.
Chinese trade data down as trade talks are about to resume
US – China trade negotiations initiated in January 2019 are resuming tomorrow although both nations remain divided on major topics. Even if 90% of the trade pact is accepted, sticking points remain when it comes to subsidies, technology transfer, data protection and cloud technology access. Beijing is therefore facing the difficult decision to either find a compromise with its US counterpart, or accept tougher trade tariff constraints.
Markets consider the risk of an escalation in current trade conflict as Chinese Vice Premier Liu He should stay only two days in Washington although his previous visits lasted at least three. Furthermore, China is preparing retaliatory tariffs on US imports if the US would carry out its threat, which would be the worst-case scenario for the world economy. However, both sides should move closer to common ground as speculation about the reasoning behind China's recent about-face is partly due to misinterpretation of the language, since a draft agreement translated into Chinese was distributed only recently to the Politburo while comments were raised. We would therefore consider that time is running out to reach a deal, yet both sides are expected to continue negotiations in order to find an agreement that would minimize disruption on Chinese financial institutions and businesses. Chinese trade data surprised to the downside with trade surplus tightening at $13.84 billion (consensus: $34.56 billion) due to a slump in y/y exports of -2.70% (consensus: 3%), shrinking from last month 14.20%, while imports came higher-than-expected at 4% (consensus: -2.10%) and in positive territory for the first time in 5 months. The recent releases are suggesting that domestic demand remains strong, while the decline in exports is the result of current trade discord. China’s trade surplus with the US stabilized at $21 billion, below 5-year average of $23 billion.
Under current circumstances, we expect the USD/CNY to trade sideways since trade negotiations open on Thursday.
GBP/USD Outlook: Brexit Uncertainty Keeps Sterling Firmly In Red
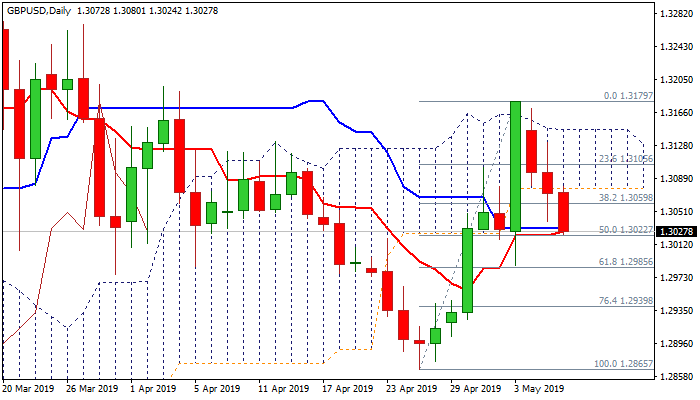
Cable remains in red for the third straight day and extends weakness below daily cloud, following bearish signal that was generated on Tuesday marginal close below cloud base.
More negative impact can be expected on expected on lack of positive news regarding Brexit as uncertainty prompts traders out of pound.
With no results from Tory/Labor party talks and rising concerns that UK PM May could be forced to step down, outlook remains negative.
Three-day weakness retraced the largest part of last Friday’s strong rally and pressures important support at 1.3022 (50% of 1.2865/1.3179 upleg / 10SMA) which guards more significant supports at 1.2987/85 (Friday’s low / Fibo 61.8%).
South-heading daily indicators support scenario, with upticks seen as positioning and to be ideally capped by daily cloud base (1.3077) to keep fresh bears in play.
Res: 1.3059, 1.3077, 1.3102, 1.3131
Sup: 1.3022, 1.3000, 1.2985, 1.2939
Risk Appetite Hits Oil Prices
Markets in risk aversion mode
We're in risk aversion mode in the markets as investors prepare for the prospect of tariffs on Friday rather than a trade deal between the world's two largest economies.
The breakdown in talks has really caught the markets off-guard. It seemed a deal was just widely accepted and basically priced in. Now we're left wondering whether it will happen at all and what impact more tariffs will have on the global economy and markets. The next few days could be massive.
Gold bulls given a new lease of life
Gold is seeing some safe haven support today with a slightly softer dollar also giving it an extra lift. The yellow metal is yet to break through the peak from a couple of weeks ago – around $1,290 – but gold bulls will be very encouraged by recent price action. The failure to break below the low last week was a sign that the trend had weakened – as was its failure to pick up any real momentum after breaking below $1,280 – and now price action may be giving some bullish signals.
A break above $1,290 could see $1,310 once again come back into focus, which coincides with the April peak. It's worth noting that this doesn't necessarily spell the end of the gold sell-off but just that the correction may be earlier and deeper than you would typically see. The potential breakdown in trade talks between the US and China naturally doesn't help risk appetite and has given gold bulls a new lease of life.
Risk appetite hits oil prices
Oil prices are not having much fun in the current risk environment either which shouldn't come as much of a surprise considering global growth fears and their impact on risk are intrinsically linked to future oil demand. It's one of the often more overlooked drivers of oil prices but the correlation is clear. Oil has been on a slide since Trump claimed to have called OPEC regarding oil prices, which came at a time when the market was already looking rather stretched to the upside.
We've seen a bit of a corrective move since then – just shy of 10% - but that may increase. We're currently trading at a very interesting level – around $69-70 in Brent and $60-61 in WTI – a break of which could signal more pain to come. Given the recent shift in risk appetite, this is perfectly feasible.
USD/JPY Outlook: Bears Eye Key Support At 109.71 After Cracking Psychological 110 Level
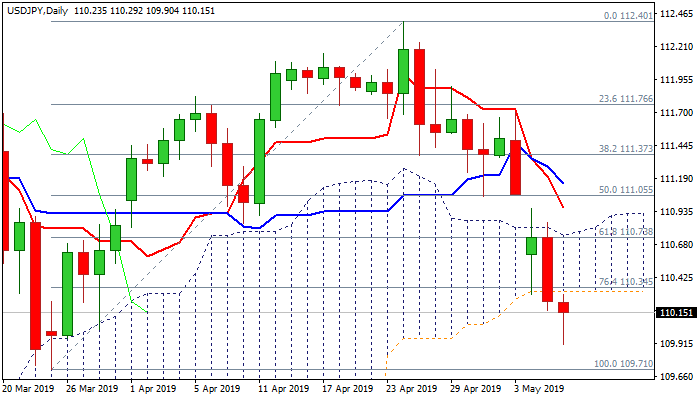
The pair consolidates above new six-week low at 109.90, posted in extension of strong fall on Tuesday (0.45%), but remains firmly in red, following strong bearish signal, generated on Tuesday's close below important supports at 110.34/31 (Fibo 76.4% of 109.71/112.40 / daily cloud base).
Today's probe below psychological 110 support adds to bearish bias, as yen remains supported by safe-haven buying.
Bears eye key short-term supports at 109.71 (25 Mar trough) and 109.58 (weekly cloud base), with break here expected to trigger further weakness.
Oversold daily studies warn of consolidative/corrective action preceding fresh downside, with extended upticks through daily cloud base (110.31) expected to stall under cloud top (110.78) and provide better positions for re-entering bearish market.
Only return and close above daily cloud would delay bears.
Res: 110.31, 110.61, 110.78, 110.95
Sup: 109.90, 109.71, 109.58, 109.41
USD/CAD Could Edge Higher
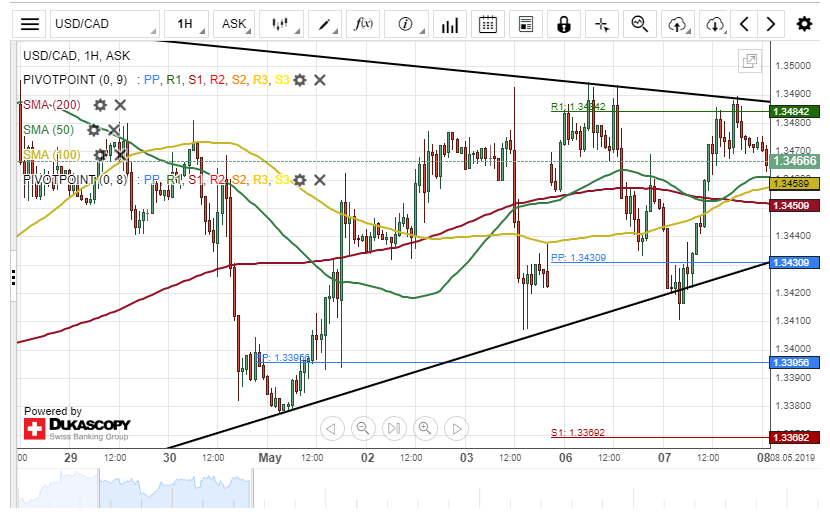
The US Dollar appreciated about 77 base points against the Canadian Dollar on Tuesday. The surge was stopped by a resistance level formed by the weekly pivot point at 1.3484.
Technical indicators demonstrate the USD/CAD currency exchange rate will edge higher during the following trading session. The potential upside target will be near the weekly R1 at 1.3516.
However, trade tension between the United States and Chine could drive investors and traders to take shelter in safe-haven assets during the following days.
NZD/USD Decline After Rate Cuts
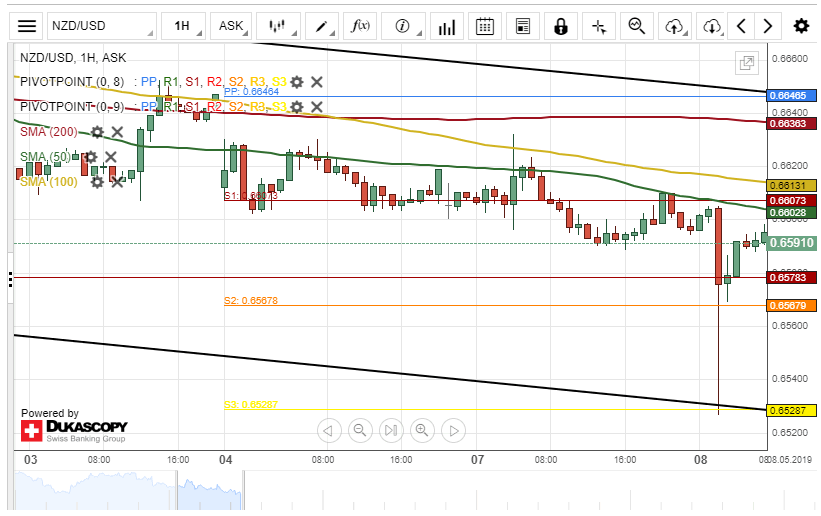
During the past 24 hours, the New Zealand Dollar has depreciated about 103 base points against the US Dollar. The decline was attributed to the New Zealand Central Bank.
The Central Bank of New Zealand cut its interest rate for the first time in two-and-a-half years on Wednesday, sending the New Zeeland Dollar to a six-month low against its US counterpart. However, the Kiwi recovered some of its lost points at the end of the European trading session.
By and large, it is likely that the pair will aim for a resistance level set by the 200-hour SMA at 0.6635 today.
EUR/JPY Meets Weekly Pivot Point
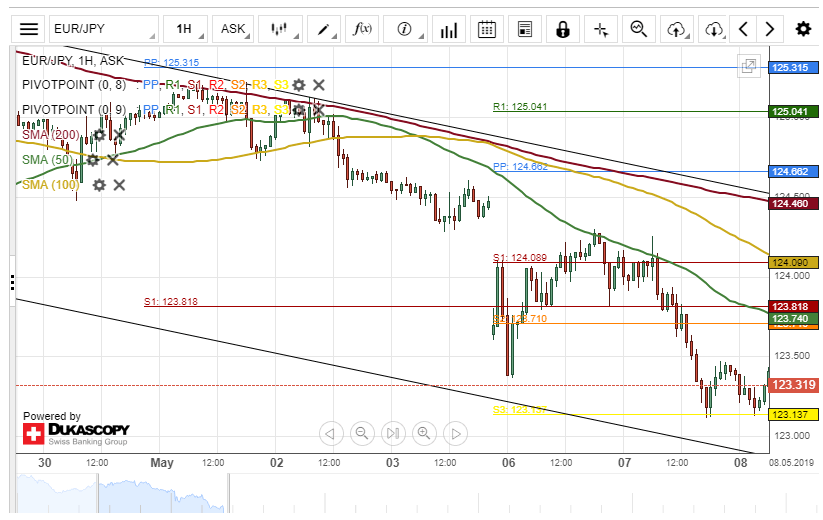
The common European currency depreciated about 110 base points against the Japanese Yen on Tuesday. The currency pair was pressured south by the 50-hour simple moving average.
Currently, the exchange rate is testing a support level formed by the weekly S3 at 123.13. If this support level holds, the currency exchange rate will aim for a resistance cluster at 124.14 within this session.
However, if the EUR/JPY pair passes the support level, a breakout through the lower boundary of a descending channel pattern could be expected today.
AUD/USD Could Edge Lower Today
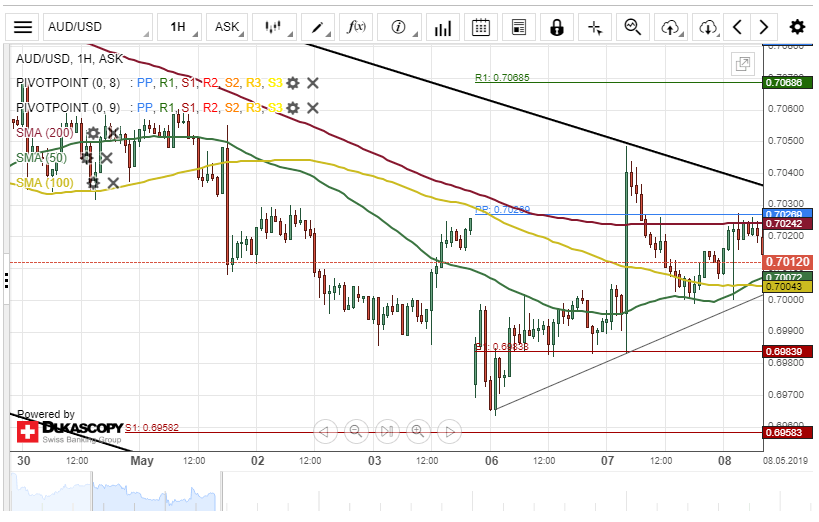
The Australian Dollar made 0.91% gain during the first part of yesterday's trading session. However, by the end of the day, bears have regained some of their lost positions.
The currency pair is currently testing a resistance level formed by the 200-hour simple moving average at 0.7024.
If the pair passes the 200-hour SMA, a surge towards the weekly resistance level at 0.7068 could be expected.
Although, if the 200-hour moving average holds, bears could aim for a swing low of 0.6958 during the following trading session.
NZD/USD Outlook: Kiwi Hit New 2019 Low After RBNZ Rate Cut
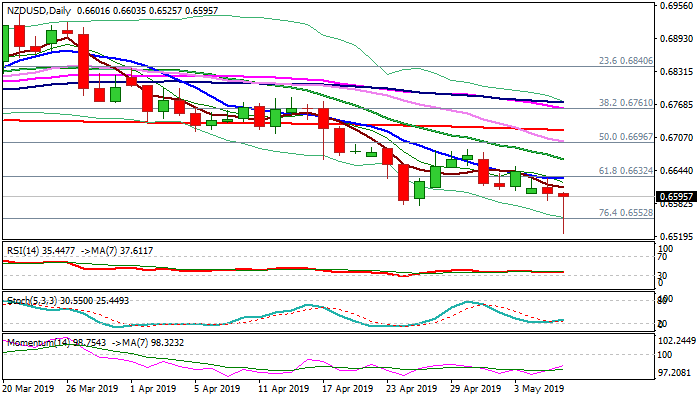
The Kiwi dollar fell to new six-month low at 0.6525 on Wednesday after the New Zealand central bank (RBNZ) cut interest rates by 25 basis points to fresh record low at 1.5% and hinted one more rate cut this year. Spike to new low was followed by quick bounce that sent the price back and above key supports at 0.6580 (lows of 24/25 Apr). North-turning daily momentum and stochastic suggests bears may stay on hold for consolidation, but overall bearish structure favors limited upticks (ideally to be capped by 10SMA at 0.6629), before bears resume, as thick weekly cloud weighs. Bears need close below cracked supports at 0.6580 and 0.6552 (Fibo 76.4% of 0.6424/0.6962) to signal continuation and expose very strong support at 0.6424 (2018 low, posted 8 Oct). Close above 10SMA would delay bears and open way towards pivotal barriers at 0.6665 (falling 20SMA) and 0.6684 (30 Apr lower top). Only firm break here would sideline bears and signal stronger correction.
Res: 0.6612, 0.6629, 0.6665, 0.6684
Sup: 0.6580, 0.6552, 0.6525, 0.6500
NZDUSD Oversold Inside Descending Channel
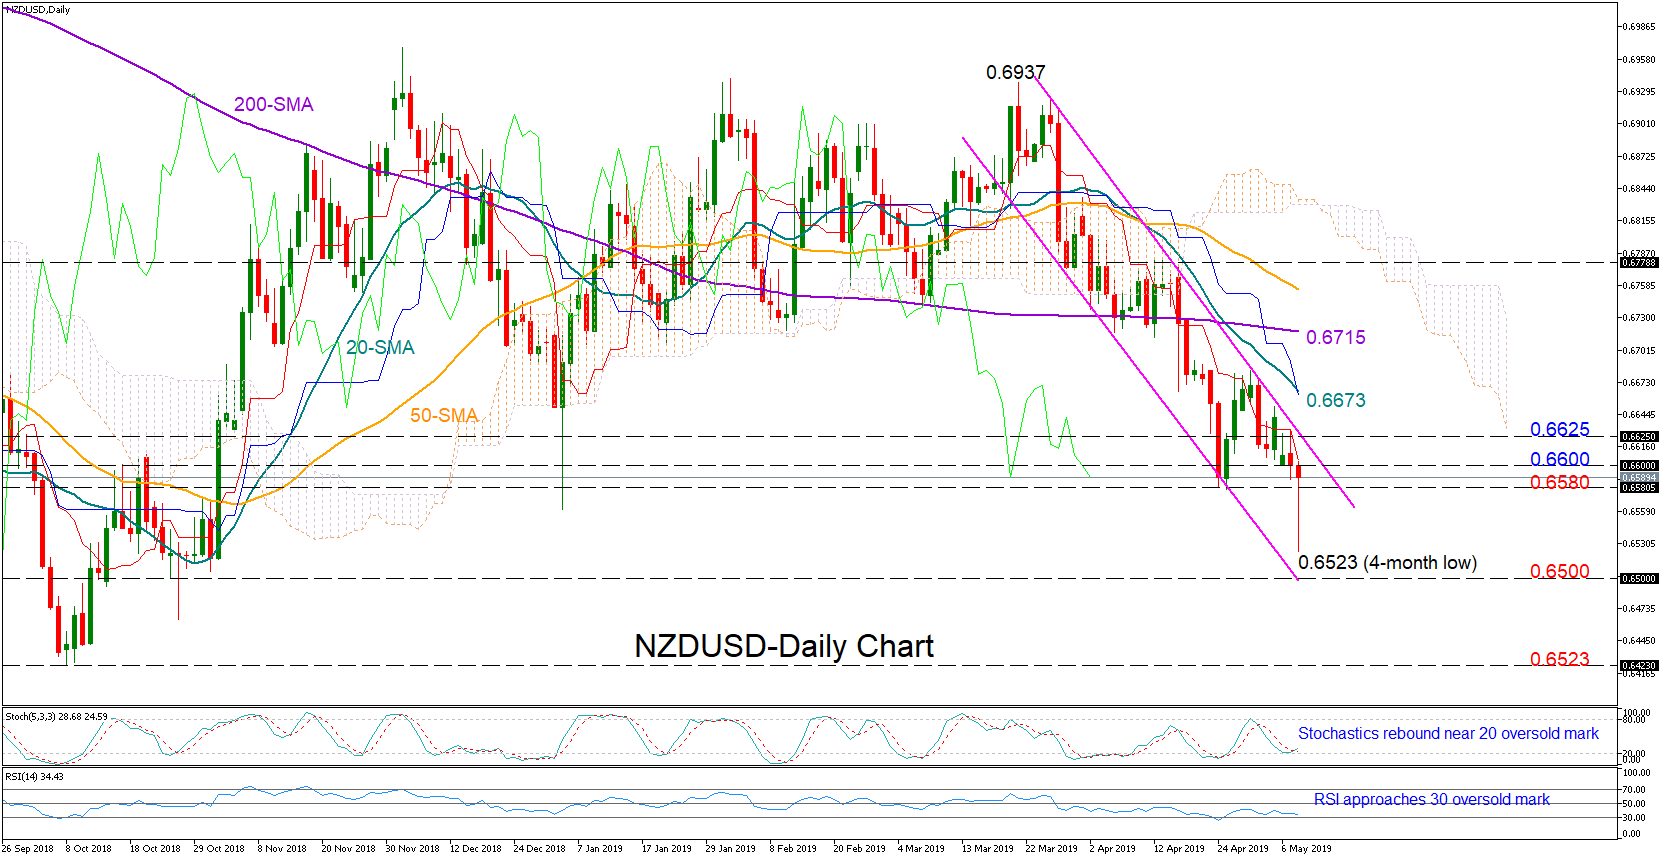
NZDUSD fell aggressively on Wednesday towards a four-month low of 0.6523, but the price recovered most of its lost ground immediately and returned above a key support level of 0.6580. Since both the RSI and the Stochastics are close to oversold levels, the market could keep recouping losses. Yet what remains to be seen is if the bulls have enough fuel to exit the steep descending channel drawn from the March peak.
The red Tenkan-sen line at 0.66 may come first into view on the way up and before all attention turns to the upper boundary of the channel currently seen around 0.6623. Should the price break the channel to the upside, the rally may get further legs, with the spotlight turning next to the 20-day simple moving average (SMA) at 0.6673. A decisive close above the 200-day SMA, however, could be considered a bigger achievement.
Alternatively, the bears may retry to violate support around 0.6580 to drive the price back down to 0.6523. If the attempt proves successful, the next target will be the lower line of the channel around 0.6500, which if beaten too, would open the door for the 0.6423 trough, the lowest level reached since January 2016. Such a move would also turn the medium-term outlook even more bearish.