Sample Category Title
China backtracked on all aspects of trade commitments with US
According to a Reuters report, China has back tracked on nearly all aspects of their commitment in trade negotiation with the US. In each of the seven chapters of the 150-page draft trade deal, China deleted its comments regarding law changes that addresses US complaints. It's seen by the US as undermining the "core architecture" of the trade deal. A private sector source said "China got greedy" and "on a dozen things, if not more." And, China appears to be miscalculating with the US administration even after 20 years dealing with them.
Chinese Vice Premier Liu He will arrive in Washington of Thursday to save the trade agreement. At the same time, new round of tariffs will take effect at 0001 Friday, if no deal is agreed. There's speculation that Liu could agree to scrap the latest proposed text changes and agree to making new laws. But at this point, it's unsure what level of authority and constraints Liu has got from President Xi Jinping Thus, no one knows what results Liu could achieve.
Elliott Wave Analysis: 10 Year US Notes Versus The S&P500, And With It The USD/JPY Pair
If we are correct then 10 year US note will find resistance, and pattern definitely suggests the same as rally from April low is in three waves. Also, notice a breakdown on sp500, but bulls on 10 year did not even blink... so IMO stocks are seeking for a near-term support that will cause strong leg down on 10 year.
10 Year US Notes vs S&P500, 1h
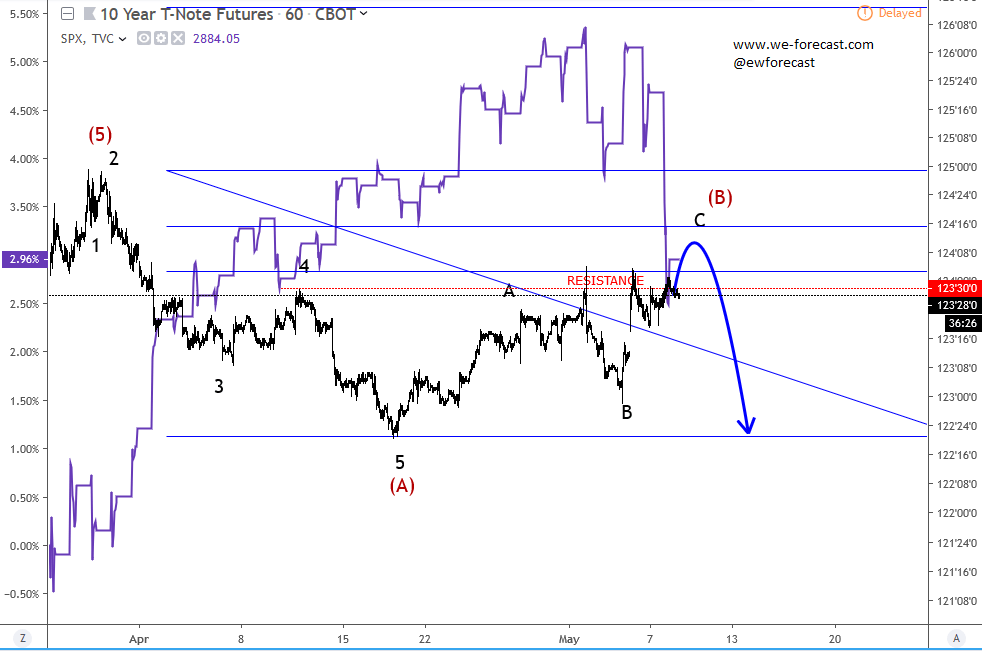
So whenever stocks will find a support, that’s when XXX/JPY pairs may again wake up. But on USDJPY we see an ongoing five wave cycle down in C, so for now bears appear incomplete, but it will be interesting to watch the same pair after wave five.
USDJPY, 1h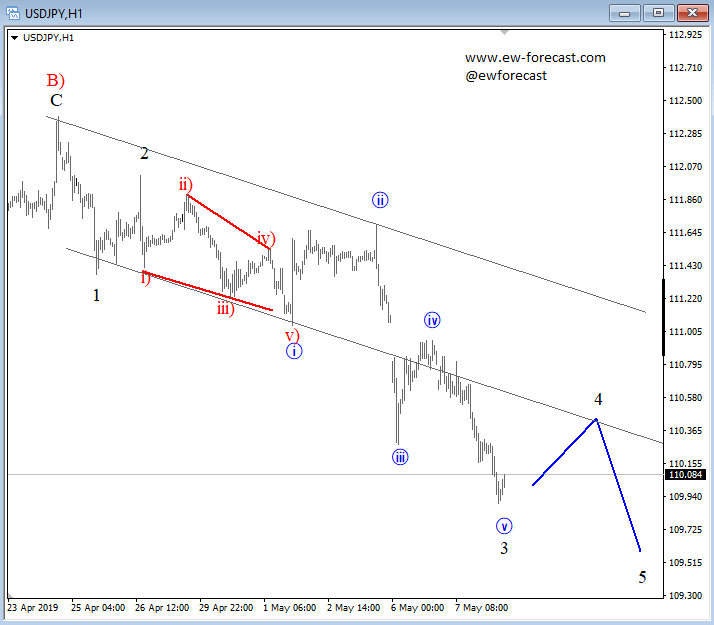
Focus Remains On Upcoming US-China Trade Talks In Washington
Notes/Observations
- Trade tension continue to simmer; Thursday/Friday talks in Washington of critical importance and likely dictate whether the threat of tariffs was real or just hard ball negotiating tactics
Asia:
- China Apr Trade Balance: $13.8B v $34.6Be; Exports Y/Y: -2.7% v +3.0%e; Imports Y/Y: +4.0% v -2.5%e v -7.6% prior
- New Zealand Central Bank (RBNZ) cut Official Cash Rate (OCR) by 25bps to 1.50% (as expected) to resume its easing mode (last cut was back in Nov 2016); lowered rate path outlook
- RBNZ Gov Orr post rate decision press conference noted that was iIn good position to be able observe data as it unfolded. Noted of large uncertainties around OCR track
- BOJ March Minutes (two meetings ago): Most member agreed that would take time to hit 2% price target, appropriate to persist with monetary easing
Europe/Mideast:
- PM May met 1922 Chair Sir Graham Brady on Tuesday, May 7th amid pressure for her to announce a firm departure date
- PM May said to stay in office until the Tory party conference in Sept after setting a summer deadline to finish Brexit talks
- Local Tory associations confirmed to hold of vote of confidence in the PM on June 15th (non-binding)
Energy:
- Weekly API Oil Inventories: Crude: +2.8M v +6.8M prior
SPEAKERS/FIXED INCOME/FX/COMMODITIES/ERRATUM
Equities
- Indices [Stoxx600 -0.03% at 381.52, FTSE -0.22% at 7,244.68, DAX +0.26% at 12,124.62, CAC-40 +0.09% at 5,400.50, IBEX-35 -0.17% at 9,218.95, FTSE MIB -0.28% at 21,160.50, SMI -0.06% at 9,571.50, S&P 500 Futures -0.07%]
- Market Focal Points/Key Themes: European Indices trade mostly higher rebounding from the sharp losses seen yesterday despite a weaker close on Wallstreet overnight and weaker Asian Indices. US Index futures trade flat as trade tensions continue to be at the forefront. On the corporate front shares of Siemens outperform trading over 4.5% higher helping the Dax outperform, as the company reported strong earnings and announced the confirmed carve out of its Gas & Power unit. German traded Wirecard rises sharply following strong earnings and raised outlook, while Shaeffler, ISS, Amadeus, Travis Perkins and Ratos among others rising on earnings. Meanwhile Imperial Brands declines after in line results, with Munich Re also declining, along with Commerzbank and Ahold Delhaize following earnings. In the US shares of Electronic Aets gained after earnings, with Match Group, Qorvo and Paysign some of the notable gainers in the permarket, with Inogen, ADT, TripAdvisor, Sprint and Western Union declining. Looking ahead notable earners include Bunge, Thomson Reuters, Mckessen and Coty among many others.
Equities
- Consumer discretionary: Ahold Delhaize [AD.NL] -1% (earnings), Travis Perkins [TPK.UK] -3% (trading update), ITV [ITV.UK] -2.5% (trading update), Wolters Kluwer [WKL.NL] +1.5% (trading update)
- Consumer staples: Imperial Brands [IMB.UK] -3.5% (earnings)
- Financials: Commerzbank [CBK.DE] +1% (earnings), Munich Re [MUV2.DE] -2% (earnings), Ratos [RATOB.SE] +15% (earnings)
- Healthcare: ReNeuron Group [RENE.UK] -9% (business update)
- Industrials: Siemens [SIE.DE] +5.5% (earnings), Schaeffler [SHA.DE] +5% (earnings), Bilfinger [GBF.DE] -1.5% (earnings)
- Technology: Wirecard [WDI.DE] +5% (earnings; raises outlook)
- Materials: Bekaert [BEKB.BE] +2.5% (earnings)
Speakers
- BOE's Ramsden: Most of the Brexit risks were mitigated but some did remain
- Italy could face €35B budget deficit in 2020 based on EU figures
- Thailand Central Bank policy statement noted that the decision was unanimous to keep policy steady and reiterated stance that monetary policy remained accommodative. Economy seen growing less than previously forecasted (**Note: saw 3.8% growth in March) and saw inflation close to the low end of target range. Reiterated that THB currency (Baht) moves were in-line with regional peers and likely to remain volatile. Risks to financial stability remained
- Philippines Central Bank (BSP) Dep Gov Guinigundo: Reiterates stance that RRR cut is a live issue
- Iran submitted a letter to the ambassadors of nations that are party to the nuclear deal, notifying them of a scale back of its commitments
- Iran President Rouhani stated that the country would not withdraw from nuclear deal but would scale back commitments. To give remaining signatories of nuclear deal to implement promises in oil and banking sectors. Collapse of nuclear deal was dangerous for both Iran and the world
Currencies/Fixed Income
- Focus remained on the upcoming g trade talks in Washington between US-China. Fresh uncertainty about a trade deal had surfaced in recent sessions. The Thursday/Friday talks in Washington now of critical importance and likely dictate whether the threat of tariffs was real or just hard ball negotiating tactics
- EUR/USD steady around the 1.12 level but dealers saw headwinds for the currency. Overall the recent EU Commission downgrade of growth for the region to reinforce the view that ECB will keep rates lower for longer
- ZAR currency (Rand) was firmer as South Africa's Ramaphosa's ANC party was expected to win in today's general elections and keep the path on necessary reforms.
Economic Data
- (CH) Swiss Apr Unemployment Rate: 2.4% v 2.4%e; Unemployment Rate (Seasonally Adj): 2.4% v 2.4%e
- (DE) Germany Mar Industrial Production M/M: +0.5% v -0.5%e; Y/Y: -0.9% v -2.6%e
- (NO) Norway Mar Industrial Production M/M: -1.4% v -1.8% prior; Y/Y: -6.5% v -5.7% prior
- (NO) Norway Mar Manufacturing Production M/M: -0.8% v +0.3%e; Y/Y: 1.4% v 3.1% prior
- (NO) Norway Q1 Average Monthly Earnings Y/Y: 3.2% v 2.8% prior
- (FI) Finland Mar Preliminary Trade Balance: -€0.1B v -€0.1B prior
- (HU) Hungary Mar Industrial Production M/M: 1.0% v 1.0% prior; Y/Y: 8.0% v 6.0%e
- (TH) Thailand Central Bank (BoT) left the Benchmark Interest Rate unchanged at 1.75% (as expected)
- (UK) Apr Halifax House Prices M/M: 1.1% v 0.1%e; 3M/Y: 5.0% v 4.5%e
- (SE) Sweden Apr Budget Balance (SEK): -2.6B v +12.0B prior
- (RU) Russia Narrow Money Supply Narrow w/e May 1st (RUB): 10.28T v 10.30T prior
Fixed Income Issuance
- (IN) India sold total INR200B vs. INR200B indicated in 3-month, 6-month and 12-month bills
- (SE) Sweden sold SEK1.5 vs. SEK1.5B indicated in 0.75% 2029 bonds; Avg Yield: 0.2520% v 0.3975% prior; Bid-to-cover: 2.80x v 4.48x prior
Looking Ahead
- (RU) Russia Feb Sovereign Wealth Funds: Wellbeing Fund: No est v $59.1B prior
- (UR Ukraine Apr CPI M/M: 0.5%e v 0.9% prior; Y/Y: 8.4%e v 8.6% prior
- (IT) Bank of Italy Balance-Sheet Aggregates
- (ZA) South Africa elections
- 05:30 (UK) Weekly John Lewis Partnership LFL sales w/e May 4th:
- 05:30 (DE) Germany to sell €3.0B in 0% Apr 2024 BOBL
- 05:30 (PT) Portugal Debt Agency (IGCP) to sell €1.0-1.25B in 2029 and 2034 bonds
- 05:30 (VN) Vietnam to sell VND2.5T in 5-year, 7-year, 10-year and 20-year bonds
- 05:30 (ZA) South Africa announces details of next bond auction (held on Tuesdays)
- 06:00 (PT) Portugal Q1 Unemployment Rate: No est v 6.7% prior
- 06:00 (RO) Romania to sell Bonds
- 06:45 (US) Daily Libor Fixing
- 07:00 (US) MBA Mortgage Applications w/e May 3rd: No est v -4.3% prior
- 07:00 (BR) Brazil Apr FGV Inflation IGP-DI M/M: 0.8%e v 1.1% prior; Y/Y: 8.2%e v 8.3% prior
- 08:00 (CL) Chile Apr CPI M/M: 0.3%e v 0.5% prior; Y/Y: 2.1%e v 2.0% prior
- 08:00 (UK) Baltic Bulk Index
- 08:15 (CA) Canada Apr Annualized Housing Starts: 195.0Ke v 192.5K prior
- 08:30 (US) Fed's Brainard (voter, dove)
- 08:40 (SE) Sweden Central Bank (Riksbank) af Jochnick Speech
- 10:30 (US) Weekly DOE Crude Oil Inventories
- 10:30 (TR) Turkey Apr Cash Budget Balance (TRY): No est v -15.0B prior
- 12:00 (CA) Canada to sell 5 Year Bonds
- 13:00 (US) Treasury to sell 10-Year Notes
- 16:00 (NZ) New Zealand Central Bank (RBNZ) Gov Orr in Parliament
- 17:00 (BR) Brazil Central Bank (BCB) Interest Rate decision: expected to leave Selic Target Rate unchanged at 6.50%
The Analytical Overview Of The Main Currency Pairs
The EUR/USD currency pair
Technical indicators of the currency pair:
Prev Open: 1.11982
Open: 1.11897
% chg. over the last day: -0.09
Day's range: 1.11877 – 1.12128
52 wk range: 1.1111 – 1.2009
EUR/USD retains an ambiguous technical picture. The financial market participants are waiting for additional drivers. The EU commission has decreased the expectations for the EU growth for 2019-2020. The trading conflict between the US and China remains in the spotlight. Chinese Vice-Premier Liu He will go to the United States on Thursday to continue trade negotiations. Right now the local support and resistance levels are 1.11900-1.12200. Open positions from these levels.
At 14:30 (GMT+3:00) the investors will evaluate the latest ECB meeting on monetary policy.
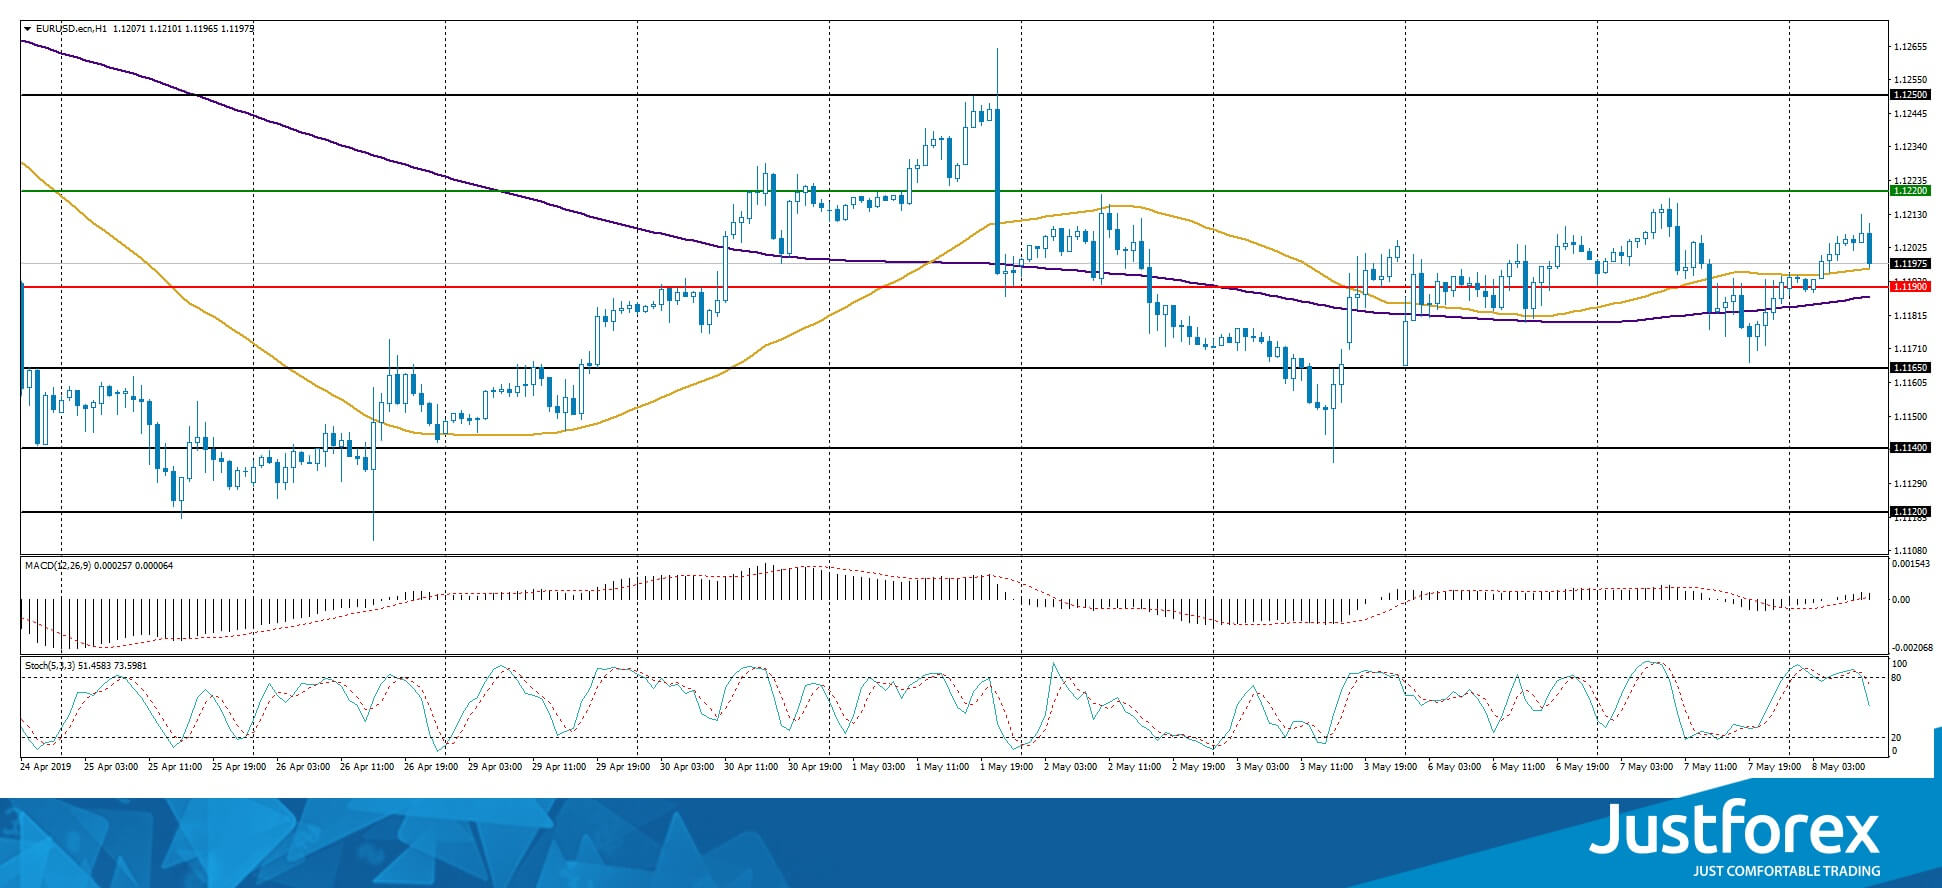
The indicators do not provide precise singals, 50 MA started to cross 200 MA.
The MACD histogram is in the positive zone but started to fall, which gives a weak signal to buy EUR/USD.
The Stochastic Oscillator started to leave the overbought zone, the %K line is below the %D line which points to a bearish mood.
Trading recommendations
Support levels: 1.11900, 1.11650, 1.11400
Resistance levels: 1.12200, 1.12500
If the price fixes above 1.12200, expect further growth toward 1.12500-1.12700.
Alternatively, the quotes can descend toward 1.11650-1.11500.
The GBP/USD currency pair
Technical indicators of the currency pair:
Prev Open: 1.30954
Open: 1.30645
% chg. over the last day: -0.23
Day's range: 1.30386 – 1.30803
52 wk range: 1.2438 – 1.3631
The GBP/USD currency pair started to descend. The trading instrument has updated the local minimums. The GBP is under pressure due to the Brexit ambiguousness. The British press obtained information that the Parliament will pursue Theresa May's resignation this week, should she accept a deal with the oppositions. Right now GBP/USD quotes are consolidating around 1.30400-1.30800. GBP can descend further, you should open positions from the key levels.
The Economic News Feed for 08.05.2019 is calm.
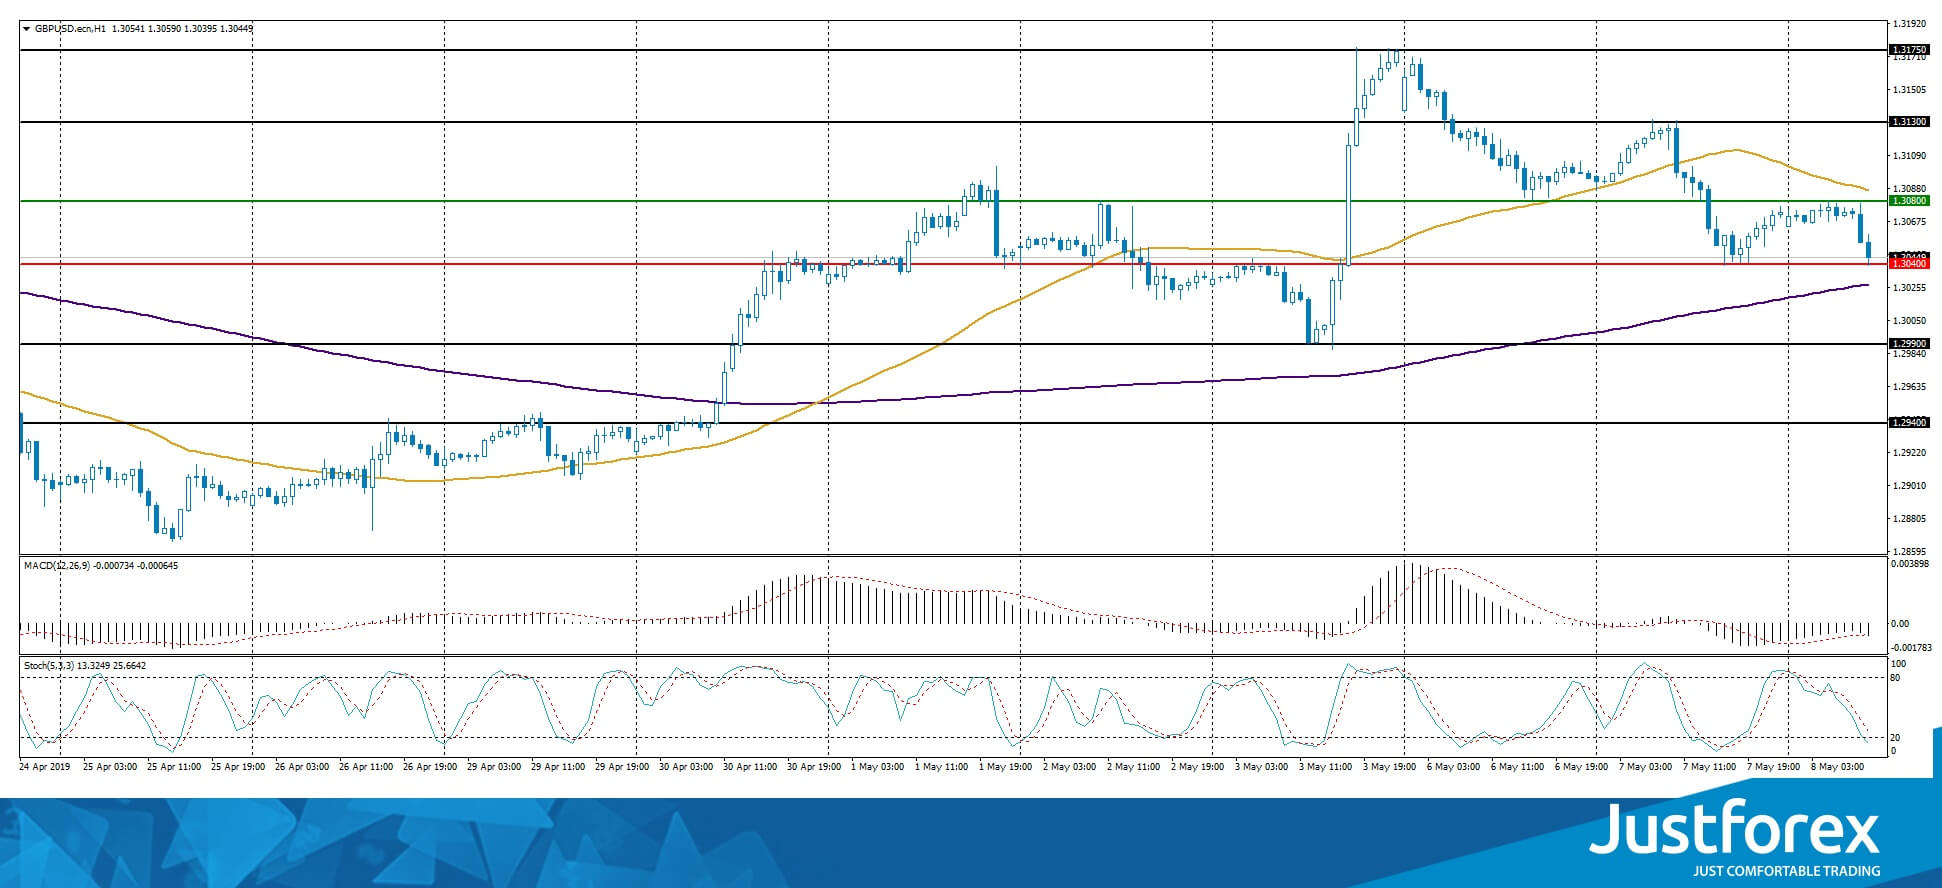
The indicators do not provide precise signals: the price fixed between 50 MA and 200 MA.
The MACD histogram is in the negative zone and keeps falling which gives a strong signal to sell GBP/USD.
The Stochastic Oscillator is in the neutral zone, the %K line is below the %D line which points toward a bearish mood.
Trading recommendations
Support levels: 1.30400, 1.29900, 1.29400
Resistance levels: 1.30800, 1.31300, 1.31750
If the price fixes below 1.30400, expect further descend toward 1.30000.
Alternatively, the qutoes can recover toward 1.31200-1.31500.
The USD/CAD currency pair
Technical indicators of the currency pair:
Prev Open: 1.34436
Open: 1.34646
% chg. over the last day: +0.16
Day's range: 1.34538 – 1.34746
52 wk range: 1.2727 – 1.3664
Since the beginning of the year, USD/CAD has been in a very active trading. There are no defined trends. The local support and resistance levels are 1.34500-1.34750. The USD/CAD quotes started to descend. Keep an eye on the oil quotes dynamics and open positions from the key levels.
The Economic News Feed for 08.05.2019 is calm.
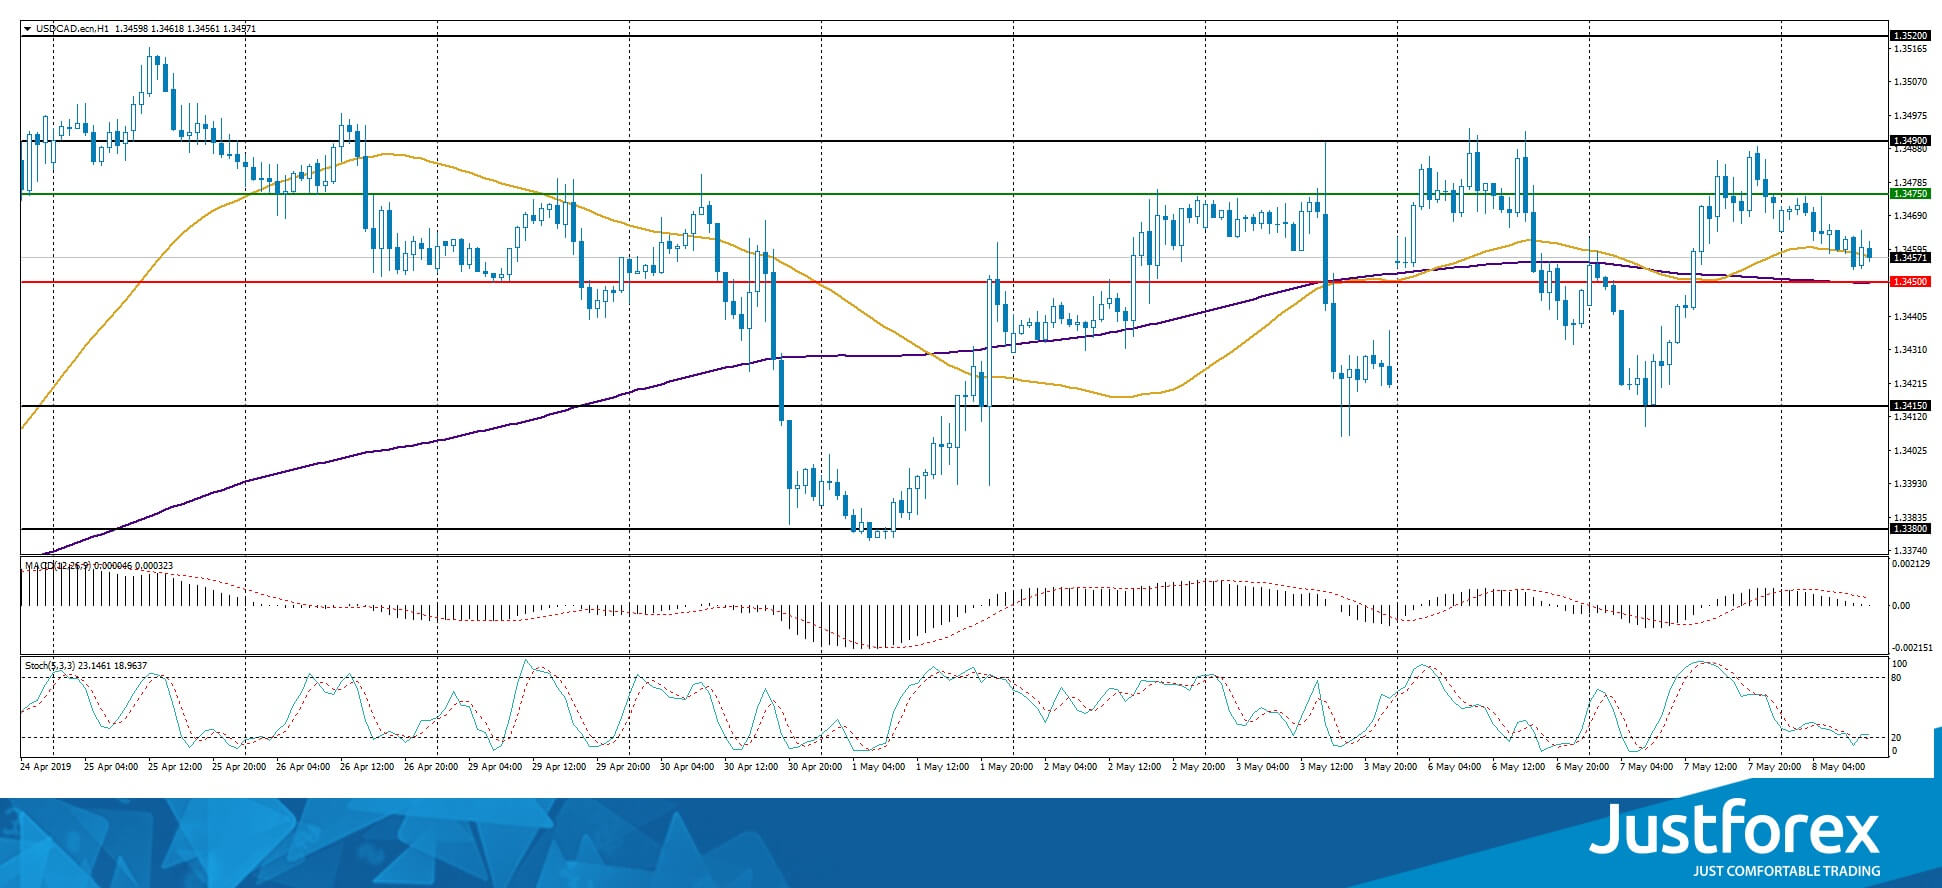
The indicators do not provide precise signals, the price has crossed 50 MA and 200 MA.
The MACD histogram is close to 0.
The Stochastic Oscillator is near the oversold zone, the %K line has crossed the %D line. There are no signals at the moment.
Trading recommendations
Support levels: 1.34500, 1.34150, 1.33800
Resistance levels: 1.34750, 1.34900, 1.35200
If the price fixes below 1.34500, consider selling USD/CAD. The movement will tend toward 1.34200-1.34000
Alternatively, the qutoes can grow toward 1.35000.
The USD/JPY currency pair
Technical indicators of the currency pair:
Prev Open: 110.713
Open: 110.228
% chg. over the last day: -0.46
Day's range: 109.905 – 110.293
52 wk range: 104.97 – 114.56
USD/JPY is in the bearish mood. The trading instrument has updated the local minimums. The demand for safe assets remains high due the US/China trading conflict. Right now the quotes are consolidating between 109.900 and 110.300. The trading instrument can grow further. You should open positions from the key levels.
The Economic News Feed for 08.05.2019 is calm.
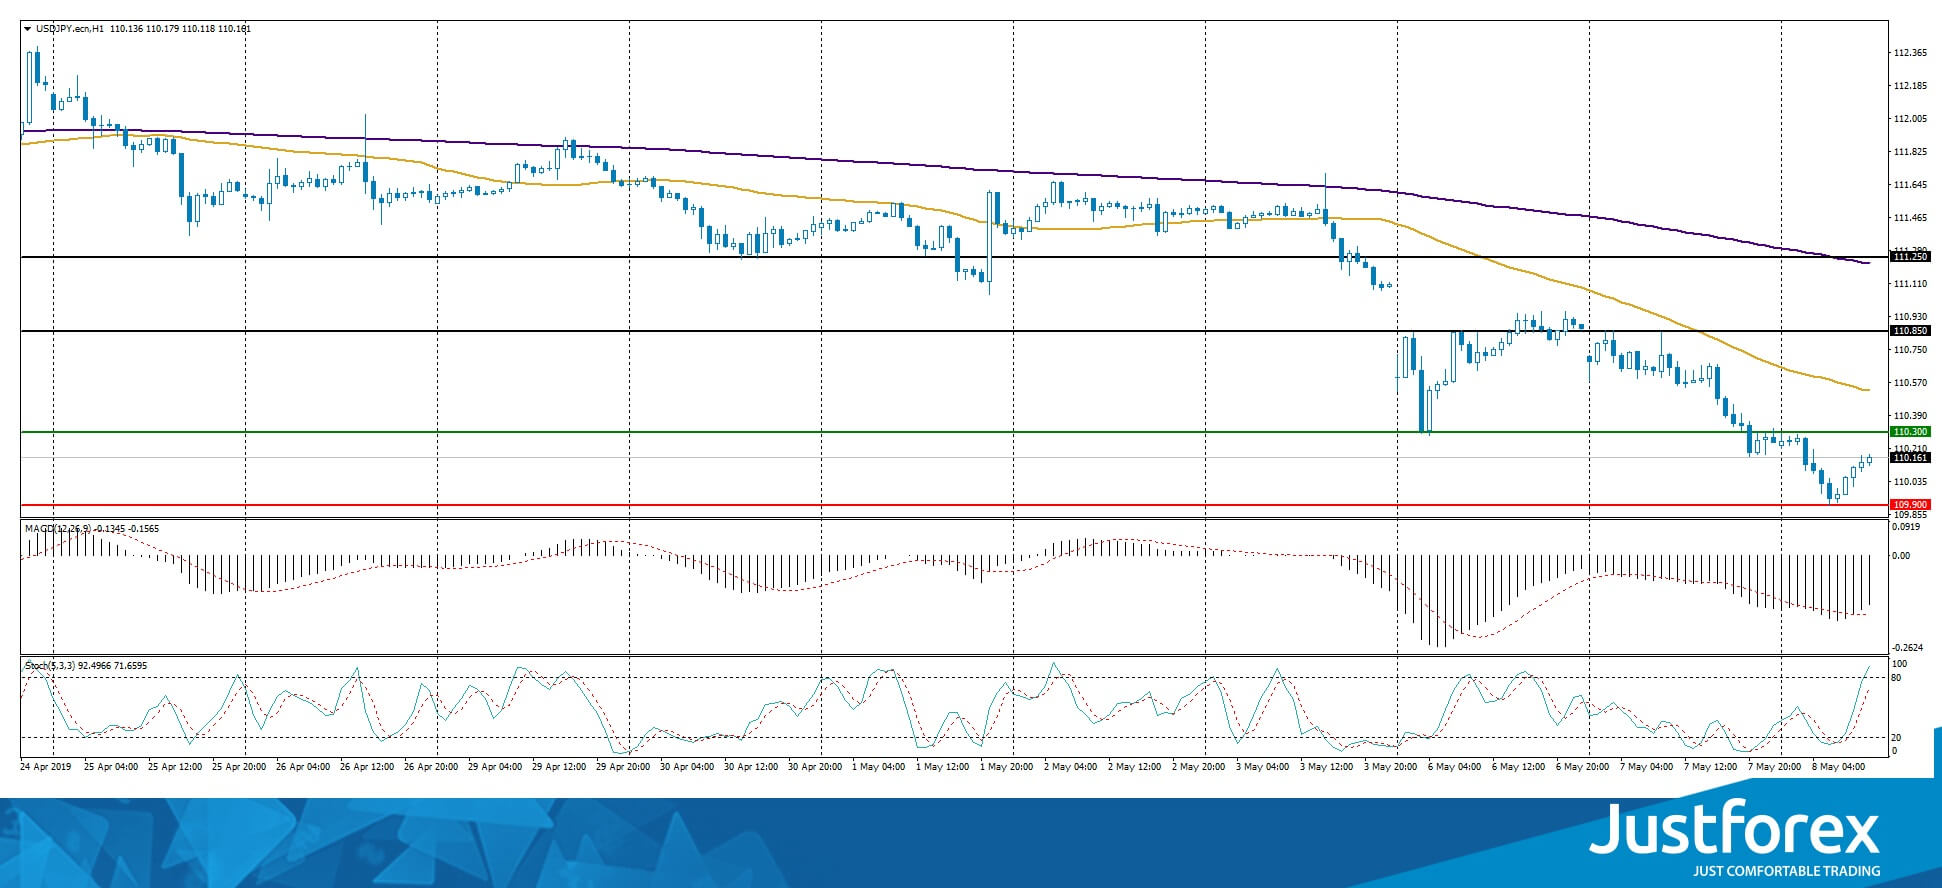
The price fixed below 50 MA and 200 MA which points toward the power of the buyers.
The MACD histogram is in the negative zone but above the signal line which gives a weak signal to sell USD/JPY.
The Stochastic Oscillator is in the neutral zone, the %K line is above the %D line which points toward a bullish mood.
Trading recommendations
Support levels: 109.900, 109.500
Resistance levels: 110.300, 110.850, 111.250
If the price fixes below the 109.900, expect the quotes to fall toward 109.500-109.300.
Alternatively, the quotes can recover toward 110.700-111.000.
What are the Best Market Entry Strategies When Trading Forex?
One of the most important aspects of Forex trading is choosing the right entry point, the most successful moments in which it is profitable to open a deal.
There are several methods for determining entry points: chart patterns, Japanese candlestick patterns, technical indicators, etc. Let’s look at how to determine Forex entry points accurately.
Trend
In general, a trend is a directional movement of prices during a certain time. However, prices don’t move in one direction only. After growth, there is always a temporary recession, which again turns into higher growth. As a result, prices move zigzag. The peaks of these up-and-down movements form local highs and lows.
There are bullish and bearish trends. The bullish trend is ascending. To determine the direction of a trend, a trader draws a line through the lows. It is assumed that the price will move up the same oscillatory movements. If there is an uptrend in the currency market, you should open a position to buy.
One of the methods based on the trend is to track the movement on different timeframes. A higher timeframe indicates the direction of the price. Then you should explore lower timeframes. If the directions of the higher and lower timeframes coincide, the entry point will be at the beginning of their joint movement.
Price channels
The price always moves in a curve. If the range of fluctuations is wide, so-called price channels with support and resistance levels are formed. The optimal Forex entry points are places at these levels. The trader buys at the support level and sells at the resistance level.
You can open a position after the breakdown of an important level.
Reversal
A good way to enter the market at the time of the trend reversal. In the case of a successful opening of the transaction, we will find ourselves at the beginning of the emerging trend, having received the maximum profit due to the large amplitude of the price movement. Trend reversals are determined both visually and with the help of indicators. There are also situations when a reversal occurs suddenly due to various fundamental aspects. The most common reversal formations are Head and Shoulders; Double/Triple Top/Bottom; Wedge; Divergence.
News and events
Some traders work using the news feed. Forex is very sensitive to economic and political news. During their release, the price makes sharp movements. Economic news is the basis of fundamental analysis. You can independently make analysis, but you can also use the analytics of brokers. For example, JustForex publishes daily market overview with a news feed for a day.
When the chart sharply responds to certain information, the trader opens a position in accordance with the trend. But this approach requires experience. Not always the price behaves exactly as traders expected. News trading is not recommended for beginners, as it is hard to determine the future perspective based on fundamental analysis.
Technical indicators
You can receive reliable signals using the instruments of your trading terminal. Some of the indicators are built-in, but you can also download custom indicators. Here are some of them:
- Moving Averages. Displays sharp changes in the movements of the foreign exchange market. MA is a curve line, which varies depending on the direction of the trend. If the price is below the moving average, the trend is downward, if above - upward. If the price has crossed the curve, it indicates a possible reversal of the trend.
- Determines the level of overbought and oversold. The indicator consists of two lines: fast %K and slow %D. Values range from 0 to 100 percent. By default, the levels of 80 and 20 are set in MetaTrader 4. Oversold is indicated when the line falls below 20. Then traders consider purchases. If the line is above 80, the market is in the overbought zone and it is recommended to consider selling.
- Bollinger Bands. The indicator is represented by three moving averages. The middle line is the moving average, the lower and the upper are the levels at which the price is considered low or high compared to the moving average. You can determine the direction of the trend. For example, the price has broken through the border and entered the oversold zone. The indicator assumes the placement of the buy order.
Experienced traders never enter the market just because the price is actively moving. The main rule of effective trading is to enter only at certain points. Do some practice on Demo account first, it’s free of charge when entering your e-mail address.
The US Dollar Is Condolidating. Trade Talks Between Washington And Beijing Are Still In The Spotlight
The US dollar did not changed a lot against the basket of major currencies during yesterday's trading. The dollar index (#DX) closed with a slight increase (+0.02%). Due to the escalation of the trade conflict between the US and China, the demand for safe assets has increased. Therefore, the Japanese yen has reached six-week highs against the US currency. On Thursday-Friday, talks will be held in Washington, during which Vice Premier Liu He will try to save the agreement.
The euro was under pressure after the European Commission lowered the growth rates of the Eurozone economy for the current and next years. The EC has worsened its estimate for the Eurozone's GDP growth for 2019 to 1.2% from the expected 1.3% in February. The growth forecast for the region's economy in 2020 has been lowered to 1.5% from 1.6%.
The UK will take part in the elections to the European Parliament, as it hasn't exit the EU. Elections will be held on May 23. At the same time, the Conservative Party is dissatisfied with the negotiations with the Labour Party. Negotiations between the two parties have been going on for several weeks, so far neither side has taken and has not supported any decisions on Brexit. Members of the Conservative Party, who stand for Brexit, are ready to consider the urgent resignation of T. May.
Today, during the Asian trading session, the RBNZ has decided on the interest rate. As expected, the regulator lowered the key interest rate by 25 basis points to 1.50%. The Central Bank does not exclude a further reduction in interest rates in the future.
The "black gold" prices have recovered most of the losses after a decline the previous day. At the moment, futures for the WTI crude oil are testing the mark of $61.80 per barrel. At 17:30 (GMT+3:00), a report on crude oil inventories will be published in the US.
Market Indicators
- Yesterday, the aggressive sales were observed in the US stock market: #SPY (-1.67%), #DIA (-1.80%), #QQQ (-1.95%).
- The 10-year US government bonds yield is declining. At the moment, the indicator is at the level of 2.46-2.47%.
The news feed on 2019.05.08:
- Publication of the ECB account monetary policy meeting at 14:30 (GMT+3:00).
US Inflation To Inch Higher In April But Spotlight On Trade Talks
The United States will report producer and consumer price data this week, but with neither indicator expected to alter the inflation outlook, the data will probably play second fiddle to trade headlines when it comes to the US dollar. The producer price index (PPI) is out on Thursday at 12:30 GMT, while the consumer price index (CPI) will be released on Friday, also at 12:30 GMT.
CPI and PPI to edge higher
Both headline and core CPI turned higher in March, having hit more than two-year lows in February. The rebound is expected to have continued in April, with the annual rate of CPI forecast to rise from 1.9% to 2.1% and core CPI anticipated to nudge up 0.1 percentage points to 2.1%.
Producer prices are also projected to rise slightly. PPI for final demand and PPI excluding food and energy are forecast to edge up by 0.1 percentage points each to 2.3% and 2.5% year-on-year, respectively.
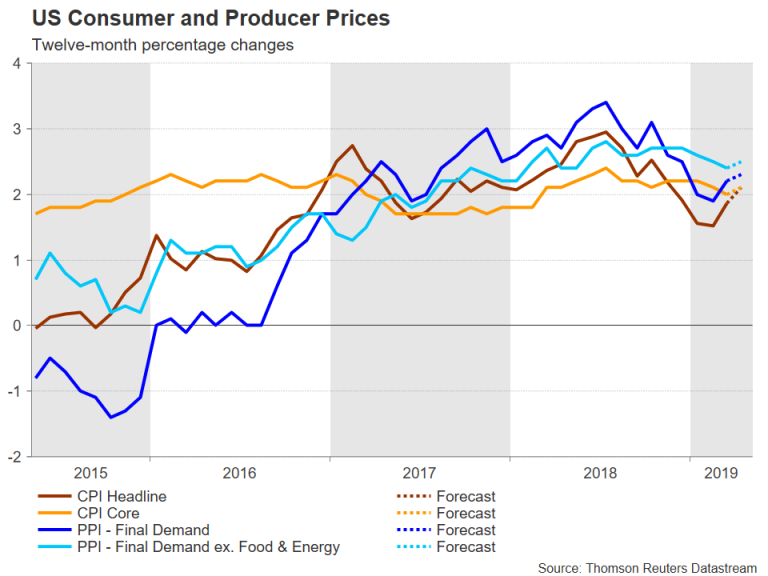
If the upward trend is confirmed, it would suggest the Fed’s preferred price barometer, the core PCE price index, would soon follow suit.
Fed sees weak inflation as temporary
Fed policymakers, including Chairman Jerome Powell, have signalled they expect the current weakness in inflation to be transitory. Stronger inflation numbers on Friday would therefore add support to this view, possibly further dashing expectations of a rate cut over the next 12 months.
A pick-up in growth in the first quarter and an ever-tightening labour market have also helped restore the bullish outlook for the US economy, and in turn, for the greenback.
Trump raises trade stakes with China
However, with trade tensions flaring up again, it may be too soon to assume that the downside risks have receded substantially, especially as much of the improvement in risk sentiment seen this year was driven on the back of easing trade frictions. President Trump raised the stakes in the trade talks with China on Sunday when he unexpectedly announced that tariffs on $200 billion worth of Chinese imports would increase from 10% to 25% as early as this Friday.
But there is still some hope that a further flare up can be averted as China’s most senior negotiator, Vice Premier Liu He, will travel to Washington on Thursday for two days of talks. If the two sides fail to resolve the key sticking points, the most likely outcome is that the US will go ahead with its planned tariff hikes this week and threaten to impose levies on all remaining imports from China.
Yen has most to gain from trade stand-off
Markets have yet to fully process the potential impact from a possible complete breakdown in the trade negotiations, especially at a time when the US is expanding its fight to Japan and the European Union as well. While equity markets have taken a significant beating, the reaction in forex markets has so far been somewhat more muted, with the yen perhaps being the exception.
The safe-haven Japanese currency has appreciated notably since Trump’s fresh threats, while the dollar has not enjoyed the same level of boost as it did when trade tensions first started to surface in 2018. Dollar/yen touched its lowest level in six weeks on Wednesday and is fast approaching the 38.2% Fibonacci retracement of the upleg from 104.96 to 112.39, which is around 109.55.
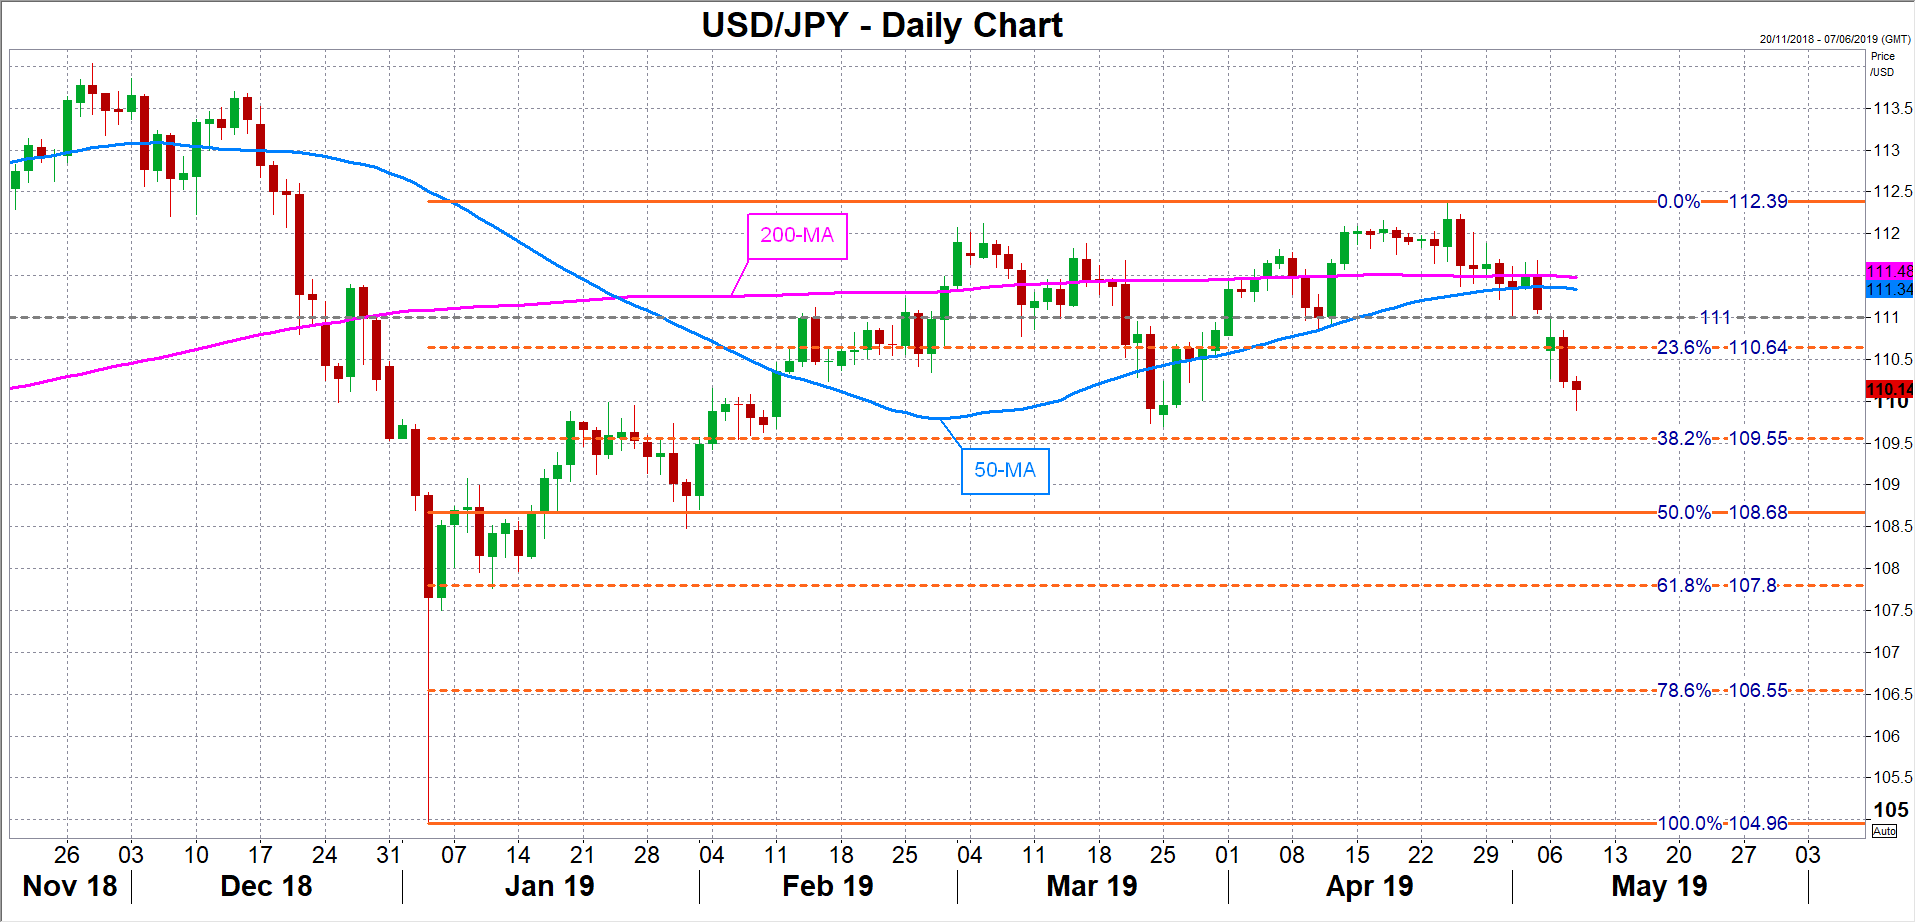
Further setbacks in talks this week could push the pair below this key support, opening the way towards the 50% Fibonacci at 108.68. Stronger-than-expected inflation readings would likely provide modest support at best in a risk-off environment, while only concrete progress in the trade discussions would likely enable dollar/yen to reclaim the 111 handle.
EURJPY Rises After Touching 4-Month Trough, Negative Bias Holds
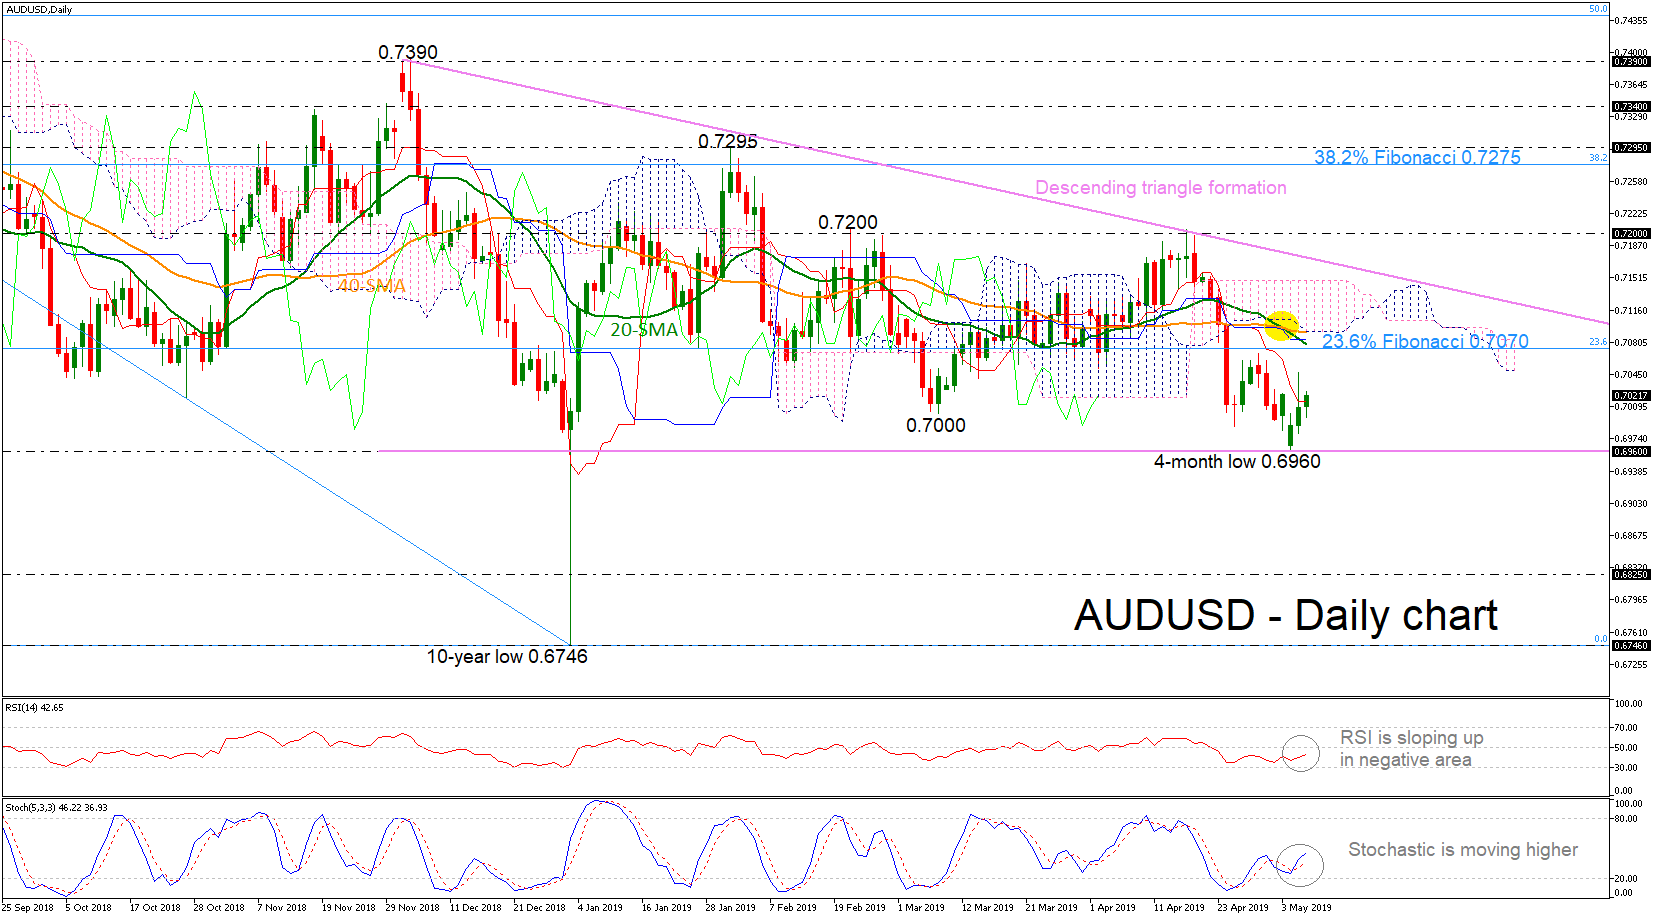
EURJPY has tumbled towards a fresh four-month low of 123.10 this week as the price started a bearish rally from the 126.80 resistance level. The technical picture supports that the bearish view is likely to continue in the short-term. The MACD is stretching to the downside below its trigger line and the stochastic oscillator is hovering in the oversold zone in the 4-hour chart.
In case of more negative pressures, the market could meet support at the 123.10 level while a successful close below this level could see a retest of the 122.80 trough, reached on January 4.
On the flipside, a move to the upside could find resistance at the 20-simple moving average (SMA) in the near term currently at 123.90 ahead of the 23.6% Fibonacci retracement level of the downleg from 126.80 to 123.10, near 123.96. Only a jump above the downtrend line around 124.30 could shift the bias from bearish to bullish.
In brief, EURJPY has been in a downward movement over the last three weeks and bears should be waiting for a decline below the 4-month bottom for further selling interest.
GBPUSD Targeting 1.3030
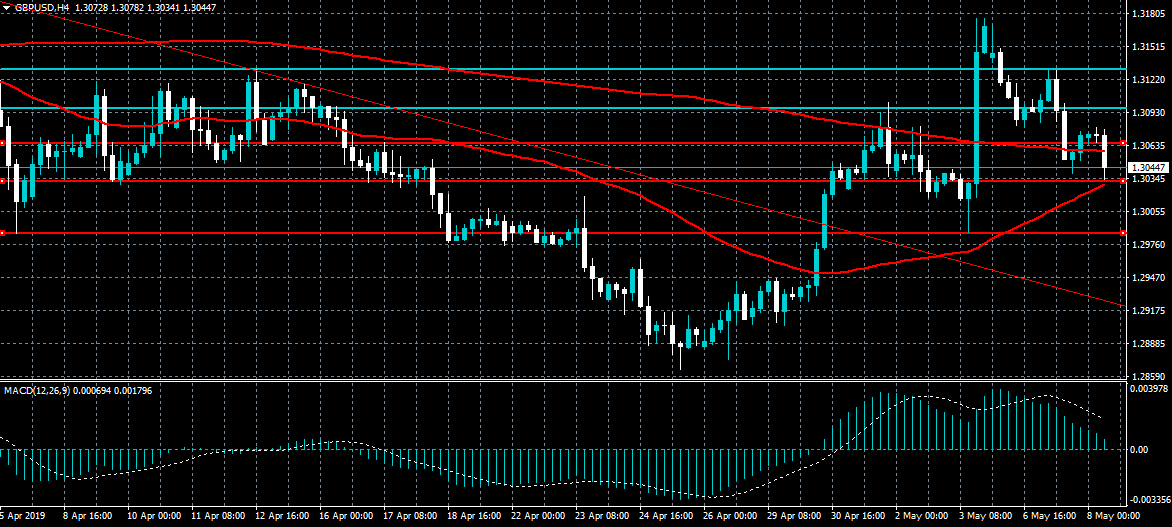
The British pound has fallen to a fresh weekly trading low against the US dollar after bulls failed to stabilize the pair above the 1.3064 resistance level. GBPUSD sellers may soon start to target towards the 1.2990 level if the 1.3030 support level is broken. Technicals indicators across the four-hour time frame are still turning lower as intraday downside pressures increase.
The GBPUSD pair is heavily bearish while trading below the 1.3064 level, key support is found at the 1.3030 and 1.2990 levels.
If the GBPUSD pair trades above the 1.3064 level, key intraday resistance is found at the 1.3100 and 1.3135 levels.
EURUSD Holding 1.1190
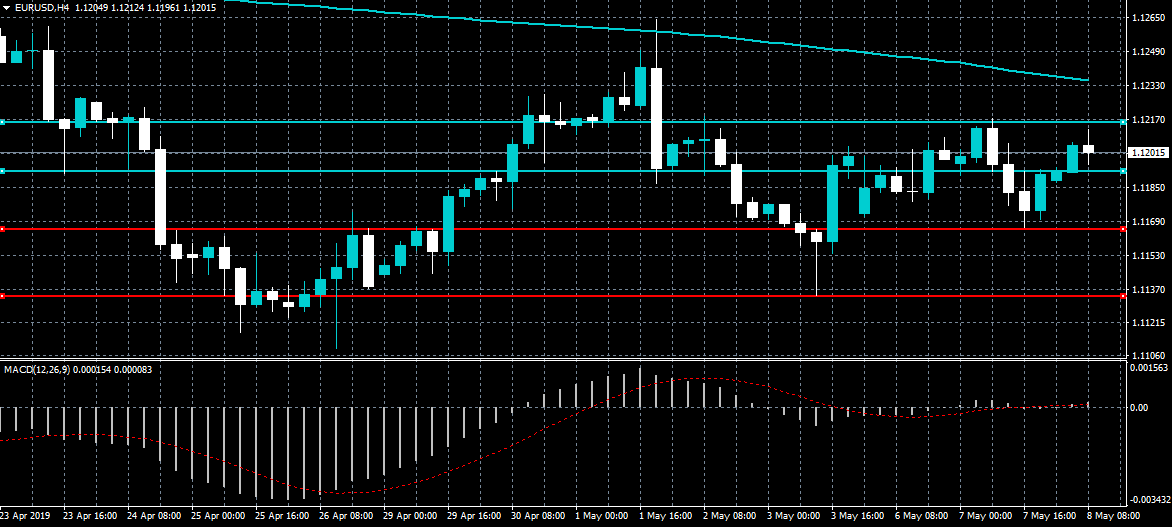
The euro currency continues to hold above the 1.1190 level against the US dollar following better than expected Industrial Production data from the German economy. The EURUSD pair is growing increasingly bullish and may soon target the 1.1250 resistance level. EURUSD buyers now need to move price above the key 1.1216 resistance level to encourage fresh technical buying.
The EURUSD pair is intraday bullish while trading above the 1.1190 level, key technical resistance is found at the 1.1216 and 1.1250 levels.
If the EURUSD pair moves below the 1.1190 level, key technical support is found at the 1.1164 and 1.1135 levels.