Sample Category Title
USDJPY Under Descending Line, Bias Neutral-To-Bullish
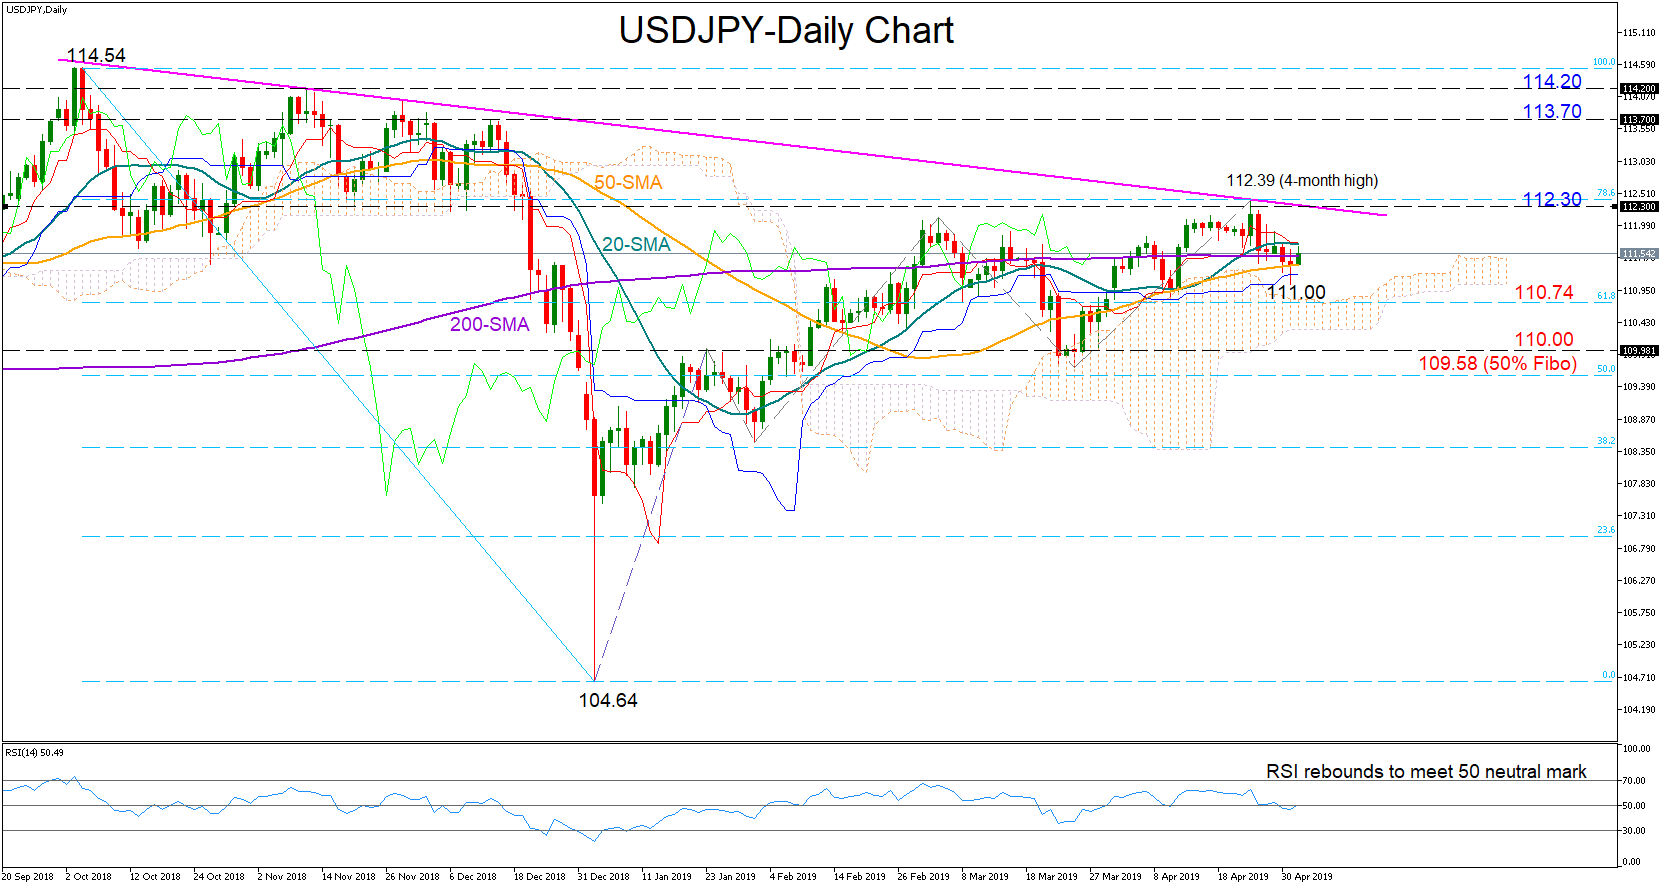
USDJPY met heavy resistance from the soft descending line drawn from the 114.54 top last week, ending bullish action at a four-month high of 112.39. The pair is currently fluctuating around its 200-day simple moving average (SMA), with momentum indicators pointing to a neutral-to-bullish short-term trading; the red Tenkan-sen is flat slightly above the blue Kijun-sen, while the RSI is set to cross above its 50 neutral mark.
For a meaningful rally the bulls probably need to jump above the downtrend line seen around 112.30, where the 78.6% Fibonacci of the downleg from 114.54 to 104.64 is also placed. Higher, the next battle could develop between 113.70 and 114.20, key resistance levels during November and December.
In case the bears retake control, the price could initially rest near yesterday’s low of 111 before touching the 61.8% Fibonacci of 110.74. Beneath the latter, the decline may next pause between 110 and the 50% Fibonacci of 109.58, which if significantly broken would raise speculation over a trend reversal; such a move would violate the upward pattern started in January.
Meanwhile in the medium-term timeframe, USDJPY is still enjoying positive conditions thanks to the higher highs and higher lows registered since the start of the year.
In brief, USDJPY faces a neutral-to-positive bias in short term, while in the medium-term picture the outlook remains bullish.
AUDUSD Still Consolidates In A Sideways Channel, Hovers Near 0.7000
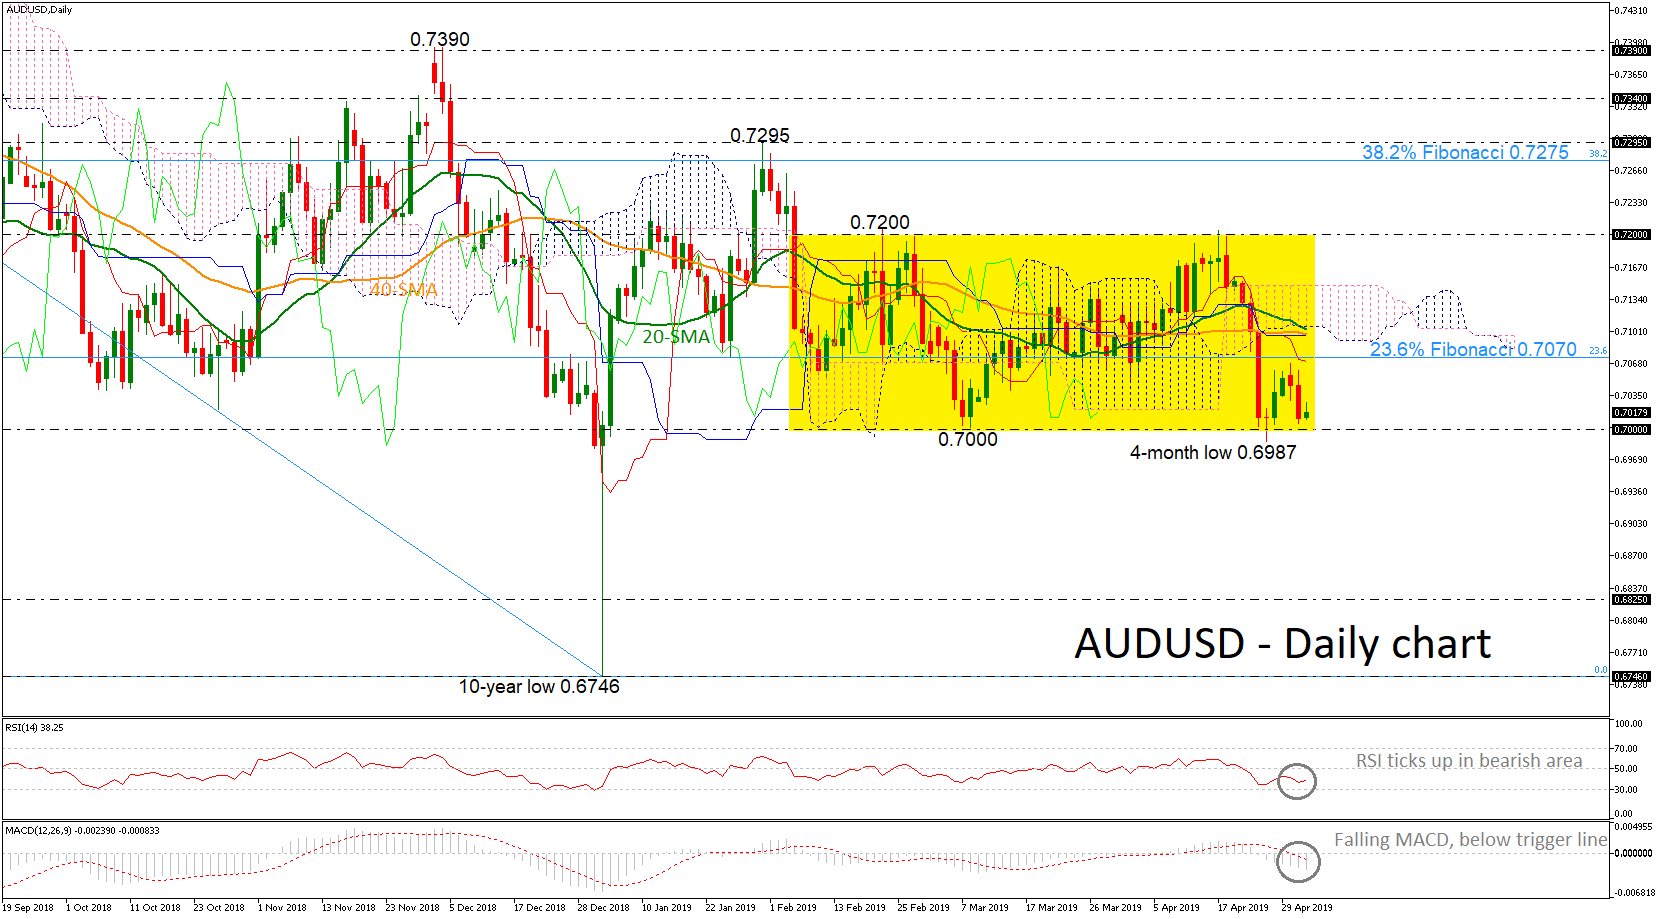
AUDUSD has been struggling in a tight range over the last three months with upper boundary the 0.7200 psychological level and lower boundary the 0.7000 handle. During the preceding week the price tried to break lower, posting a new four-month low of 0.6987, but it failed once again to end the day below the consolidation area. Currently, the pair is trading below the 23.6% Fibonacci retracement level of the downleg from 0.8135 to 0.6746 around 0.7070 and the Ichimoku cloud, suggesting further bearish moves.
The short-term bias looks negative as the MACD keeps losing ground below its trigger line, while the RSI seems to be making its way up below the 50-neutral mark. Moreover, the price is capped by the 20- and 40-simple moving averages (SMAs), which are ready to create a bearish cross.
The 0.7000 psychological level could be a trigger point for steeper bearish action and if there is a break of this significant line, investors could turn their attention on the 0.6825 support, taken from January 2016, turning the neutral outlook to bearish.
On other hand, if the pair reverses back to the upside, immediate resistance is coming from the 23.6% Fibonacci of 0.7070 ahead of the lower surface of the Ichimoku cloud around 0.7100. If the price continues to rise, resistance could next be faced somewhere near the 0.7200 key level.
Overall, the decline over the last days did not change the neutral bias. Any drop below 0.7000 could resume the long-term bearish structure.
Bank of England’s Status Quo In Focus
Traders are gearing for an exciting and busy Super Thursday, this means that the Bank of England will be delivering its monetary policy decision and inflation and growth forecast. The current benchmark interest rate sits at 0.75 percent and the decision by the bank is due at noon in London. Remember, Mark Carney, the governor of the Bank of England, has kept the monetary policy unchanged for a long period of time. This is the first meeting since the prime minister Theresa May, secured an extension of Brexit.
Although it is a matter of shame that despite lengthy 2 years Brexit negotiation, the prime minister still doesn't have any deal which is backed by her own party, never mind the opposition. During this time, the bank has been working mostly on the scenario of a smooth Brexit. Given that Brexit deadline is extended until October, the bank will have to come up with new predictions in order to factor in this delay.
So far, the economic data hasn't fallen off the cliff. I am not saying that the economic data is very healthy, but we cannot ignore the fact that we have seen more upside surprises during Q 1. Despite this, it is likely that the overall approach adopted by the Bank of England could be cautious because the continued uncertainty is burdensome for the economy. But, the bank may actually raise its growth and inflation forecast for 2019 because of better than expected economic data. This is positive for the sentiment but not be a big deal from the market perspective.
The focus is going to be on the status quo. What is widely expected in the market is that the vote may shift from 9-0 to 8-1. The person who is likely to be of a different mind frame is Michael Saunders, the committee's most hawkish member. This would be considered as a hawkish message, but this doesn't mean an actual interest rate hike. In my opinion, it is unlikely that the governor, Mark Carney will do anything before he leaves. This means no rate hike until 2020.
The question is how sterling will react on the back of this event?
Well, if the status quo is maintained then it means no significant moves for sterling. However, if we see a change of mind among the committee members, speculators are likely to get off from the sidelines, they may actually push the styling above the 1.31 mark against the dollar. The 50-day moving average on a daily chart is trading at 1.3105, it is also acting as a resistance. The price is trading above its 100 and 200-day moving averages which is a bullish sign. Thus, the overall read from the technical analysis is likely to be to the outside. The near term resistance is sitting at 1.3133 and a break of that would open the room towards the next resistance which is at 1.3191. Similarly, the immediate support is at 1.2926 and a break of this may open the door towards the next level which is 1.2876.
In terms of pound dollar 2-month risk reversal we have seen a huge search during the month of April where it has moved from -2.5 all the way to -0.5. The CFTC data shows bat there is an increase of 5.7 percent in the bullish sentiment in total. this indicates that a move to the upside is what expected by the smart money.
EUR/USD Outlook: Euro Bulls On Hold After Steady Fed
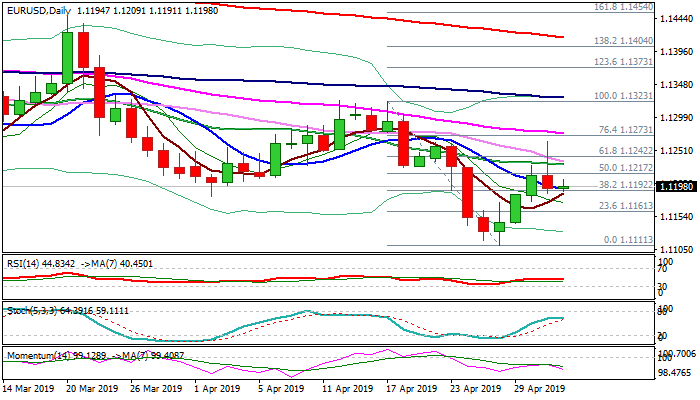
The Euro holds within narrow consolidation in early Thursday's trading following strong post-Fed dip on Wednesday. The US central bank kept steady course, disappointing those who expected dovish steer, as initial signal on downgraded inflation outlook, being quickly offset by comments from Jerome Powell, who described the factors that drag inflation as transitory and saw no reasons for rate move in either direction. Long upper shadow of Wednesday's daily candle, left after strong upside rejection from new 2 1/2 week high at 1.1264 and close below cracked important barriers (10/20/30SMA's/Fibo 61.8% of 1.1323/1.1111) suggests that recovery might be over. Strengthening bearish momentum on daily chart adds to negative outlook, which needs repeated close below 10SMA (1.1195) for confirmation. Only return and close above 1.1242 Fibo barrier would neutralize bearish threats. German Manufacturing PMI (Apr 44.5f/c vs 44.5 prev) is the key event of European session, with BoE policy meeting and US jobless claims also eyed for fresh signals.
Res: 1.1209, 1.1235, 1.1242, 1.1264
Sup: 1.1188, 1.1170, 1.1147, 1.1111
Gold Eases Gains As Fed Stays Neutral
Gold prices gave up the intraday gains following the FOMC meeting. The precious metal traded higher on the day but fell after the Fed left the interest rates unchanged. The central bank also maintained a neutral tone in its statement. This was in contrast to the general expectations that the Fed could start preparing the markets for a rate cut. Gold was down 0.5% on the day.
XAUUSD Likely to Trade Sideways
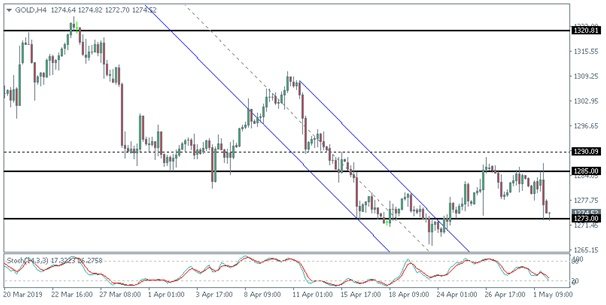
XAUUSD continues to trade within the range that is established. Price briefly tested the resistance area of 1285 yesterday before slipping back to the support formed at 1273. A daily close below 1273 support is required to confirm further downside in the precious metal. For the moment, the upside bias seems to be diminishing. A close below 1273 will potentially see the bearish trend resuming in gold.
Oil Weakens On Inventory Build Up
Crude oil prices were trading weaker on Wednesday. The US Energy Information Administration (EIA) weekly crude oil inventory report saw a buildup of 9.9 million barrels in the last week of April. This was higher than the forecasts of a 1.5 million estimate. The build in the EIA report comes after the API had, earlier this week, reported an increase in oil inventory.
WTI Holds on to the Support
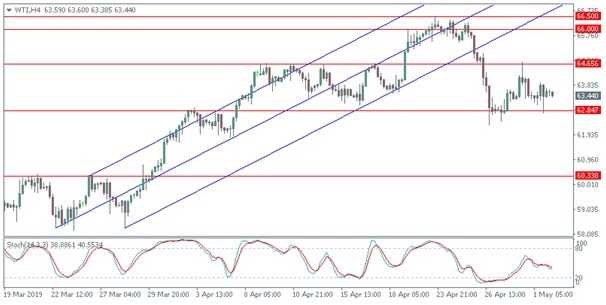
WTI crude oil is testing the support level at 62.84 for the second time as price action settles into a range. The resistance level that was briefly tested at 64.55 is the likely upside target. A firm close near the 64.55 resistance level will confirm the resistance level, following which oil prices could break to the downside from the current range. A close below 64.55 will see crude oil extending towards the lower support at 60.33.
Euro Weakens Amid A Quiet Trading Day
The euro was seen trading muted on Wednesday. Many European markets were closed on account of the May Day Bank Holiday. That being said, the common currency was rising earlier in the day in the run-up to the Fed meeting. However, the euro gave up the gains just after rising to a two-week high. Traders will be looking up to the final manufacturing PMI figures due later today.
EURUSD Biased to the Downside
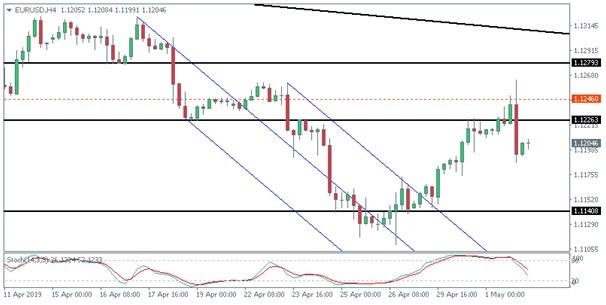
The euro was briefly lifted on Wednesday as price test the resistance area of 1.1248 – 1.1226. Prices were rejected at this level as the euro settled lower on the day. The downside bias is likely to strengthen. The EURUSD could be seen extending the declines to retest the support at 1.1140 in the near term. Overall, price action could remain trading flat within these levels until there is a breakout.
Crude Oil Consolidation
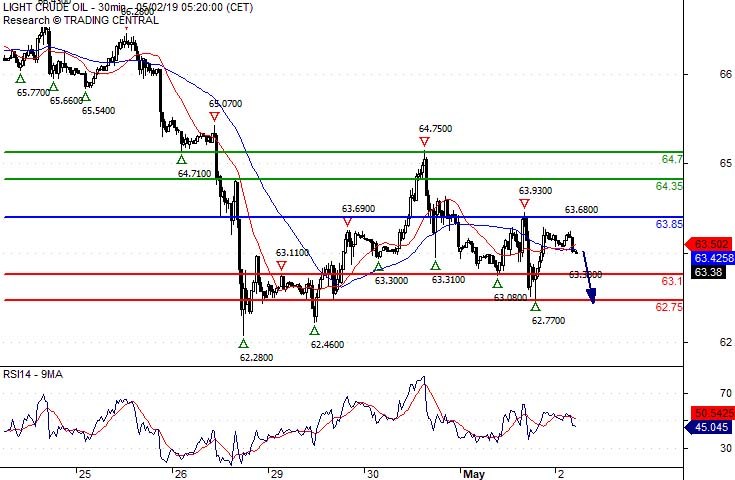
Pivot (invalidation): 63.85
Our preference Short positions below 63.85 with targets at 63.10 & 62.75 in extension.
Alternative scenario Above 63.85 look for further upside with 64.35 & 64.70 as targets.
Comment As Long as 63.85 is resistance, expect a return to 63.10.
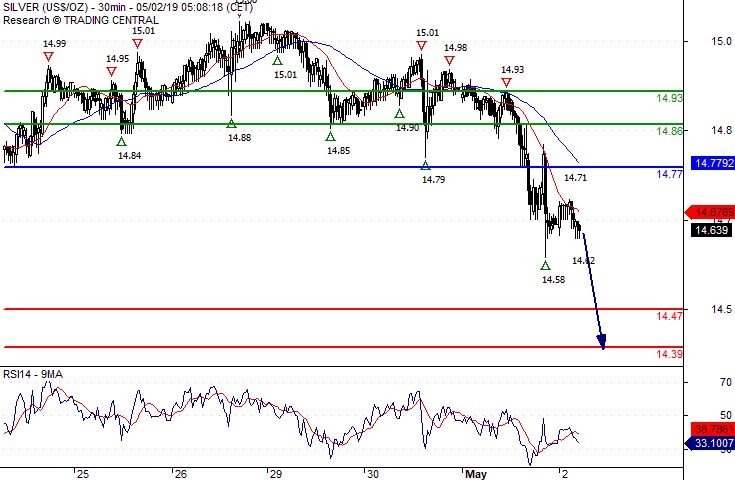
Silver Spot Under Pressure
Pivot (invalidation): 14.7700
Our preference Short positions below 14.7700 with targets at 14.4700 & 14.3900 in extension.
Alternative scenario Above 14.7700 look for further upside with 14.8600 & 14.9300 as targets.
Comment The RSI shows downside momentum.
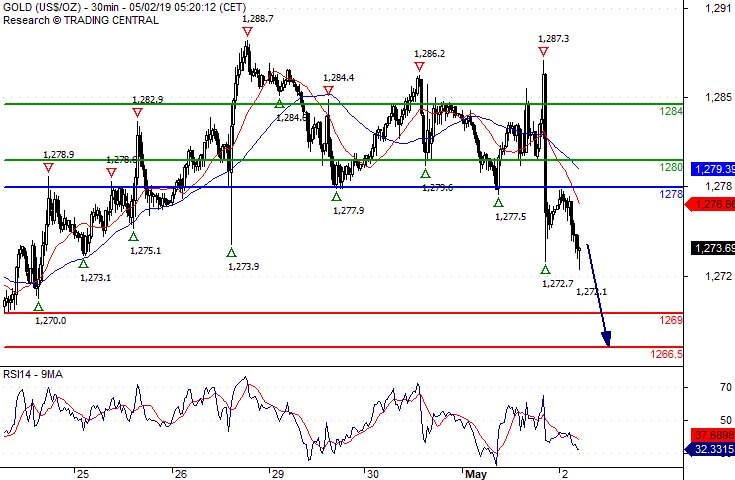
Gold Spot Look For 1266.50
Pivot (invalidation): 1278.00
Our preference Short positions below 1278.00 with targets at 1269.00 & 1266.50 in extension.
Alternative scenario Above 1278.00 look for further upside with 1280.00 & 1284.00 as targets.
Comment The RSI is bearish and calls for further decline.