Sample Category Title
EURUSD Testing Key Pivot
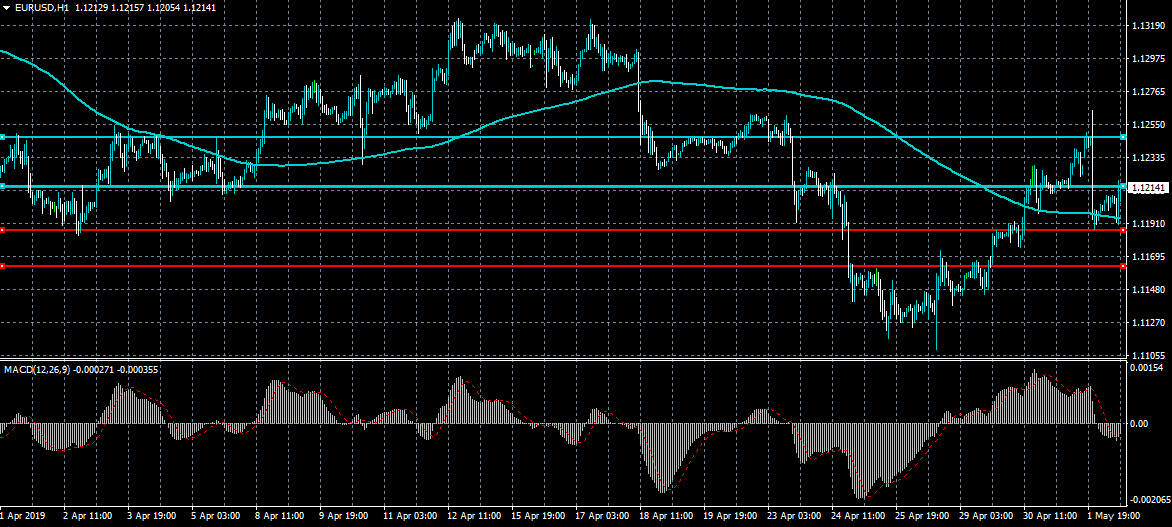
The euro is attempting to recover higher against the US dollar following the release of more better than expected European data points. The EURUSD pair is currently testing towards the pivotal 1.1216 level, after briefly slipping below the 1.1200 support level. Short-term technical indicators suggest that the EURUSD pair could test back towards the 1.1250 level if the pivot is broken.
The EURUSD pair is intraday bullish while trading above the 1.1216 level, key technical resistance is found at the 1.1250 and 1.1265 levels.
If the EURUSD pair fail to move above the 1.1216 level, key support is found at the 1.1190 and 1.1164 levels.
GBPUSD Testin Daily Pivot
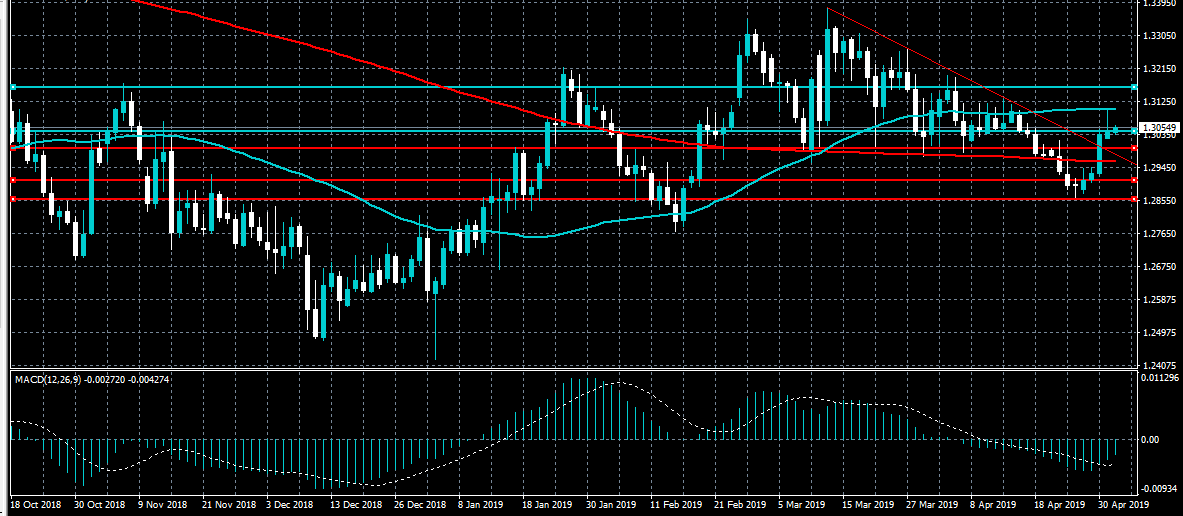
The British pound is testing back towards the pivotal 1.3050 against the US dollar after the pair found strong technical resistance from the 1.3100 level on Wednesday. The GBPUSD pair may start to decline back towards 1.3000 level if the 1.3050 support level is breached. Overall, traders remain cautious ahead of today’s Bank of England interest rate decision.
The GBPUSD pair is only bullish while trading above the 1.3050 level, key resistance is found at the 1.3100 and 1.3130 levels.
If the GBPUSD pair trades below the 1.3050 level, key intraday support is remains at the 1.3000 and 1.2970 levels.
EURUSD Hits Bullish Target
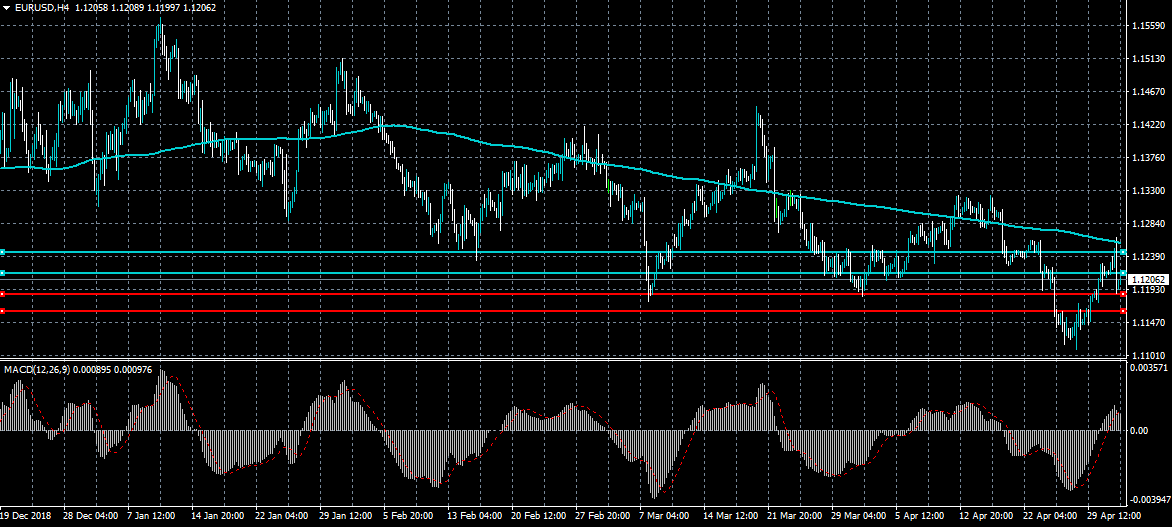
The euro is starting to retreat lower against the US dollar after Federal Reserve Chair Jerome Powell sounded more bullish towards the US economy than expected. The EURUSD may have reached its bullish weekly target, with pair reaching 1.1265. Overall, the intraday sentiment surrounding the EURUSD pair is only bearish while price trades below the 1.1216 level.
The EURUSD pair is intraday bearish while trading below the 1.1216 level, key technical support remains at the 1.1190 and 1.1174 levels.
If the EURUSD pair trades above the 1.1216 level, key resistance is found at the 1.1265 and 1.1290 levels.
BTCUSD Bulls Need To Break $5,300
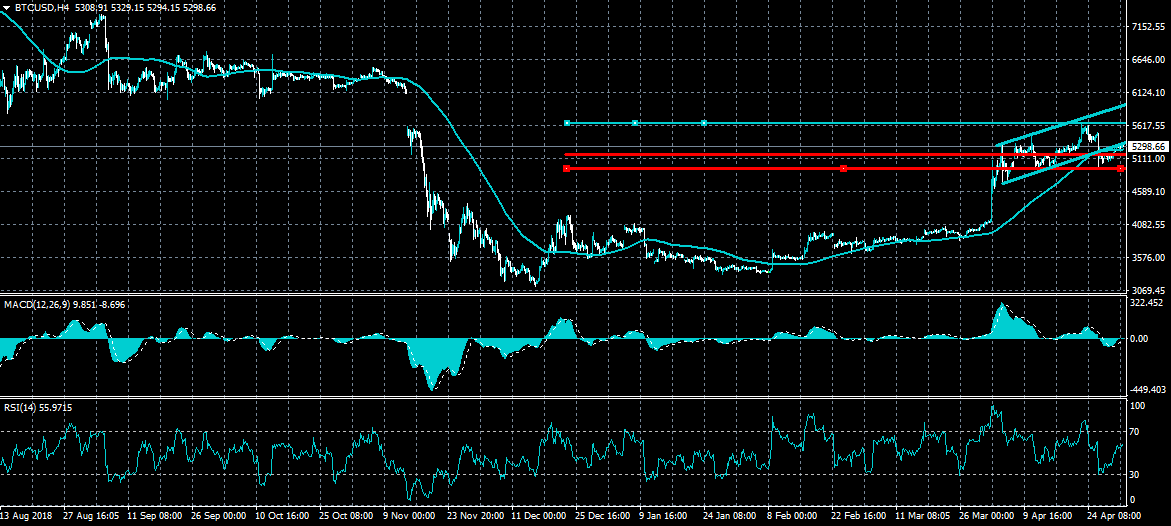
Bitcoin has so far had a solid start to the new trading month, with the number one cryptocurrency performing a strong daily price close. BTCUSD bulls need to move price above the $5,300 level to encourage new technical buying towards the current 2019 trading high. Caution is still advised in the short-term as a bearish head and shoulders pattern can be seen on the four-hour time frame
The BTCUSD pair is only bullish while trading above the $5,200 level, key intraday resistance is found at the $5,300 and $5,620 levels.
If the BTCUSD pair trades under the $5,200 level, sellers may test towards the $4,900 and $4,750 support levels.
The Analytical Overview Of The Main Currency Pairs
The EUR/USD currency pair
Technical indicators of the currency pair:
Prev Open: 1.12143
Open: 1.11970
% chg. over the last day: -0.13
Day's range: 1.11911 – 1.12092
52 wk range: 1.1111 – 1.2009
EUR/USD retreated from the local maximums. The demand for USD has grown after the comments by the Federal Reserve. The regulator saved the key interest range at the previous 2.25-2.50%. Central Bank noted a stable economy growth, the labour market stability and optimistic expectations regarding the inflation. Right now the quotes are consolidating around 1.11850-1.12100. The trading instrument has a tendency for further correction. You should open positions from the key levels.
The Economic News Feed for 02.05.2019:
Industrial PMI (GER) – 10:550 (GMT+3:00);
Number of Primary Jobless Claims (US) – 15:30 (GMT+3:00);
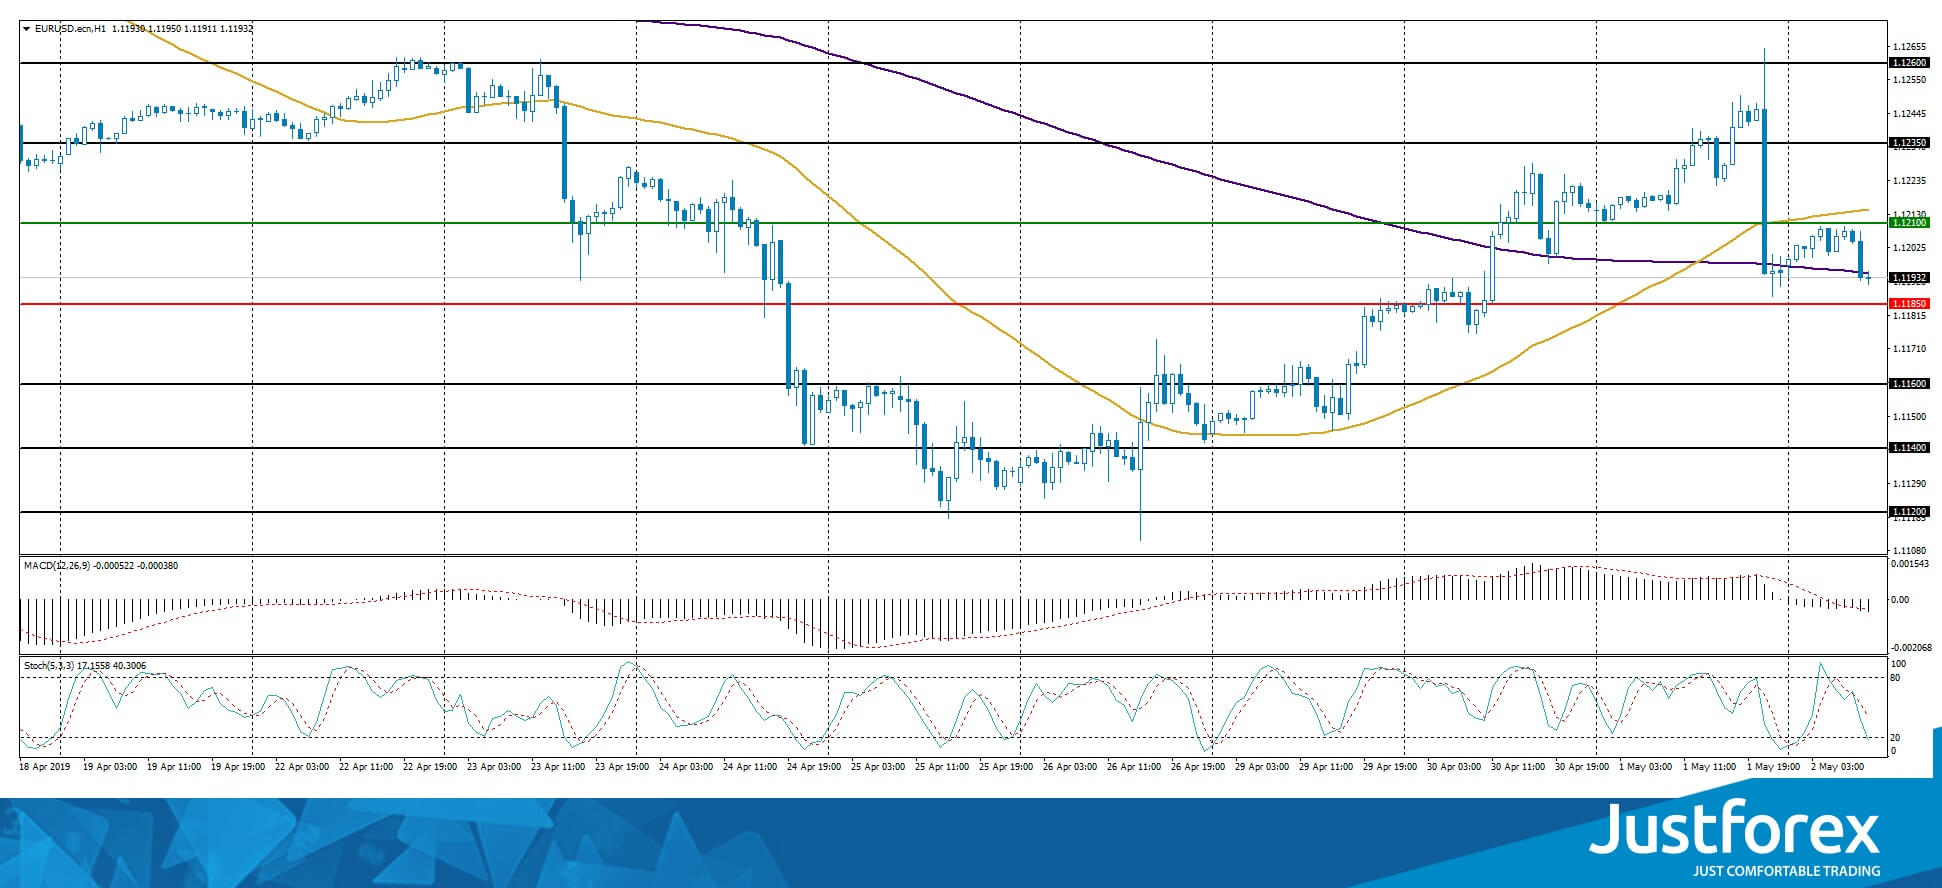
The indicators do not provide precise signals, the price has crossed 50 MA and 200 MA.
The MACD histogram is in the negative zone and below the signal line which gives a strong signal to sell EUR/USD.
The Stochastic Oscillator is in the neutral zone, the %K line is below the %D line which points to the bearish mood.
Trading recommendations
Support levels: 1.11850, 1.11600, 1.11400
Resistance levels: 1.12100, 1.12350, 1.12600
If the price fixes below 1.11850, expect further correction toward 1.11600-1.11400.
Alternatively, the quotes can grow toward 1.12350-1.12600.
The GBP/USD currency pair
Technical indicators of the currency pair:
Prev Open: 1.30284
Open: 1.30518
% chg. over the last day: +0.15
Day's range: 1.30383 – 1.30691
52 wk range: 1.2438 – 1.3631
GBP/USD is in an overall bullish mood. The demand for GBP is supported by the positive results of Theresa May's negotiations with the main opposition party. Right now GBP/USD is consolidating around 1.30350-1.30750 range. The investors are waiting for the Bank of England to announce the new key interest rate. It is expected that the regulartor will keep the current monetary policy at the previous levels. Keep an eye on the Central Bank's comment and rhetorics and open positions from the key levels.
The Economic News Feed for 02.05.2019 is calm.
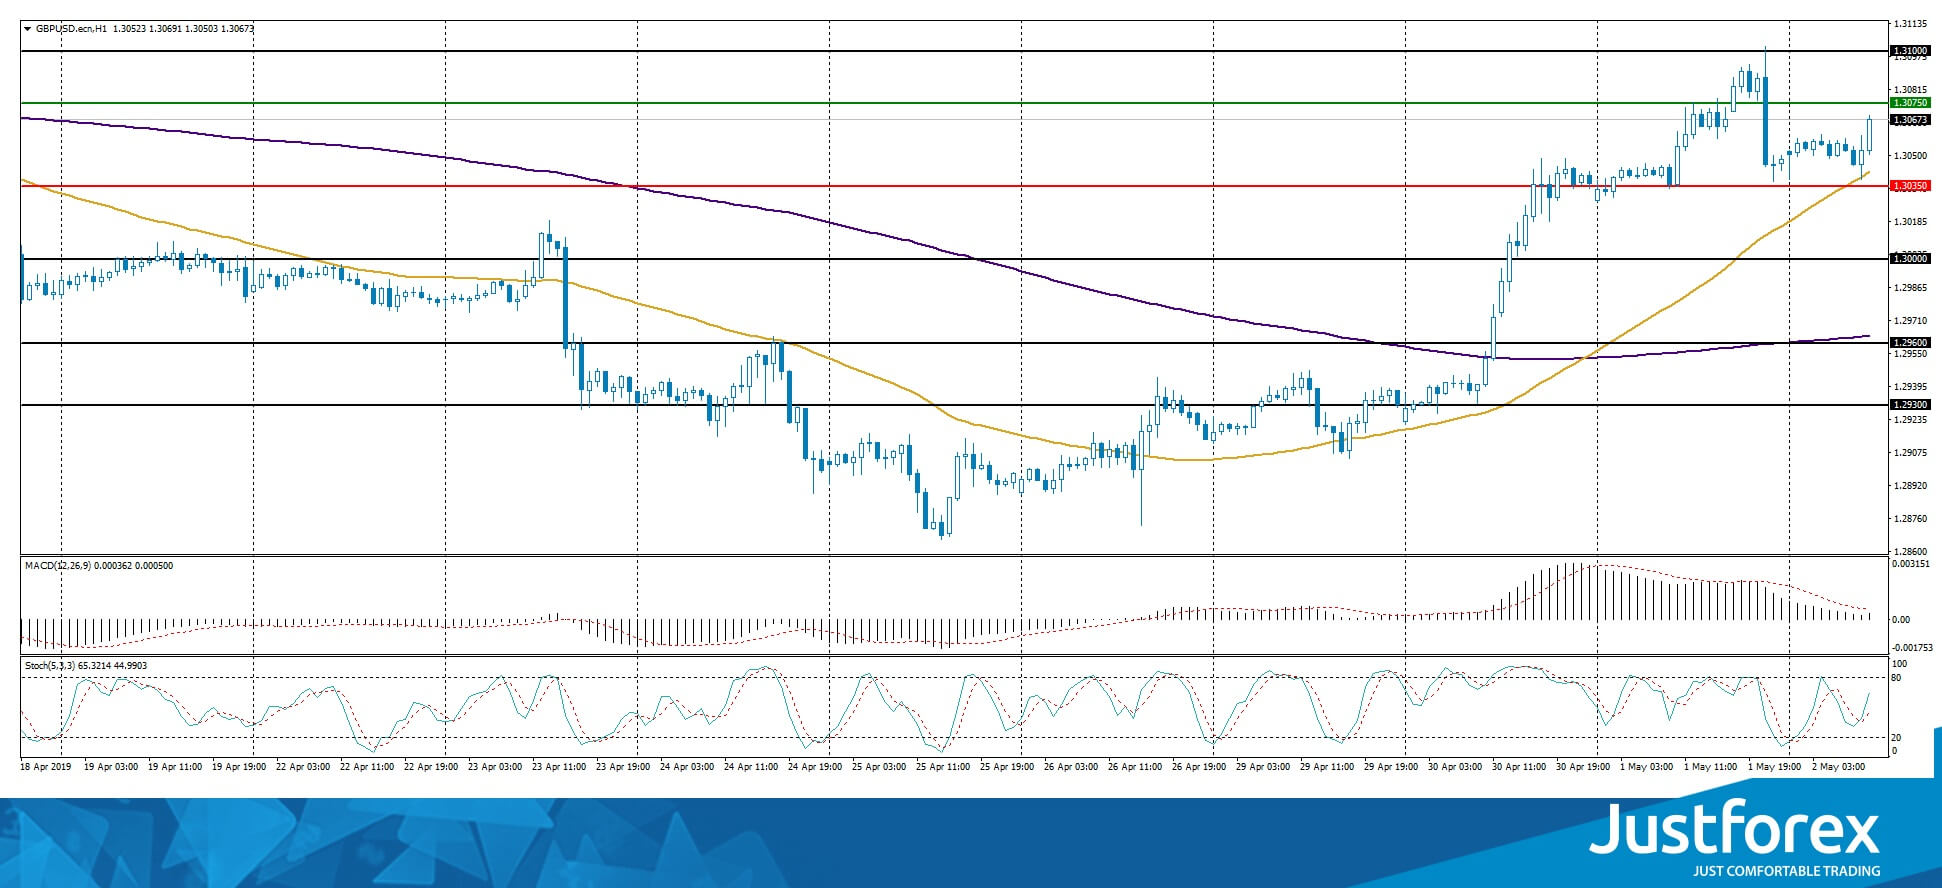
The price fixed above 50 MA and 200 MA which points to the power of the buyers.
The MACD histogram is in the positive zone but below the signal line which gives a weak signal to buy GBP/USD.
The Stochastic Oscillator is in the neutral zone, the %K line is above the %D line which points to the bullish mood.
Trading recommendations
Support levels: 1.30350, 1.30000, 1.29600
Resistance levels: 1.30750, 1.31000
If the price fixes above 1.30750, expect further growth toward 1.31250-1.31400.
Alternatively, the quotes can correct toward 1.30000.
The USD/CAD currency pair
Technical indicators of the currency pair:
Prev Open: 1.33868
Open: 1.34303
% chg. over the last day: +0.37
Day's range: 1.34303 – 1.34462
52 wk range: 1.2727 – 1.3664
USD/CAD has been very active the last couple of days. There is no defined trend. Right now CAD is consolidating around 1.34200-1.34500. The trading instrument has a tendency to fall. Keep an eye on the oil quotes dynamics and open positions from the key levels.
The Economic News Feed for 02.05.2019 is calm.
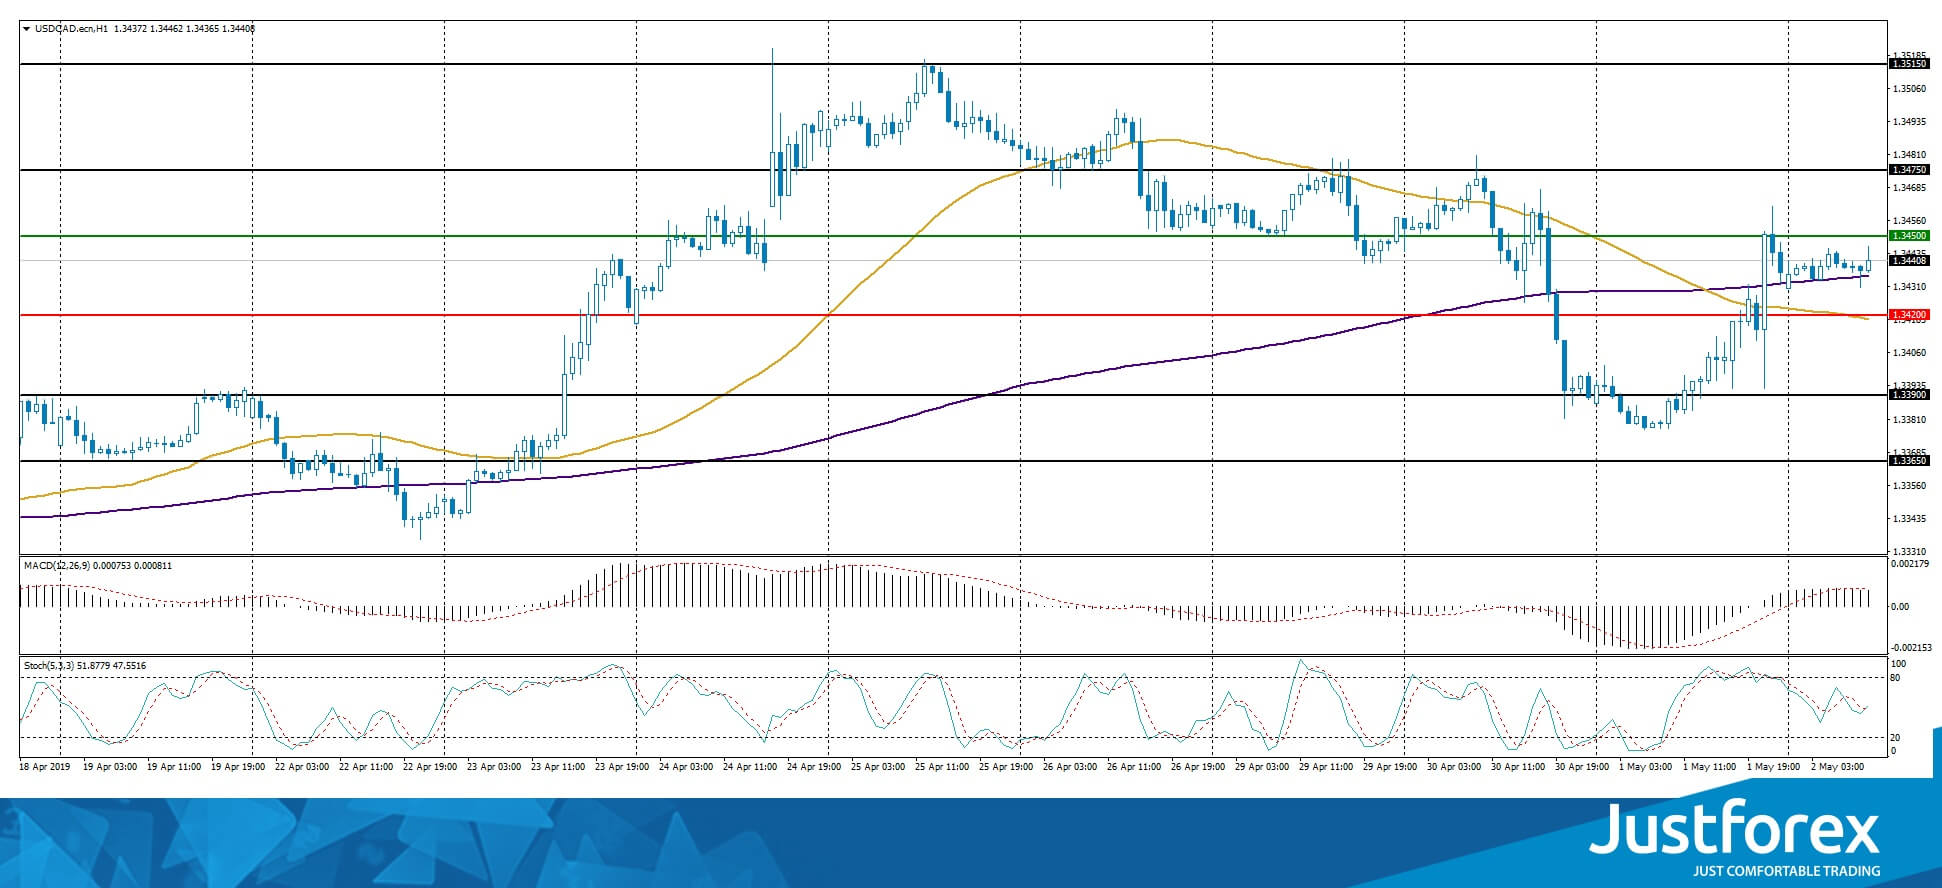
The indicators do not provide precise signals, 50 MA has crossed 200 MA.
The MACD histogram is in the positive zone but below the signal line which gives a weak signal to buy USD/CAD.
The Stochastic Oscillator is in the neutral zone, the %K line has crossed the %D line. There are no signals at the moment.
Trading recommendations
Support levels: 1.34200, 1.33900, 1.33650
Resistance levels: 1.34500, 1.34750, 1.35150
If the price fixes above 1.34500, consider buying USD/CAD. The movement will tend toward 1.34750-1.35000.
Alternatively, the quotes can descend toward 1.33900-1.33700.
The USD/JPY currency pair
Technical indicators of the currency pair:
Prev Open: 111.414
Open: 111.380
% chg. over the last day: -0.03
Day's range: 111.350 – 111.665
52 wk range: 104.97 – 114.56
USD/JPY has an ambiguous technical picture. The trading instrument is consolidating. The USD/JPY quotes are testing the local support and resistance levels at 111.350 and 111.650. The investors are waiting for additional drivers. The demand for the USD remains high after the Federal Reserve comments. You should open positions from the key levels.
The Economic News Feed for 02.05.2019 is calm. The markets are closed due to the national holiday.
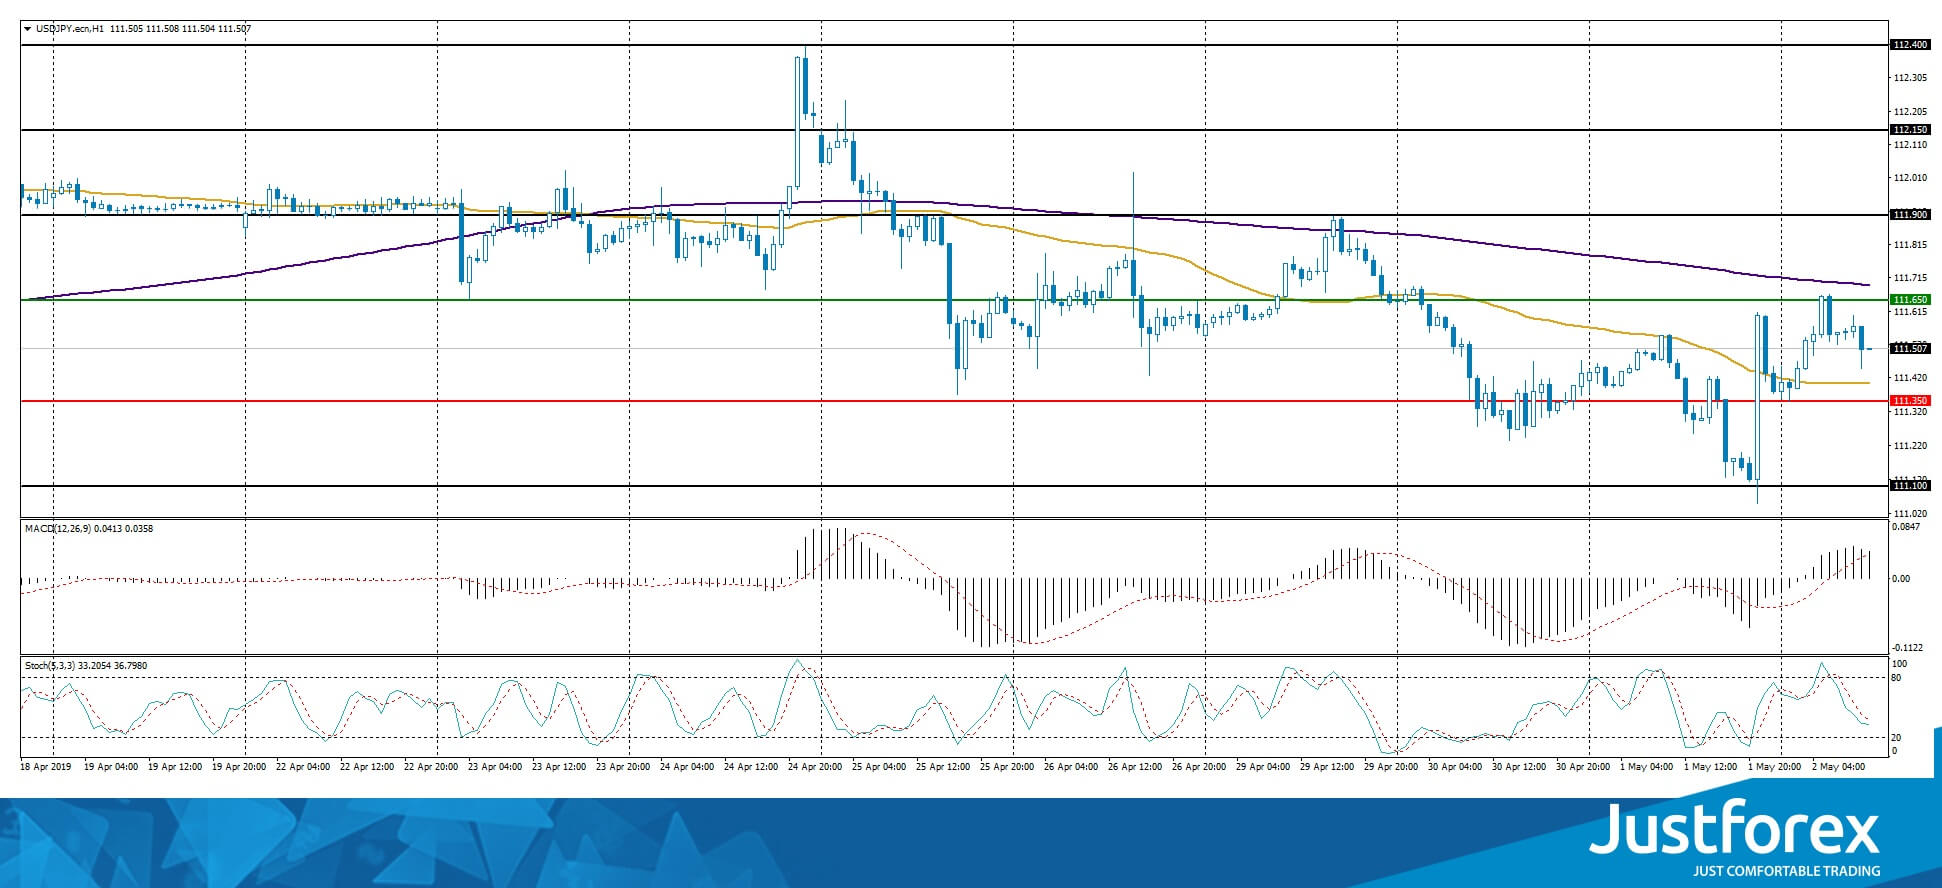
The indicators do not provide precise signals, the price fixed between 50 MA and 200 MA.
The MACD histogram is in the positive zone and above the signal line which gives a strong signal to buy USD/JPY.
The Stochastic Oscillator is in the positive zone and above the signal line which indicates a bearish mood.
Trading recommendations
Support levels: 111.350, 111.100
Resistance levels: 111.650, 111.900, 112.150
If the price fixes below 111.350, expect the quotes to fall toward 111.000.
Alternatively, the quotes can grow toward 111.900-112.150.
Demand For To US Dollar Has Increased After The Fed Comments. Investors Expect The Bank Of England Interest Rate...
The US dollar recovered some of its losses against a basket of major currencies. Yesterday, the Fed, as expected, kept the range of the key interest rate at the same level of 2.25-2.50%. The Central Bank noted the steady growth of the economy, the stability of the labor market and optimistic expectations regarding the acceleration of inflation. The dollar index (#DX) closed in the positive zone (+0.22%).
In addition, important economic data from the UK and the US were published yesterday. Thus, the UK manufacturing PMI counted to 53.1 in April, while experts expected 53.2. ADP nonfarm employment change increased to 275K in April, although investors forecasted 181K. However, ISM manufacturing PMI dropped to 52.8 in April instead of 55.0. Today, financial market participants took a wait-and-see attitude before the Bank of England interest rate decision. It is expected that the regulator will leave the rate at the same level of 0.75%.
The "black gold" prices are consolidating. At the moment, futures for the WTI crude oil are testing the mark of $63.35 per barrel.
Market Indicators
- Yesterday, there was the bearish sentiment in the US stock market: #SPY (-0.75%), #DIA (-0.62%), #QQQ (-0.32%).
- The 10-year US government bonds yield is recovering. Currently, the indicator is at the level of 2.52-2.53%.
The news feed on 05.02.2019:
- German manufacturing PMI at 10:55 (GMT+3:00);
- UK construction PMI at 11:30 (GMT+3:00);
- Bank of England interest rate decision at 14:00 (GMT+3:00);
- Initial jobless claims in the US at 15:30 (GMT+3:00).
Gold Develops In Descending Channel In Near Term
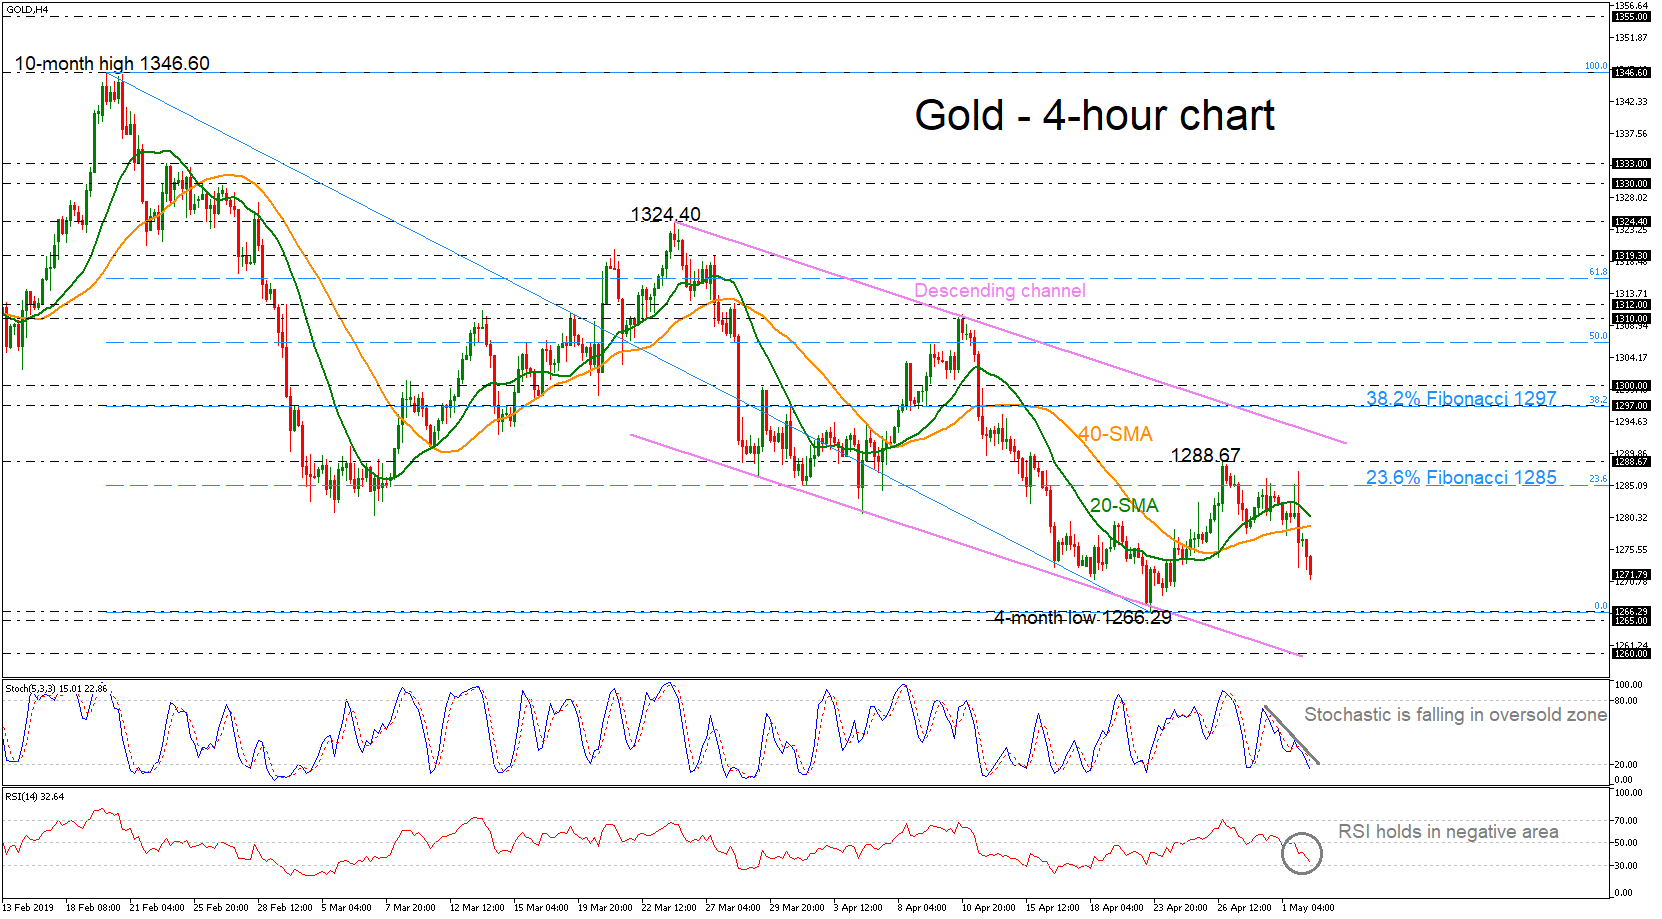
Gold had found strong resistance at the 23.6% Fibonacci retracement level of the downleg from 1346.60 to 1266.29 around 1285 and is falling aggressively below the 20- and 40-simple moving averages (SMAs) in the 4-hour chart. The stochastic oscillator is heading towards the oversold territory while the RSI entered the negative zone and is still pointing down.
A move southward could initially find support near the 1266.29 – 1265 support zone before the price touches the lower boundary of the descending channel around the 1260 barrier.
On the other side, if the market pares some of the losses and returns higher, immediate resistance is coming from the 40- and then from the 20-SMAs at 1279 and 1280 respectively. More advances could send prices until the 23.6% Fibonacci of 1285 and the peak taken from April 26 at 1288.67.
In brief, the yellow metal has been developing within a downward range over the last month in the short-term, while in the medium-term the price remains negative as well.
Forex Technical Analysis: EUR/USD, USD/JPY, GBP/USD
EUR/USD
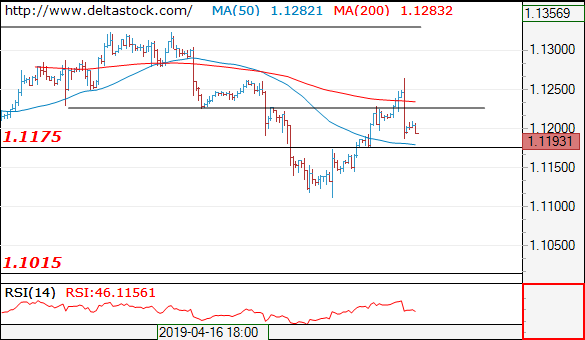
Current level - 1.1193
The intraday outlook is negative below 1.1230, for a break through 1.1175, towards 1.1110 low.
| Resistance | Support | ||
| intraday | intraweek | intraday | intraweek |
| 1.1230 | 1.1330 | 1.1175 | 1.1010 |
| 1.1330 | 1.1450 | 1.1110 | 1.0860 |
USD/JPY
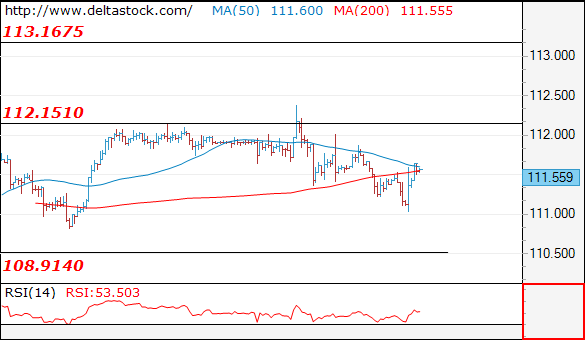
Current level - 111.55
I favor a break through 111.80 area, for a test of 112.40 peak. Initial support lies at 111.00.
| Resistance | Support | ||
| intraday | intraweek | intraday | intraweek |
| 111.87 | 113.20 | 110.80 | 108.90 |
| 113.20 | 114.50 | 110.50 | 107.40 |
GBP/USD
Current level - 1.3049
The reversal at 1.3100 signals a bearish bias, for a test of 1.2960 support area. Key hurdle lies at 1.3120.
| Resistance | Support | ||
| intraday | intraweek | intraday | intraweek |
| 1.3120 | 1.3450 | 1.3020 | 1.2810 |
| 1.3450 | 1.3450 | 1.2960 | 1.2610 |
EUR/USD Likely To Step Higher
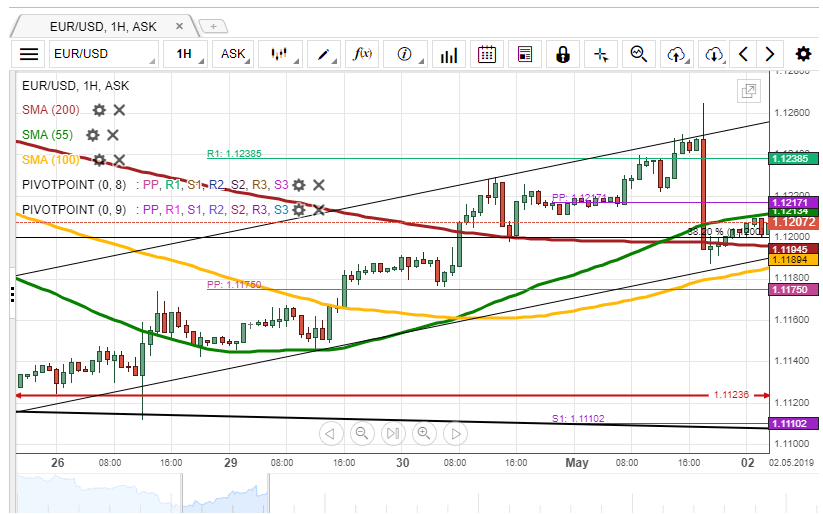
On Wednesday, the EUR/USD currency pair traded between the Fibonacci 38.20% retracement and the weekly R1, located at 1.1200 and 1.1239 respectively.
From a technical perspective, it is likely, that some upside potential could prevail in the market, as the pair is supported by the 100– and 200-hour SMAs located circa 1.1190. However, the pair has to surpass the given weekly R1.
If the given support does not hold, it is expected, that the exchange rate could step lower. However, it is unlikely, that the rate could slump lower than the 1.1175 level due to the support formed by the monthly PP.
GBP/USD Could Trade Sideways
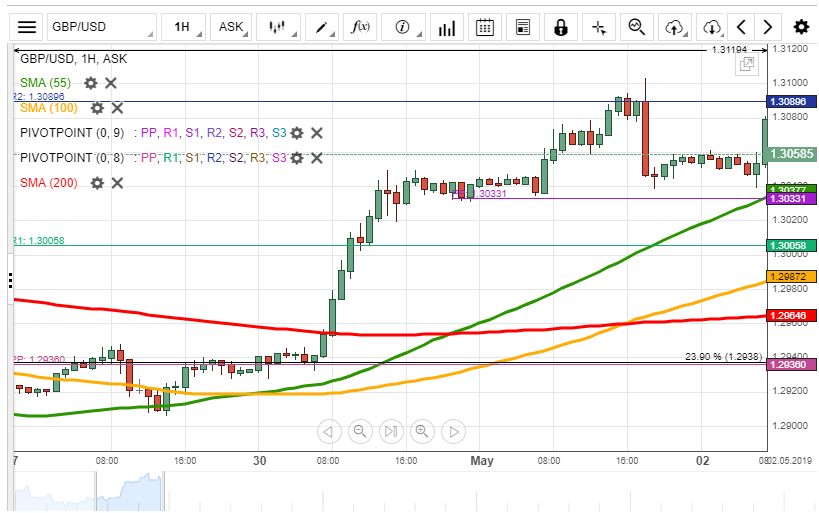
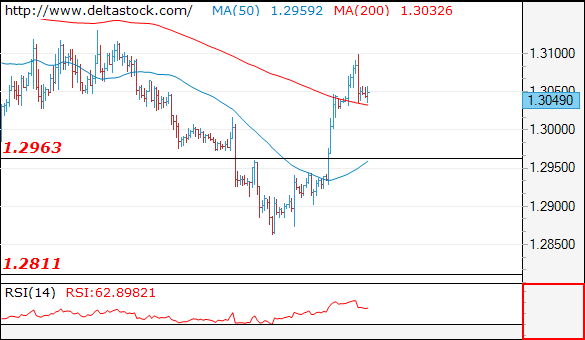
Yesterday, the GBP/USD exchange rate traded sideways between the monthly PP and the weekly R2, located at 1.3033 and 1.3090 respectively.
If the given support and resistance hold, it is expected, that the rate continues to trade sideways in the short term. However, note, that some volatility might occur in the market due to the UK Official Bank Rate release today at 11:00 GMT.
On the other hand, the currency pair could use the support of the 55-hour SMA at 1.3036 and breach the given resistance. In this case, the pair could reach the resistance level at 1.3119.
It is unlikely, that bears could prevail in the market, and the British Pound could drop lower than the weekly R1 at 1.3006.