

Sample Category Title
USD/JPY Range Bound Below Key 112.00 Resistance
Key Highlights
- The US Dollar failed to hold gains above 112.20 and declined recently against the Japanese Yen.
- A crucial bearish trend line in place with resistance near 111.85 on the 4-hours chart of USD/JPY.
- The US Initial Jobless Claims in the week ending April 27, 2019 were unchanged from 230K.
- The US nonfarm payrolls in April 2019 could decline from 196K to 185K.
USDJPY Technical Analysis
This past week, the US Dollar spiked above the 112.00 and 112.20 levels against the Japanese Yen. However, the USD/JPY pair failed to hold gains above the 112.00 level and recently corrected lower.
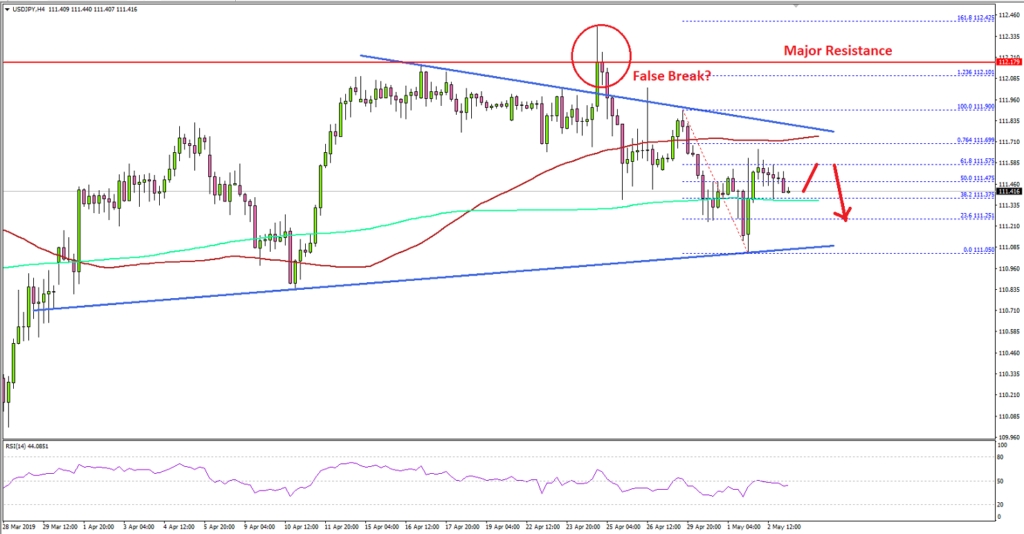
Looking at the 4-hours chart, the pair topped near the 112.40 level, resulting in a false upside break. The pair trimmed most its gains and declined below 112.00 and 111.80. The decline was strong since the pair surpassed the 111.50 level and traded close to 111.00.
A swing low was formed at 111.05 and the pair corrected higher. It climbed above 111.45 and the 50% Fib retracement level of the last decline from the 111.90 high to 111.05 low.
On the upside, there is a strong resistance formed near 111.85 and 111.90. There is also a crucial bearish trend line in place with resistance near 111.85 on the same chart.
A successful close above the trend line and 112.00 is needed for a sustained upward move above 112.20 and 112.40 level in the near term. If not, there is a risk of a downside extension below the 111.00 level in the coming days.
Fundamentally, the US Initial Jobless Claims figure for the week ending April 27, 2019 was released by the US Department of Labor. The market was looking for a decline in claims from 230K to 215K.
However, the result was disappointing since there was no change from 230K in the US Initial Jobless Claims. Therefore, the 4-week moving average increased by 6.5K to 212.5K.
The report added:
The advance number for seasonally adjusted insured unemployment during the week ending April 20 was 1,671,000, an increase of 17,000 from the previous week’s revised level.
Overall, the USD/JPY pair seems to be trading in a broad range below the key 112.00 resistance, but today’s NFP release in the US could trigger the next crucial break either above 112.00 or below 111.00.
Economic Releases to Watch Today
- Euro Zone CPI for April 2019 (YoY) (Prelim) – Forecast +1.6%, versus +1.4% previous.
- Euro Zone Core CPI for April 2019 (YoY) (Prelim) – Forecast +1.0%, versus +0.8% previous.
- US nonfarm payrolls April 2019 – Forecast 185K, versus 196K previous.
- US Unemployment Rate April 2019 – Forecast 3.8%, versus 3.8% previous.
- US ISM Non-Manufacturing Index April 2019 – Forecast 57.0, versus 56.1 previous.
The Post-Fed Hangover Continues
The post-Fed hangover continues
Post-Fed positioning unwinds continued unabated overnight as US yields rose along with the dollar and equities fell, along with ugly sell-offs on gold and oil. Pan-Asia manufacturing Purchasing Manager Indices (PMI) data released yesterday mostly beat expectations handsomely, while Germany’s PMI was right on consensus. This perhaps hints at the light at the end of the tunnel for what has been a two-speed global economy so far this year. The Federal Reserve was the bigger story, however, as short-term positioning for a dovish Fed headed en-masse for the exit doors – despite most US data screaming the opposite.
The rise in US Treasury yields has left the yield curve pleasingly positive from 2-10-year tenors and bodes well for financial sector profitability in Q2. This was also supportive of the US dollar, as the greenback continued its relentlessly-grinding rally higher. The dollar’s role as the developed-market high-yielder currency-of-choice is a story that will continue throughout the year.
Wall Street eased overnight with the S&P 500 falling 0.20%, the Nasdaq down 0.15% and the Dow Jones dropping 0.50%. This sets up the region’s markets for a negative start, and with both Japan and China still on holiday, trading is likely to be muted ahead of tonight’s US Non-Farm Payroll data, with the street looking for a job rise of 185,000.
Regionally, traders will mostly be focused on oil and gold today as both were cremated overnight – oil fell more than 3% while gold hit four-month lows.
Currencies
The US dollar closed higher at the end of New York, supported by higher US Treasury yields. This didn’t tell the entire story, however, with the British Pound (GBP) racing up to 1.3080, as the Bank of England raised growth forecasts. With the Brexit elephant in the room, however, the GBP couldn’t hang onto its gains, falling 65 points back down to 1.3015. For now, 1.3000 appears to be Sterling’s sweet spot.
The Australian Dollar (AUD) is interesting this morning, having slipped quietly through the critical 0.7000 level overnight to 0.6990 this morning. A weekly close below 0.7000 would be a very negative technical development for the AUD.
Regional currencies will possibly feel the effects of a stronger greenback overnight and trade from the heavy side today.
Equities
With only Malaysia’s trade balance released on the data front this morning, Asia is unlikely to look past Wall Street’s performance overnight for initial direction. And with post-Fed position unwinding in full swing, Non-Farm Payrolls tonight and the upcoming weekend, traders in Asia could decide discretion is the better part of valour and lighten long equity positions as well.
Oil
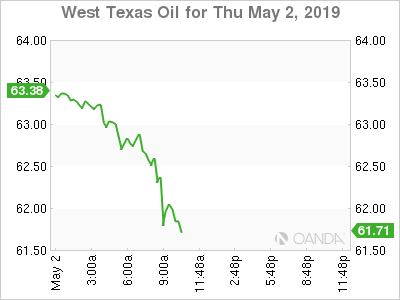
The massive increase in official US crude inventories was ignored by Wall Street on Wednesday but came back to haunt energy traders overnight. Brent Crude fell 2.30% to USD70.50 a barrel and WTI fell a whopping 3.10% to USD61.60 a barrel.
I suspect the sell-off has much more to do with short-term positioning than a structural change in the supply-and-demand dynamics of the global market. Brent Crude has maintained its important USD70.00 technical support, with the charts suggesting a drop to USD68.00 if it breaks. WTI’s technical picture looks rather more cloudy. Having broken major support at USD62.50, the chart picture implies a move lower still to USD60.00 per barrel, with a failure of that level setting up a much deeper correction.
Gold
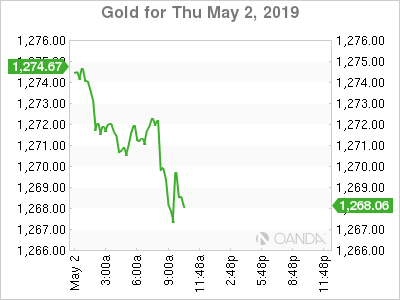
Gold is as unloved as a Venezuelan bolívar at the moment, dropping like a stone from USD1,277.00 an ounce to USD1,266.00 before dead-cat bouncing to USD1,271.00. Higher US bond yields and a stronger dollar were the culprits, sapping reasons to remain long precious metals.
The overnight lows around USD1,266.00 an ounce are also, coincidentally, an important technical support level. A weekly close below this level would not bode well for gold’s technical picture into next week.
EURGBP Retains Its Bear Pressure Nearer Term
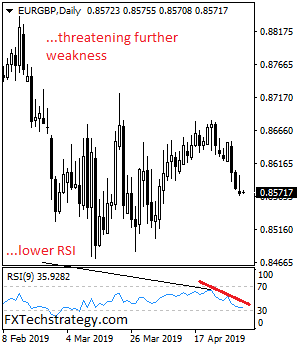
EURGBP retains its bear pressure nearer term as it looks to extend downside pressure. On the downside, support stands at the 0.8550 level where a violation will turn focus to the 0.8500 level. A break below here will aim at the 0.8450 level. Its daily RSI is bearish and pointing lower suggesting further weakness. Conversely, resistance lies at the 0.8650 level. A violation if seen will turn risk towards the 0.8700 level. Further up, resistance comes in at 0.8750 level followed by the 0.8800 level. All in all, EURGBP retains its bear pressure nearer term as it looks for more decline.
Eco Data 5/3/19
[php_everywhere instance="1"]
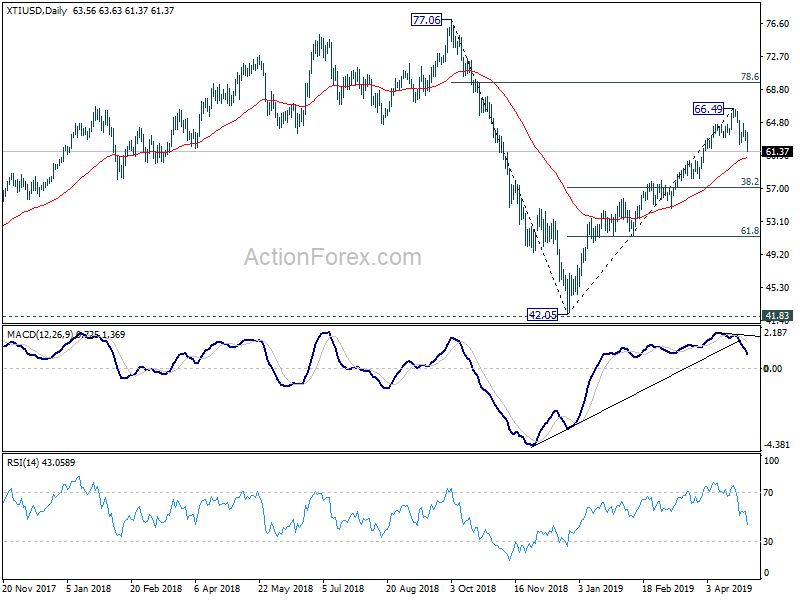
WTI crude oil resumes corrective decline from 66.49, targeting 55 day EMA at 60.67
WTI crude oil's corrective decline from 66.49 resumes today and reaches as low as 61.38 so far. Such decline is on track to first line of defense at 55 day EMA (now at 60.67). Decisive break there will confirm that fall from 66.49 is correcting whole rise from 42.05. WTI should then target 38.2% retracement of 42.05 to 66.49 at 57.15. We'd expect strong support from there to contain downside and bring rebound.
Meanwhile, strong support and rebound from 55 day EMA could bring another rise through 66.49 before forming a medium term top.
Gold ready to resume near term down trend for 1258 Fibonacci projection
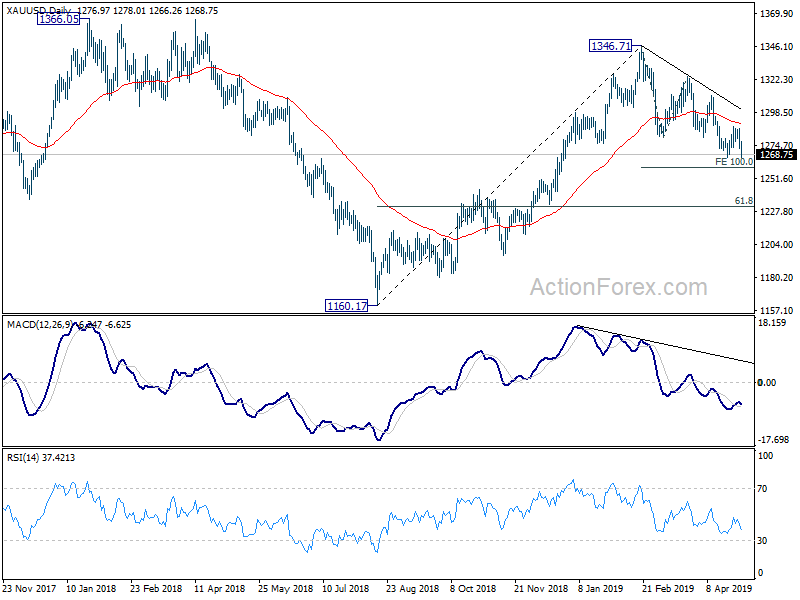
Gold drops sharply to as low as 1266.26 so far today and breached 1266.30 support. The development is inline with our bearish view noted before. Whole decline from 1346.71 is still in progress and should now be resuming. Sustained trading below 1266.30 will target 100% projection of 1346.71 to 1280.85 from 1324.49 at 1258.63. For now, near term outlook will remain bearish in any case as long as 1288.67 resistance holds.
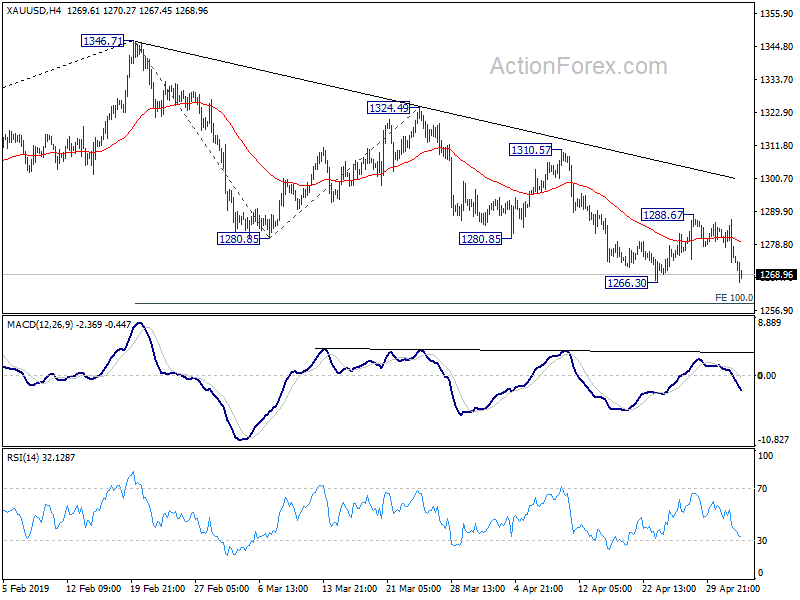
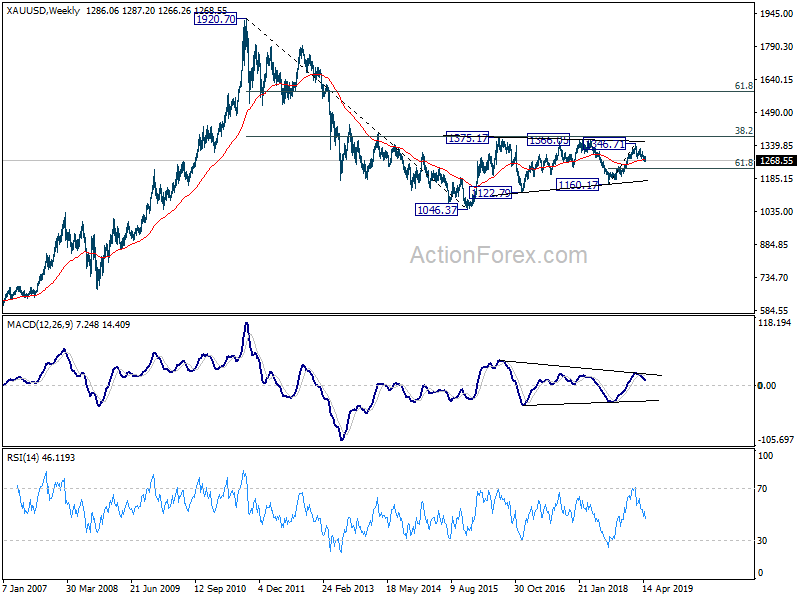
Looking at the bigger picture, decisive break of 1258.63 will indicate downside acceleration and solidify the case of medium term reversal. That is, rise from 1160.17 has completed at 1346.71 after being rejected below key fibonacci level of 38.2% retracement of 1920.70 to 1046.37 at 1380.36 again. Further fall should be seen to 61.8% retracement of 1160.17 to 1346.17 at 1234.42 and below.
Oil Price Outlook: Hitting the Sweet Spot
Highlights
- Oil prices have staged a steady recovery since the start of the year, rising by more than 50% from their December lows.
- While a good part of the comeback can be traced to broad improvement in risk sentiment, a tightening in the supply-demand balance for crude suggests that recent price levels are sustainable.
- The outlook for oil demand is mixed. Demand growth has recently been weakening, especially in OECD countries. Still, fears of a protracted global slowdown have moderated and expectations for 2019 are pointing to improving growth.
- Supply-side factors, however, are taking center stage. OPEC+'s compliance in implementing a 1.2 million bpd cut and involuntary reductions in other countries have been the key driver in supporting a return to a somewhat more balanced market.
- OPEC spare capacity, together with the persistent rise of U.S. shale production and its relatively low break-even costs will serve to put a ceiling on any meaningful price acceleration from here.
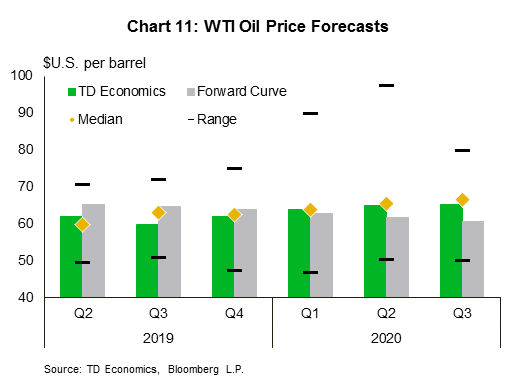
- Accordingly, our price outlook for WTI remains that of a relatively flat, range-bound profile between US$60 to US$65 throughout the next two years. With respect to Canadian benchmarks, all signs point to a widening of the WTI-WCS differential in the medium term.
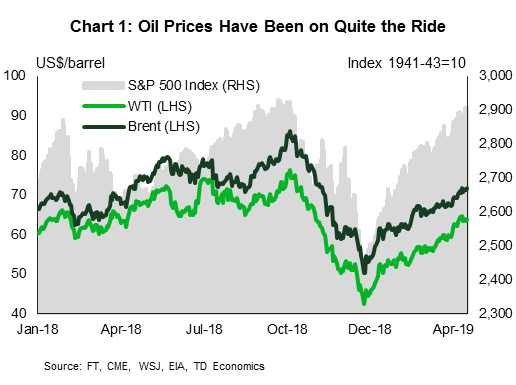
Global oil prices have been on a wild ride over the past year. After peaking at a four-year high of US$76 last October, the price of West Texas Intermediate (WTI) tumbled more than 40% at the end of 2018 (Chart 1). Since then, prices have staged an impressive comeback, with WTI returning back to the US$66 level. The rally coincided with improving risk sentiment as well as reduced recession risks and expectations of stabilizing demand. Still, a more important influence has been on the supply side, where cuts by OPEC+ have effectively eliminated a sizeable production surplus in the global oil market. Indeed, total world crude oil supply is now estimated to be around 2.5 to 3.1 million bpd below its peak in November 1.
With prices now running generally in line with fundamentals, we expect that WTI and other global benchmarks are likely to trade side-ways over the next few quarters. In our view, any move above the top end of the US$60 to US$65 range is likely to prove short-lived. In such a scenario, we would expect supply to enter the market rather quickly. The outlook for Canadian oil benchmarks is slightly less favourable, with the discount on the WCS benchmark expected to widen going forward (see Box 1). This forecast reflects longstanding transportation issues, the fading impact of the curtailment plan, and the recent drop in crude-by-rail shipments.
Box 1: Update on Canadian Oil Benchmarks
Canadian oil spreads have narrowed remarkably since the Alberta government announced a plan to curtail production last December. Since then, prices have comfortably followed the rally in global benchmarks, with the WTI-WCS spread stable and averaging an unusually narrow US$10 since the start of the year. The curtailment plan is intended as a temporary solution to a supply glut problem that sent discounts to record levels last fall, including on lighter oil variations and synthetic crude. Starting in February, production limits have been gradually eased as a response by the government to improving prices and inventory reductions at the time.
Still, we doubt that this low discount can be sustained in the near and medium term amid still-high inventories and a recent collapse in crude-by-rail shipments. Media reports and announcements by some producers have suggested that the recent spread levels (around US$10) are too low to justify the marginal cost of crude-by-rail shipments (at around US$15-US$20 range). This recent drop in energy export volumes2 and crude-by-rail shipments will likely slow down the inventory draws in the near term, thus adding further uncertainty (Chart 2). Indeed, the discount has widened (albeit only slightly) in the past two weeks, now sitting closer to US$12.5.
Longer term, demand side drivers for Canadian heavy oil remain relatively strong, with a large proportion of U.S. refineries configured for heavy oil as feedstock. Given that U.S. production is primarily of a lighter variant (WTI) and that alternative heavy oil sources are lacking and/or declining, this should maintain stable demand for Canadian heavy oil in the foreseeable future.
A lack of pipeline capacity remains a key longer-term barrier to Canadian heavy oil prices. A recent delay to Line 3, initially relied on to start operations by the end of 2019, has added to the uncertainty – with the pipeline now expected to be completed in the second half of 2020. At the same time, there has been minimal progress on the TransMountain (TMX) and Keystone XL pipelines from a regulatory perspective. A Federal decision on TMX is expected (albeit not guaranteed) in June. Other factors contributing to forthcoming uncertainty include the potential cancellation of additional rail capacity planned by the previous Alberta government, which would erase around 120K of planned transportation capacity, and the International Maritime Organization regulations on sulphur caps coming into effect next year (IMO 2020).
On the whole, we believe that the current discount on Canadian heavy oil is likely too low, and continue to expect that it will widen again to levels near US$15-US$20 range by year-end. This forecast reflects the fading impact of the Alberta curtailment plan (and the easing in production limits), the potential impact of the recent drop in crude-by-rail shipments and export volumes on inventories, and the lack of progress on transportation and pipeline capacity. With pipeline delays still on the horizon and with the production curtailment plan winding down, crude-by-rail continues to be the marginal option for transportation, justifying a discount in the aforementioned range.
Risk sentiment has improved since late 2018
Heading into last summer, market participants were feeling quite optimistic about oil prices. By October, the price for a barrel of WTI and Brent oil had risen around US$16 and US$20 dollars from the outset of the year, respectively. But with the start of autumn came an abrupt change of scenery. In a matter of 12 weeks, WTI fell from a high of US$76 to a trough of US$42, catching market participants and producers by surprise. Much of this change coincided with sudden souring in the global economic outlook and risk appetite.
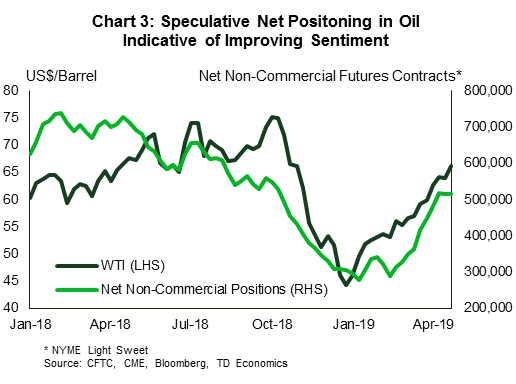
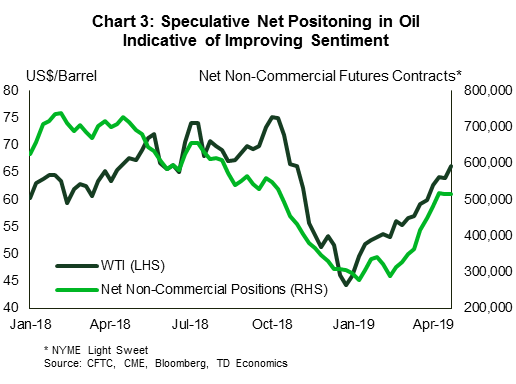
Since December, risk sentiment has notably improved, and was matched by a similar movement in oil markets. For instance, net non-commercial positions in oil futures (used as a proxy for speculative positions) have bounced back sharply, though not reaching the peak levels posted during last year's price run-up (Chart 3). While the timing of WTI's drop and consequent rebound has been identical to that of other major risk assets (including the S&P 500 Index as shown in Chart 1) the magnitude of the swing has been relatively pronounced.
Underlying the broad tailwind to prices from the 'risk-on' behavior so far this year has been a steady tightening in the crude supply-demand balance. In the second half of 2018, daily world production was exceeding consumption by as much as 2.5 million barrels per day, pushing up global inventories sharply. The excess daily output has been swiftly addressed since the start of the year.
Demand expectations are mixed, but stabilizing
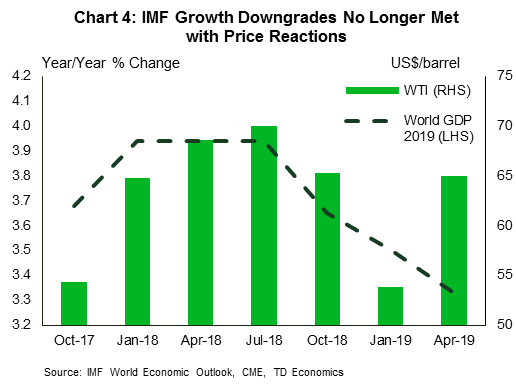
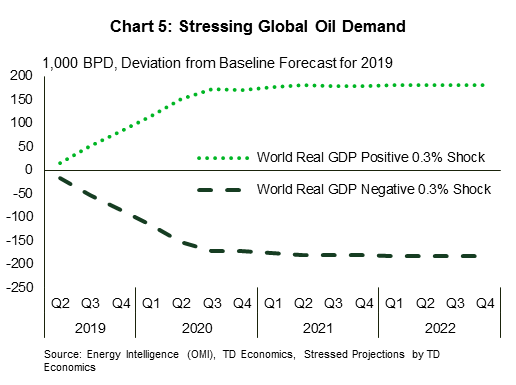
With the increased global uncertainty last year came both a significant lowering in near-term global GDP growth and oil consumption projections. The IMF's recent World Economic Outlook placed world growth at 3.3% in 2019 (Chart 4). This is a further downgrade from October (3.7%), and equates to over US$300 billion removed from global GDP. Our sensitivity analysis suggests that a 0.3 ppt shock to global GDP growth results in around a 200K bpd drop in global oil demand (Chart 5).
On the plus side, recent data, such as that for global business sentiment surveys, have started to turn the corner. A pause in rate hikes and a dovish tilt by major central banks has been supportive for growth expectations going forward. In addition, renewed Chinese stimulus and infrastructure spending is expected to support improved sentiment in 2019. At the same time, worries around an escalating China-US trade war have dissipated and so too have fears of a looming recession. This bodes well for a firming in oil consumption later this year.
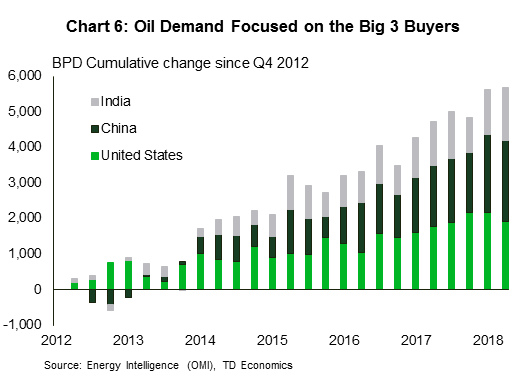
Drilling down on demand by country reveals that China, India, and the U.S., are driving a significant chunk of the growth in demand in the last few years (Chart 6). For these countries, consumer and manufacturing-related growth is still holding relatively strong. It is demand from advanced economies (ex-U.S.) that is at risk, including Japan, South Korea, and European countries. This coincides with IMF's forecast, which cut growth expectations the most in advanced economies.
Putting the demand picture together, growth forecasts (y/y) are ranging from 1.2 to 1.4 million bpd in 2019 as a whole3. We expect that growth in 2019 will be at the lower end of this range, given our relatively conservative 3.2% global growth forecast. Stabilizing global GDP growth should be enough to at least keep demand stable over the near-term forecast horizon and prevent it from slipping significantly below this range.
Supply-side factors are doing the heavy lifting
The more prominent factor behind oil's fundamental turnaround is the supply side. Total world supply has fallen by more than 2.5 million bpd since its peak in November – mostly due to planned and unplanned OPEC+ cuts. OPEC+, led by Saudi Arabia, has reduced output even more than its 1.2 million bpd commitment at its December meeting in Vienna. Compliance for most producers in OPEC+ has been running well above 100%4. Saudi Arabia's output alone has dropped more than 1 million bpd, with further drops in most OPEC+ countries. Unplanned and involuntary drops also brought some supply off the market due to the ongoing crisis in Venezuela (more than 400K bpd). In Canada, the mandated government curtailment plan in Alberta, which is home to the oilsands, has seen raw crude oil and bitumen production drop on average of -275K bpd in Q15 (see Box 1 for a detailed analysis on this).
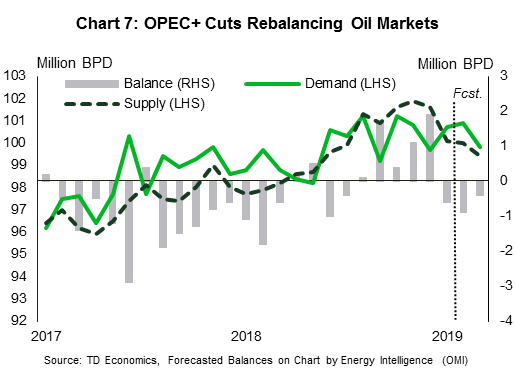
The return to deficit territory (Chart 7) of the daily global supply-demand position has removed a key roadblock depressing oil prices. Inventories have been slow to respond, given their elevated starting point6 and the glut formed by the end of 2018. However, signs of tightening and stabilization are starting to emerge. For instance, OECD inventories have reduced (albeit slowly), and are are now narrowing in on their five-year average.
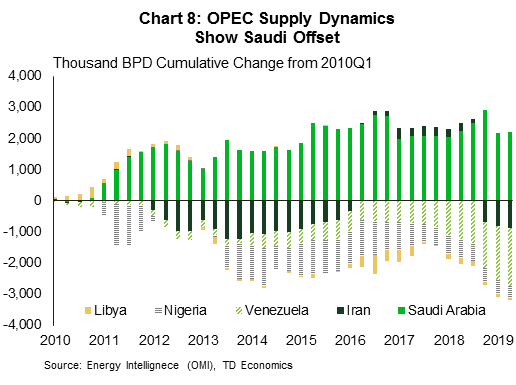
A recent development, whereby the U.S. fully eliminated all waivers on sanctioned Iranian oil is expected to further deepen the deficit in the near-term. Still, any such upward impact on prices and balances should not linger for long, especially with OPEC's spare capacity now at upwards of 3 million barrels per day7 and with U.S. shale production being relatively elastic. Historically, OPEC has offset unexpected reductions in global oil supply (Chart 8). With the recent elimination of Iranian waivers, we expect that OPEC+ will gradually reverse some of the recent cuts over the second half of the year, following its June meeting.
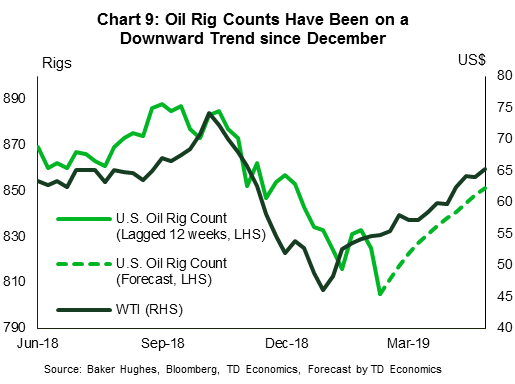
On the flip side, U.S. shale production is likely to continue to grow. Average annual production was more than 500K bpd higher than initial estimates in 2018. The EIA forecasts production will increase by around 1.4 million bpd in 2019 and another 0.7 million bpd in 20208. The comparable rate posted in 2018 was 1.6 million bpd. This would result in a significant supply build, though a lesser one than that which occurred in 2018. This slowdown in production growth is consistent with the number of oil rigs in operation. Here we have seen a modest decline since the autumn 2018 price slump (Chart 9). Rig counts remain well below their elevated pre-2014 investment surge levels. It is important to note that the elasticity of shale output to price changes is relatively high, and rig counts will likely be quick to respond to any expectation of sustained price increases.
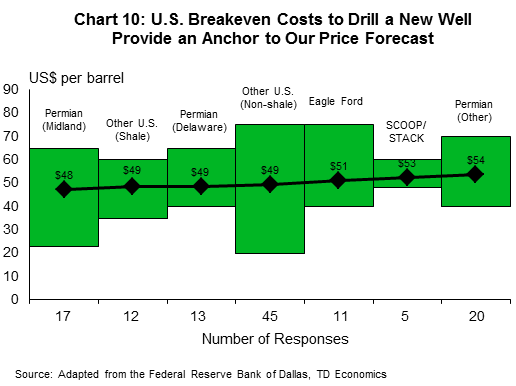
Results from the quarterly Dallas Federal Reserve Bank Energy Survey suggest that the breakeven price to profitably drill a new well sits in the US$48-US$54 range (Chart 10), with an average of US$50. Indeed, rig counts declined in the fall of 2018 as prices dropped below that range. Of course, U.S. shale is not the sole determinant of prices, but with relatively low breakeven levels, it is now assumed to be a significant force in keeping prices range-bound. This marginal cost to drill a new well in U.S. shale provides an anchor to our price forecast.
Price outlook
In sum, the crude oil market appears to be in a sweet spot with oil prices improving closer to their longer-term fundamental level, output growing in line with consumption, and stockpiles on track to be worked off towards historical norms. As such, our base case assumes that WTI prices will trend in the US$60-US$65 (Chart 11) range within the next two years. This range also implies that oil prices will continue to trade at a premium to the marginal cost of new U.S. shale production. Our base case relies on near-term global growth expectations holding firm at around 3.2% and that OPEC+ maintains some of the cuts put in place last December in the coming months in order to keep the supply-demand fundamentals in balance.
Upside risks to the forecast are mostly centered on wildcards, namely supply disruptions and geopolitical factors. This includes further drops in Venezuelan output, disruptions in Libya and Nigeria, or a larger than expected impact of Iranian sanctions on the crude market, which could force the risk premium implied in the price of oil higher. On the downside, the most notable risk is a deeper than projected slowdown in global growth as well as a renewed wave of pessimism in global financial markets.
End Notes
- Based on data from Energy Intelligence Group (OMI) and the International Energy Agency's April Oil Market Report.
- Statistics Canada mentions that the late reporting of crude oil transactions means that statistics on this data must be estimated in the current month's (February's) release. See: https://www150.statcan.gc.ca/n1/daily-quotidien/190417/dq190417b-eng.htm
- This is based on the most recent forecasts from: IEA, EIA, OPEC, and Energy Intelligence Group (OMI).
- Based on data from the IEA and Energy Intelligence Group (OMI).
- See: https://www.alberta.ca/oil-production-limit.aspx
- Caused by elevated output levels by the world's three largest producers (Russia, Saudi Arabia, U.S.) combined with reduced demand growth at the time.
- Based on data from the IEA's April Oil Market Report. See: https://www.iea.org/media/omrreports/fullissues/2019-04-11.pdf
- Based on the latest EIA Short Term Outlook Report. See: https://www.eia.gov/outlooks/steo/
Post-FOMC Hangover
Markets may have a post-FOMC hangover. The Fed stuck to the patient script but inflation optimism took rate cut bets in the short-term off the table. The dollar has little to show this morning, while stocks are pointing to a mixed open.
- US Data – Labor market remains robust
- FOMC – Still patient… adds transitory factors at work
- BOE – More than one hike needed for inflation target
- Stocks – S&P slight rebound after biggest selloff in 5 weeks
- Oil – Lower on stockpiles surge and Maduro still controls military
- Gold – Dovish induced Fed rally may stall
US Data
Jobless Claims came in higher than expected but that may be attributed to the Easter holiday and spring break. Data around those dates are typically volatile and do not raise any alarm that the labor market is losing momentum. Yesterday’s ADP employment report surprise of 275,000 new jobs showed the slow start of the year did not impact hiring. Expectations are for tomorrow’s nonfarm payroll report to see a gain of 190,000 jobs, the range is 120,000 to 250,000 jobs.
The nonfarm productivity reading for the first quarter grew at the fastest pace since 2014. The unit labor costs also declined 0.9%, down from the revised higher prior of 2.5%. Increases productivity could mean the economy can grow further without triggering a surge with inflation.
FOMC
The Fed is likely to remain patient throughout the summer and contrary to what Fed Fund futures are saying, they see transitory factors at work on inflation and that it will pick up later in the year. Short-term interest rate futures fell after yesterday’s meeting and they now see a 29% chance of a cut at the September and a coin flip for the December meeting.
The financial services and apparel prices have kept Core PCE lower and those are the transitory factors Powell are most likely what Powell was referencing. Inflation will be closely watched and even if we see another weak reading next Friday, we may not see too much of jump on rate cut bets.
BOE
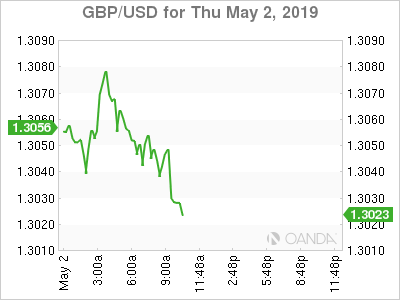
The British pound whipsawed after the BOE was nowhere as hawkish as market participants expected. The Bank kept rates steady in a unanimous vote, but many were expecting Saunders to dissent. Cable spiked higher on the headline that the BOE signals more than one hike needed to keep inflation in check. The BOE quarterly inflation report (QIR) saw cuts to the inflation outlook and raises to the growth forecasts. Expectations now see a 65% chance for a hike at the November meeting.
Stocks
Earnings results are still coming with roughly 70% of the S&P 500 companies already reporting. This morning we saw results from Fluor and Cigna. Fluor reported poor results as revenue came well below expectations and their CEO stepped down. Healthcare giant, Cigna reported roughly in-line EPS and raised their forecast.
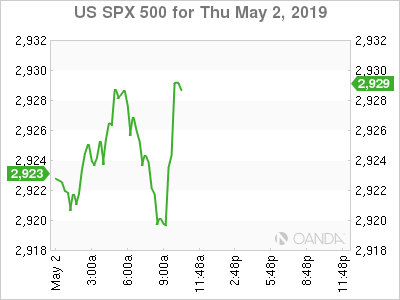
Much of Wall Street remains optimistic in the short-term. JP Morgan in a note advised their clients not to bail on the market. RBC thinks the S&P 500 could overshoot 2950 in the short-term. While Morgan Stanley thinks a rally to 3,000 would trigger a sell signal. Canacord Genuity thinks we could see near-term losses capped at 5%.
Oil
Crude prices continue to selloff as expectations grow for OPEC + to abandon to their production cut pledge. The first half of the week saw oil lower mainly on the rising stockpiles from the US. The US government data saw inventories jump to almost 10 million barrels last week, almost four times what analysts were expecting. Reportedly Saudi Aramco received request from Asian buyers for additional oil supplies in June and July. It is unclear if this on top of what was needed to makeup for the shortfall from the lifting of waivers on Iranian sanctions.
It appears the Venezuelan story is slowly making its way to the back pages. The immediate tension seems to have been alleviated, but that story will not be going away anytime soon. Venezuela, which holds the world’s biggest cruder reserves is likely to see continued protests that are led by opposition leader Juan Guaido.
Gold
The precious metal continues to weaken post FOMC and is dangerously approaching support levels that may not be able to withstand the optimism that will come from a trade deal between China and the US. While central banks have ramped up purchases at the fastest pace in six years, that may not be enough of a catalyst if we continue to see stronger data out of Europe and a trade induced rebound.
Sunset Market Commentary
Markets
Global core bonds are mixed today with US Treasuries underperforming German Bunds. As EU markets were closed yesterday, German Bunds jumped (modestly) lower overnight in a catch-up move following modest losses in US Treasuries, as the Fed sounded less dovish than expected at yesterday’s policy meeting. Asian equities performed mixed, but European bourses tracked late WS weakness and opened with losses. German Bunds recovered from opening losses, cautiously moving higher throughout the day. The German yield curve is moving little lower with losses not bigger than -0.5 bps (10-yr). US Treasuries stabilized from yesterday’s air pocket, but initially held on to a downward bias. Part of intraday losses were paired ahead of the US eco data. Weekly jobless claims printed little below expectations but stable from last week and had little impact on trading, while the Q1 nonfarm productivity measure outperformed expectations. At the time of writing, the US yield curve is edging higher with changes in the range of +1.6 bps (30-yr) to +2.2 bps (2-yr). Peripheral spreads over the German 10-yr yield are tightening with Spain (-3 bps) outperforming as it profits from a stronger-than-expected April Manufacturing PMI (51.8 vs. 50.9 in March).
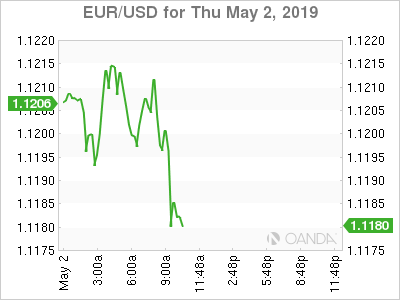
EUR/USD settled in a tight sideways range today near the 1.12 big figure. Dollar yesterday regained modest ground as Fed Chair Powell maintained neutral guidance on future policy even as inflation drifted below the 2% target of late. Today, eco data (in EMU and the US) mostly were second tier and provided no clear guidance for euro nor USD trading. Investors are looking forward to tomorrow’s US payrolls report and non-manufacturing ISM before engaging in new directional USD positions. EUR/USD currently trades in the 1.1185 area. USD/JPY is changing hands in the 111.50 area.
The focus for sterling trading shifted today, at least temporary, from Brexit to monetary policy as the BoE announced its policy decision and published a new quarterly inflation report. Evidently, the BoE assessment on growth and inflation remains highly conditional on the outcome of Brexit. Q1 growth is estimated at a strong 0.5% Q/Q. However, part of this growth is due to inventory build-up related to Brexit and will probably be reversed in the second quarter. Even so, the BoE indicated that underlying growth is probably a little stronger than what was anticipated in the February inflation report. As demand growth is expected to exceed supply growth, the BoE expects that it will have to raise rates more than what is discounted in current market curve to bring inflation back to 2% at the end of the policy horizon. However, any monetary tightening will take place at a gradual pace and to a limited extend. In theory, this assessment could have been sterling supportive as most other major central banks have a neutral or even an easing bias on monetary policy. However, the fact that the MPC voted unanimously to leave the policy rate unchanged suggests that sterling won’t get any interest rate supported in the near future. EUR/GBP showed no clear trend and hovered in the high 0.85 area. Cable is going nowhere in the mid 1.30 area..
News Headlines
The Czech National Bank increased rates from 1.75% to 2% today as the Czech currency is persistently trading weaker than the bank’s own projections and inflation is running further away from its 2% target (3% in March). Governor Rusnok however said the next move could be a cut should the economic environment deteriorate. The Czech koruna lost ground after the policy decision.
Scandinavian PMI business confidence slipped hard in April. The indicator fell from a lofty 56.3 to a still solid 53.8 in Norway but printed at a poor 50.9 (down from 52.5) in Sweden. Markets were expecting a slight uptick from last month. The Swedish krona manages to hold ground but it’s Norwegian counterpart is losing territory as oil is feeling some selling pressure.
DAX Edges Higher Despite Soft German Manufacturing PMI
The DAX index has posted gains in the Thursday session. Currently, the DAX is at 12,363, up 0.16% on the day. In economic news, German and eurozone manufacturing PMIs were within expectations, with readings of 44.4 and 47.9, respectively. German retail sales declined by 0.2%, better than the estimate of -0.5%. On Friday, the eurozone releases CPI Flash Estimate.
Manufacturing remains a sore spot in Germany and the rest of the eurozone, as underscored by the April manufacturing PMIs. The indicators continue to point to contraction in the manufacturing sector, although there was some slight improvement in April, compared to the March scores. Weaker global demand and taken a heavy toll on exports from Germany and the eurozone, which has damaged the manufacturing sectors. German retail sales declined in March, as nervous consumers held tight to their purse strings.
The Federal Reserve remained on the sidelines and maintained the benchmark rate at a range between 2.25% and 2.50%. As this had been priced in by the markets, investors were more interested in the tone of the rate statement. The statement noted that inflation pressures are muted and that the FOMC would remain patient regarding future rate movements. Jerome Powell reinforced this stance at a follow-up press conference, saying “we don’t see a strong case for moving in either direction”. The Fed is already on record as saying it does not expect to raise rates before 2020, and with inflation levels persistently below the Fed’s target of 2.0%, the Fed can afford to continue its wait-and-see stance.