Sample Category Title
Gold: Yellow Metal Reverses Its Gains In The Morning Session
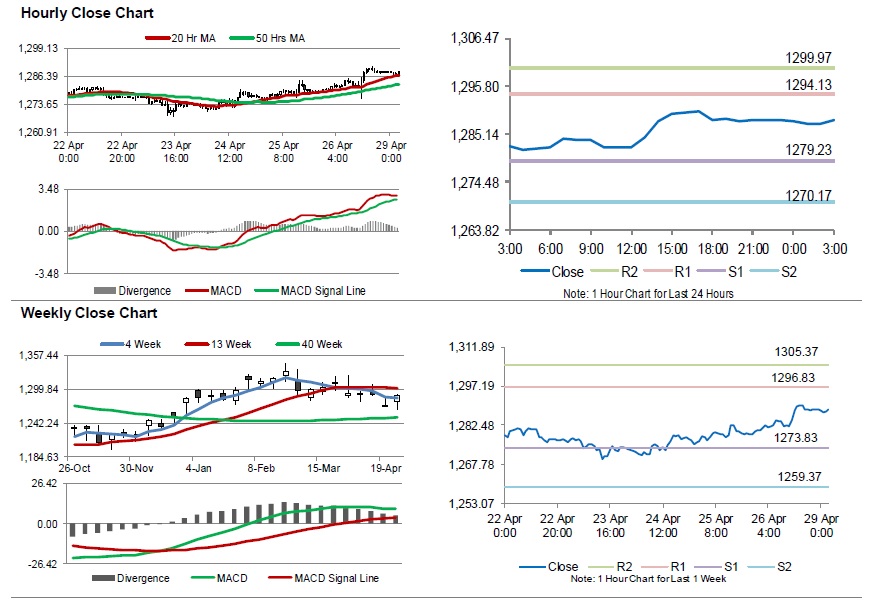
For the 24 hours to 23:00 GMT, Gold rose 0.64% against the USD and closed at USD1288.60 per ounce on Friday, amid broad weakness in the US dollar.
In the Asian session, at GMT0300, the pair is trading at 1288.30, with gold trading slightly lower against the USD from Friday’s close.
The pair is expected to find support at 1279.23, and a fall through could take it to the next support level of 1270.17. The pair is expected to find its first resistance at 1294.13, and a rise through could take it to the next resistance level of 1299.97.
The yellow metal is showing convergence with its 20 Hr moving average and trading above its 50 Hr moving average.
Silver: White Metal Trading Flat This Morning
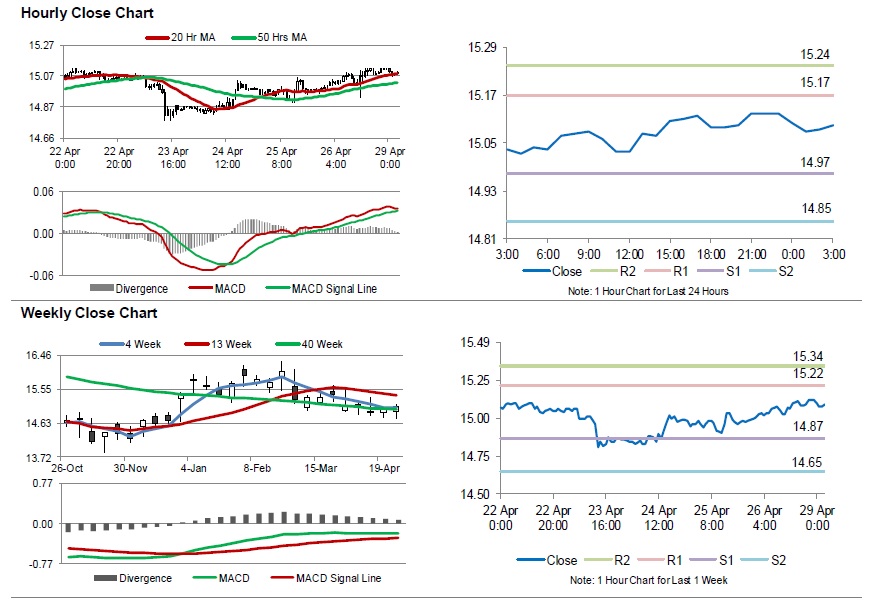
For the 24 hours to 23:00 GMT, Silver rose 0.67% against the USD and closed at USD15.09 per ounce on Friday, tracking gains in gold prices.
In the Asian session, at GMT0300, the pair is trading at 15.09, with silver trading flat against the USD from Friday’s close.
The pair is expected to find support at 14.97, and a fall through could take it to the next support level of 14.85. The pair is expected to find its first resistance at 15.17, and a rise through could take it to the next resistance level of 15.24.
The white metal is showing convergence with its 20 Hr moving average and trading above its 50 Hr moving average.
Crude Oil: Oil Reverses Its Losses In The Asian Session
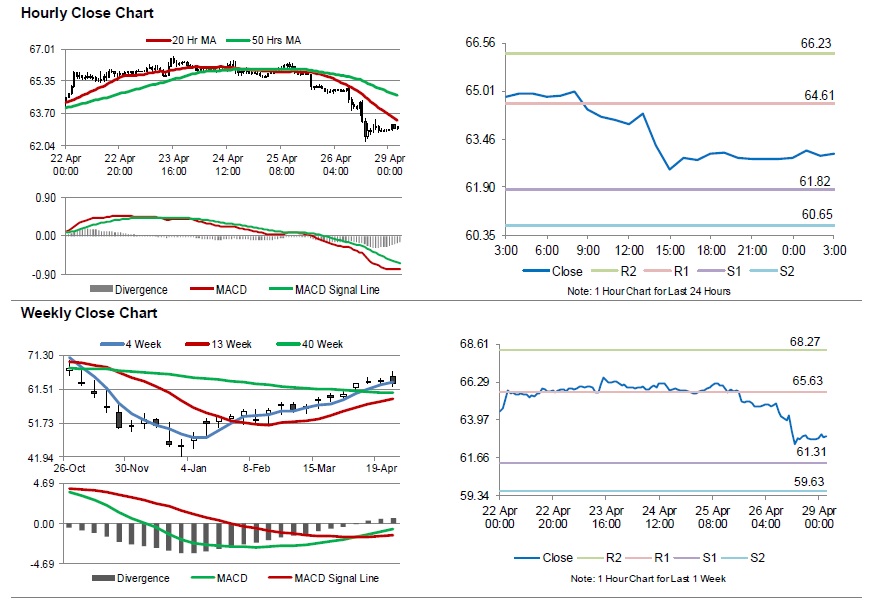
For the 24 hours to 23:00 GMT, Crude Oil declined 3.34% against the USD and closed at USD62.83 per barrel on Friday, after the US President Donald Trump continued to pressure the OPEC to increase oil production in order to lower prices.
Meanwhile, fresh figures from Baker Hughes disclosed that the number of active oil rigs fell by 20 to 805 in the week ended 26 April 2019, declining by the most since January 2018.
In the Asian session, at GMT0300, the pair is trading at 62.98, with oil trading 0.24% higher against the USD from Friday’s close.
The pair is expected to find support at 61.82, and a fall through could take it to the next support level of 60.65. The pair is expected to find its first resistance at 64.61, and a rise through could take it to the next resistance level of 66.23.
Crude oil is trading below its 20 Hr and 50 Hr moving averages.
GBP/USD Recovering While USD/CAD Correcting Lower
GBP/USD declined close to 1.2860 and recently started an upside correction. USD/CAD climbed towards the 1.3500 level and it is currently correcting lower.
Important Takeaways for GBP/USD and USD/CAD
- The British Pound declined heavily and tested the 1.2850-1.2860 support area.
- There is an ascending channel in place with support at 1.2910 on the hourly chart of GBP/USD.
- USD/CAD climbed higher sharply and traded above the 1.3400 and 1.3450 resistances.
- The pair is correcting lower and recently broke a key bullish trend line with support at 1.3475 on the hourly chart.
GBP/USD Technical Analysis
The British Pound remained in a bearish zone and declined sharply from the 1.3020 resistance against the US Dollar. The GBP/USD pair broke the 1.3000 and 1.2920 support levels to move into a bearish zone.
The decline was such that the pair even broke the 1.2900 level and the 50 hourly simple moving average. It traded close to the 1.2850 level and formed a swing low at 1.2867 on FXOpen.
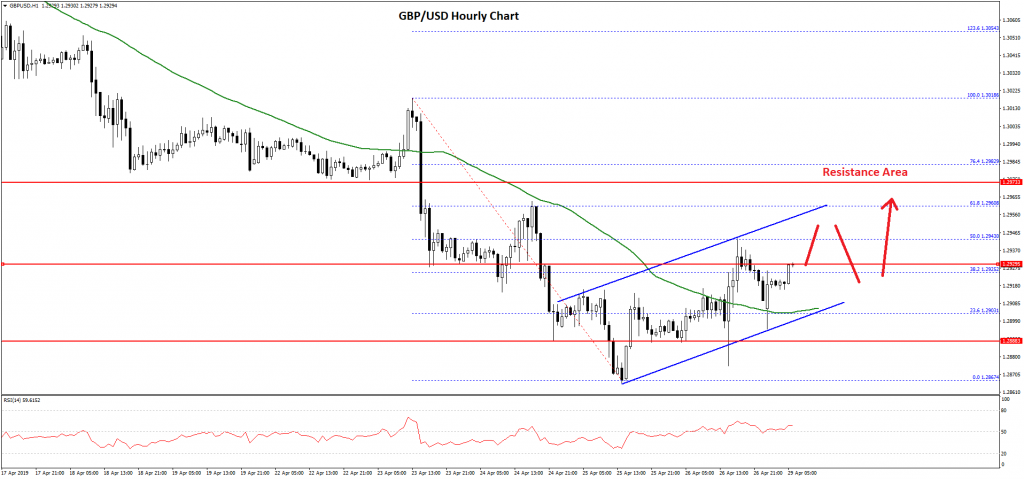
Recently, it started an upside correction above the 1.2900 level and the 50 hourly simple moving average. There was a break above the 38.2% Fib retracement level of the last decline from the 1.3018 high to 1.2867 low.
However, the upward move was capped by the 1.2940 level and the 50% Fib retracement level of the last decline from the 1.3018 high to 1.2867 low.
The pair retreated from highs and retest the 1.2900 zone and the 50 hourly SMA. At the outset, the pair is moving higher and is following an ascending channel with support at 1.2910 on the hourly chart.
On the upside, there is a strong resistance near the 1.2940 and 1.2950 levels. A successful close above the 1.2950 level may push the pair towards the 1.3000 and 1.3020 levels. On the downside, an immediate support is at 1.2920, followed by the channel support.
If GBP/USD settles below 1.2910 and 1.2900, it could start a fresh decline towards the 1.2860 and 1.2850 support levels in the near term.
USD/CAD Technical Analysis
The US Dollar started a strong upward move after forming a support base near 1.3300 against the Canadian Dollar. The USD/CAD pair climbed above the 1.3400 resistance level and gained bullish momentum.
The pair surged above the 1.3450 level and the 50 hourly simple moving average. It even spiked above the 1.3500 level and formed a high at 1.3521. Recently, it started a downside correction below the 1.3500 level and the 50 hourly simple moving average.
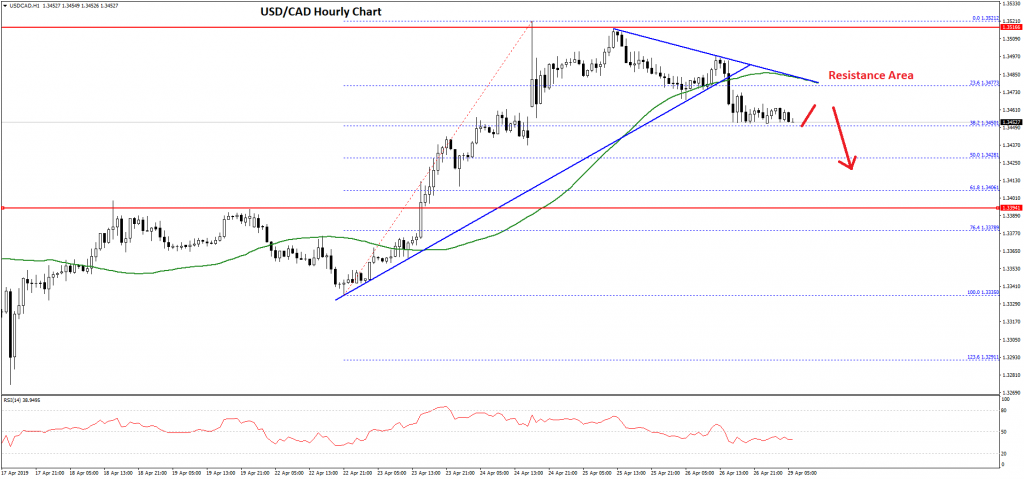
It even broke a key bullish trend line with support at 1.3475 on the hourly chart. The pair broke the 1.3460 level and tested the 38.2% Fib retracement level of the last wave from the 1.3335 low to 1.3521 high.
At the moment, the pair is consolidating above the 1.3450 level. If there is a downside break below the 1.3450 level, the pair could test the 1.3428 level or the 50% Fib retracement level of the last wave from the 1.3335 low to 1.3521 high.
Any further declines may push USD/CAD towards the 1.3400 support level. On the upside, an initial resistance is near the 1.3480 level, the 50 hourly SMA, and a connecting bearish trend line.
A successful close above 1.3480 is likely to start a fresh increase above the 1.3500 and 1.3510 levels in the coming sessions.
Canadian beef export to Japan tripled under CPTPP, Trump still discussing with Abe
Leaders of Canada and Japan hailed the success and benefits of the 11-country trade pact when they met in Ottawa on Sunday. Under the Comprehensive and Progressive Agreement for Trans-Pacific Partnership (CPTPP), Canadian Prime Minister Justin Trudeau said beef exports to Japan nearly tripled.
Trudeau added, the pact "has benefited tremendously Canadian citizens, Japanese citizens and businesses and indeed people throughout the region." And, that "stands in stark contrast with the United States withdrawal ... continuing to move forward on freer more open trade, according to the rules we can all agree on, is something we need more in the world."
Japanese Prime Minister Shinzo Abe also said the CPTPP "should be a model going forward," describing it as a meaningful way "to disseminate a 21st century type of free and fair rules-based (trade)."
Trump pulled out of the Trans-Pacific Partnership (TPP), the former version of CPTPP, as one of the first moves after taking office more two years ago. As of the meeting between Trump and Abe last Friday, the US and Japan are still working on a trade deal.
Trump said the deal "can go fairly quickly" and negotiations are "moving along very nicely and we'll see what happens". He also said "we'll be discussing very strongly agriculture because, as the prime minister knows, Japan puts very massive tariffs on our agriculture...and we want to get rid of those tariffs."
FOMC Preview -Fed to Reiterate Patience Rhetoric Despite Strong First Quarter Growth, Focus on Soft Inflation
Despite the pleasant surprise in the first quarter GDP growth, the Fed would still leave its policy rate unchanged at the upcoming meeting. The Fed funds rate target is expected to stay at 2.25-2.50%. Its forward guidance would stay unchanged, calling for patience in future monetary policy move. At the meeting, the key areas of interest include the members’ inflation outlook, the threshold for a rate cut, as well as more updates on the balance sheet policy.
GDP growth improved to +3.2% q/q (annualized) in 1Q19, from +2.2% in the prior quarter. The market has anticipated only a +2% growth. Despite the headline surprise, much of the expansion was driven by trade and inventory – two of the more volatile components. Excluding these two components, growth was about +2% in the first quarter. This is certainly not a weak figure. Yet, it is not enough to alter the Fed’s guidance. Household spending, taking up 70% of the country’s economy, contributed about +0.8 percentage point to growth.
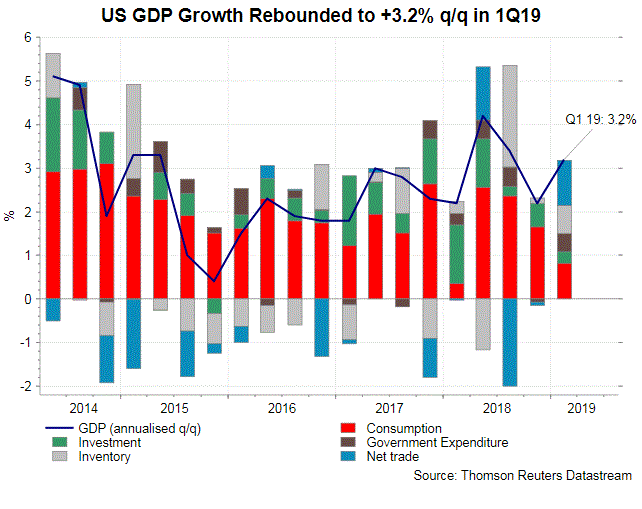
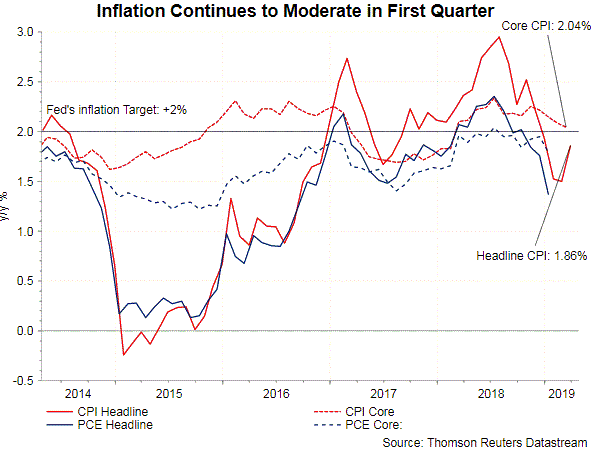
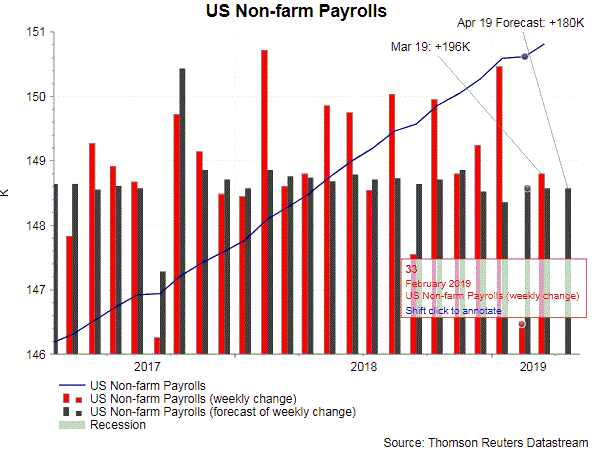
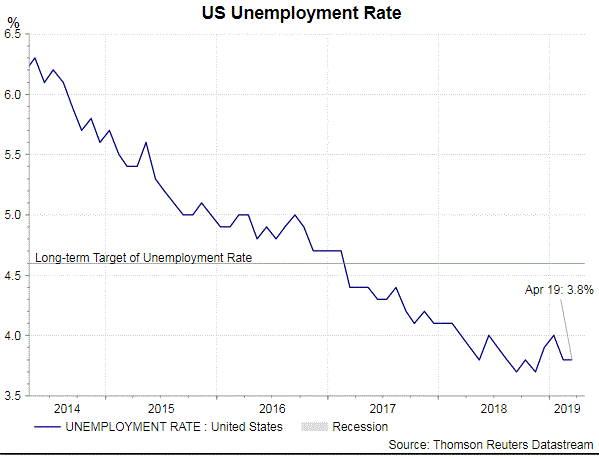
Inflation remains soft. Core PCE, Fed’s preferred guage, moderated to +1.3% y/y in 1Q19, from +1.9% in the previous quarter. This also came in weaker than consensus of +1.6%. The job market should remain resilient. Scheduled to release on Friday, nonfarm payrolls probably increased +180K in April, compared with +1.96K addition a month ago. The unemployment rate is expected to stay unchanged at 3.8%- a rate that this is far below FOMC’s long-term target of about 4.5%. Wage growth is expected to have gained slightly. The market forecast that average earnings have risen +3.3%y/y in April.
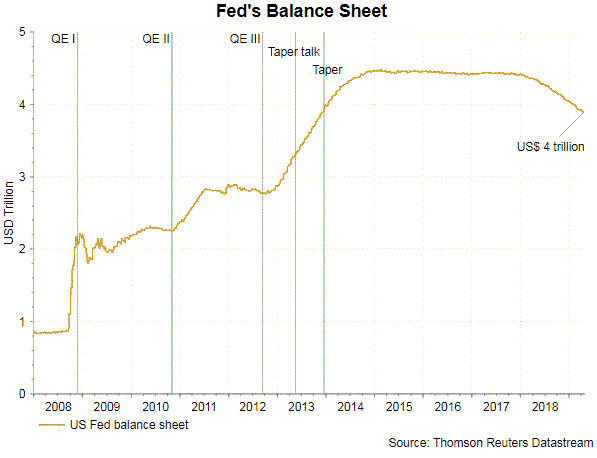
In March, the Fed announced material changes to the balance sheet reduction plan. From May to September, the Fed would cut the size of Treasury securities reduction by half, to US$15B/ month, while the size of mortgage-backed securities (MBS) reduction stays unchanged at US$ 20B/ month. From October onward, the Fed would stop reducing its Treasury position. Rather it would take up to US$20B/ month in maturing mortgage securities and roll them into Treasury debts. We expect the members to discuss more details including the long-run size and composition of the balance sheet.
While a rate cut is unlikely at the upcoming meeting, there have been discussions about the scenarios under which the Fed would consider reducing the policy rate. One of such is when inflation continues to falter while economic growth remains firm. We expect related questions at the press conference.
EUR/USD Rebound Could Be Capped, US GDP Impresses
Key Highlights
- The Euro declined to a new monthly low at 1.1110 and later recovered against the US Dollar.
- A crucial bearish trend line is in place with resistance at 1.1190 on the 4-hours chart of EUR/USD.
- The US GDP in Q1 2019 (Prelim) increased 3.2%, more than the 2.0% forecast.
- The Euro Zone Business Climate Index in April 2019 could decline from 0.53 to 0.50.
EURUSD Technical Analysis
The Euro remained in a bearish zone below the 1.1250 support against the US Dollar. The EUR/USD pair declined below 1.1150 and traded to a new monthly low at 1.1110 before starting an upside correction.
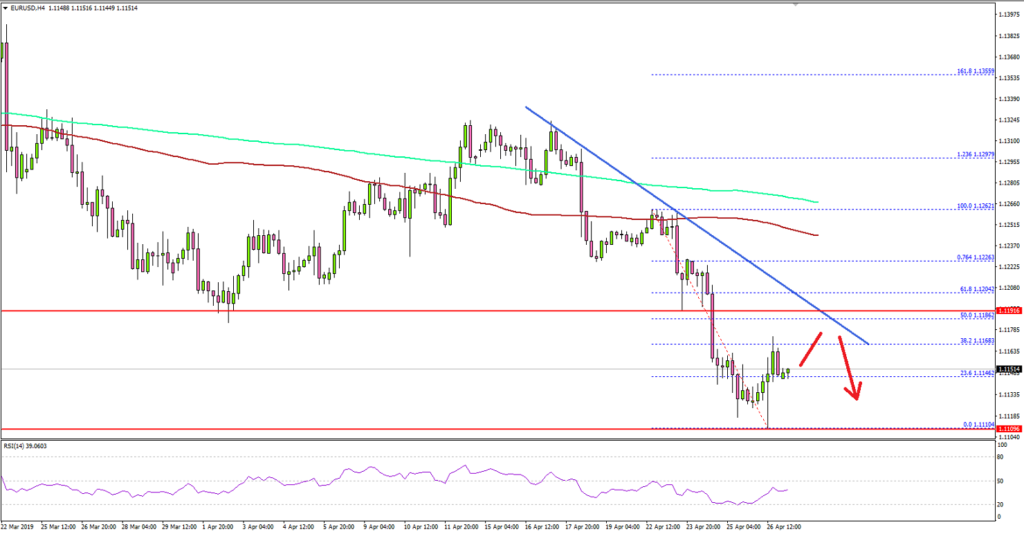
Looking at the 4-hours chart, the pair rebounded above the 1.1120 level and the 23.6% Fib retracement level of the last decline from the 1.1262 high to 1.1110 low. The pair even surpassed the 1.1150 level, but there are many hurdles on the upside.
The previous key supports near 1.1180 and 1.1200 are likely to act as strong resistances. Moreover, there is a crucial bearish trend line in place with resistance at 1.1190 on the same chart.
Besides, the 50% Fib retracement level of the last decline from the 1.1262 high to 1.1110 low is near the 1.1186 level. Therefore, the pair is likely to face a significant resistance near the 1.1180-1.1200 area.
On the downside, an initial support is near the 1.1120 level, below which the price could test the 1.1100 and 1.1080 support levels.
Fundamentally, the US Gross Domestic Product Annualized reading for Q1 2019 (Prelim) was released by the US Bureau of Economic Analysis. The market was looking for growth rate of 2.0% in Q1 2019, less than the last 2.2%.
The actual result better than the forecast, as the US GDP grew at an annual rate of 3.2% in Q1 2019, according to the “advance” estimate released by the Bureau of Economic Analysis.
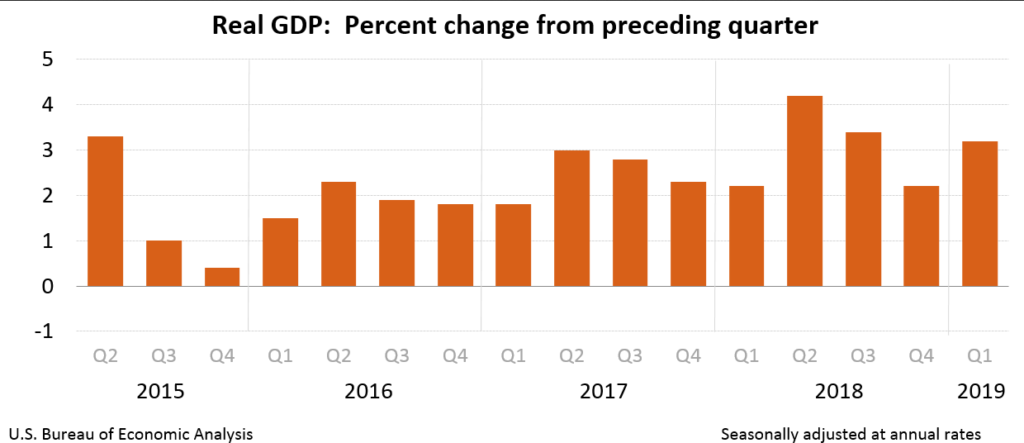
The report added that:
The acceleration in real GDP growth in the first quarter reflected an upturn in state and local government spending, accelerations in private inventory investment and in exports, and a smaller decrease in residential investment.
Overall, the US Dollar buyers remain in action and major pairs like EUR/USD, GBP/USD and AUD/USD are likely to struggle in the near term.
Economic Releases to Watch Today
- Euro Zone Business Climate Index April 2019 – Forecast 0.50, versus 0.53 previous
- Euro Zone Economic Sentiment Indicator April 2019 – Forecast 105.0, versus 105.5 previous.
- US Personal Income for March 2019 (MoM) – Forecast +0.4%, versus +0.2% previous.
Daily Markets Broadcast
Wall Street rebounds on strong GDP print
A strong, above-forecast print for Q1 GDP helped US indices advance on Friday. European bourses found support after Fitch maintained Italy’s sovereign rating while oil prices fell after Trump said he’d asked OPEC to increase supply. Japanese markets are closed all week, so volumes in Asia could be lower.
US30USD Daily Chart
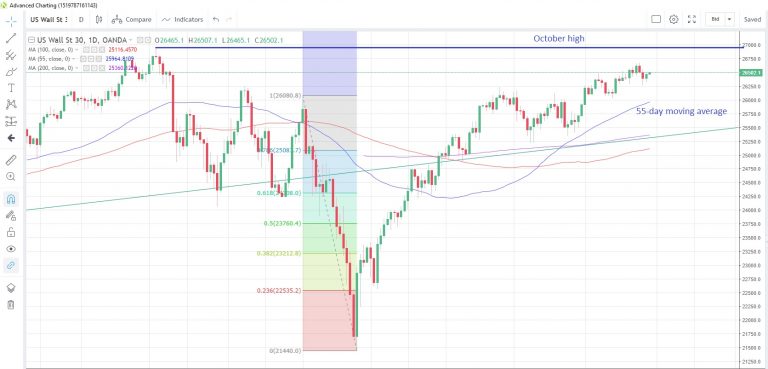
The US30 index snapped a two-day losing streak on Friday after data showed the US economy grew 3.2% y/y, hugely beating forecasts of a dip to 2.0% from 2.2% in Q4
Rising 55-day moving average support is at 25,964 today. Resistance points may be found at this month’s high of 26,666 and the October high of 26,939
US personal income is seen rising 0.4% m/m in March, accelerating from February’s +0.2%
DE30EUR Daily Chart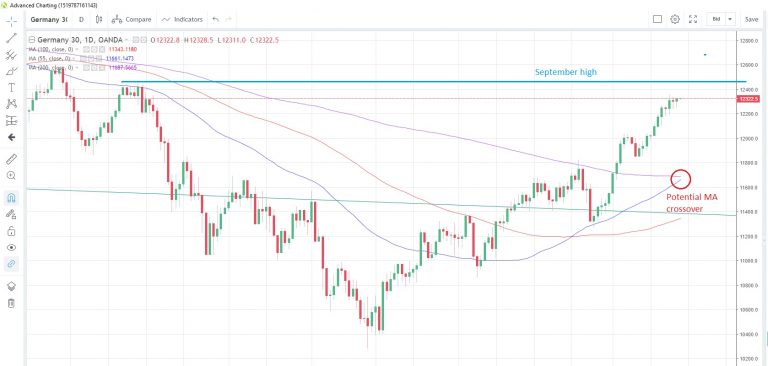
The Germany30 index rebounded on Friday, encouraged by moves on Wall Street and Fitch’s move to maintain Italy’s sovereign rating at BBB, but with a negative outlook
The index is hovering near seven-month highs and the 55-day moving average looks poised to cross above the 200-day moving average later this week. This may be interpreted as a longer-term bullish signal
There is a slew of Euro-zone confidence indicators scheduled today. The one likely having the most impact could be consumer confidence, which is seen steady at -7.9 in April.
WTICOUSD Daily Chart
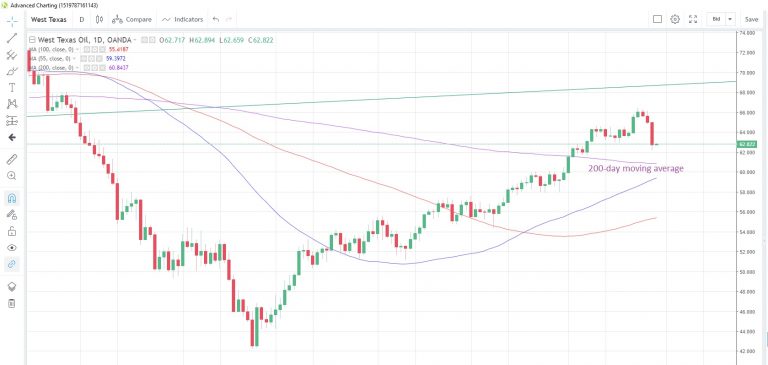
WTI posted the biggest one-day drop this year on Friday as weekly data showed a huge inventory build, heightening concerns about slack demand. US President Trump said he’d asked OPEC to reduce prices
The 200-day moving average is at $60.84 today, and has supported prices on a closing basis since April 1
API weekly crude stocks to April 26 are due tomorrow after showing the biggest weekly addition to stockpiles in seven weeks last week.
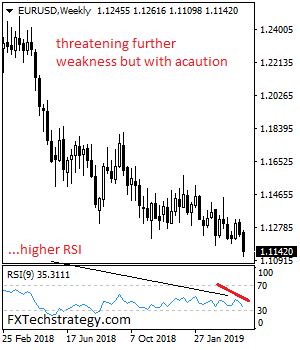
EURUSD Remains Vulnerable But With Caution Of Recovery
EURUSD remains vulnerable but with caution of recovery though retaining its broader downside pressure.. Support comes in at the 1.1100 where a violation will turn risk to the 1.1050 level. A break below here will target the 1.1000 level. Further down, support sits at the 1.0950. Its daily RSI is bearish and pointing lower suggesting further weakness. Conversely, on the upside, resistance resides at 1.1200 level with a break through there opening the door for further upside towards the 1.1.1250 level. Further up, resistance comes in at the 1.1300 level where a violation will expose the 1.1350 level. All in all, EURUSD remains vulnerable but with caution of recovery.
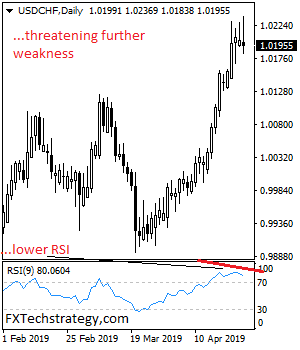
USDCHF Turns Off Higher Prices On Price Failure
USDCHF turns off higher prices on price failure on Friday leaving risk of a pullback on the cards. Resistance resides at the 1.0250 level. Above here, resistance lies at the 1.0300 level and then the 1.0350 level. Further out, resistance comes in at the 1.0400 level. On the downside, support is seen at the 1.0150 level. A turn below here will set the stage for more decline towards the 1.0100 level. And then the 1.0050 level. Further down, support resides at the 1.0000 level. Its daily RSI is bearish and pointing lower suggesting further weakness. All in all, USDCHF continues to eye further downside pressure as it rejected higher prices on Friday