Sample Category Title
Summary 4/29 – 5/3
Monday, Apr 29, 2019
[php_everywhere instance="1"]
Tuesday, Apr 30, 2019
[php_everywhere instance="2"]
Wednesday, May 1, 2019
[php_everywhere instance="3"]
Thursday, May 2, 2019
[php_everywhere instance="4"]
Friday, May 3, 2019
[php_everywhere instance="5"]
Weekly Economic and Financial Commentary: Data Reaffirm Fed Patience
U.S. Review
Data Reaffirm Fed Patience
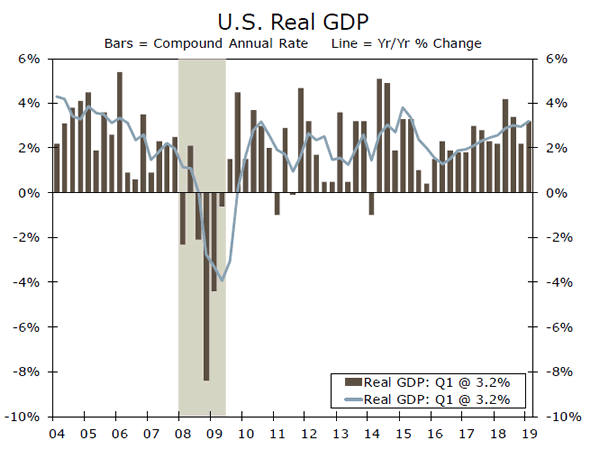
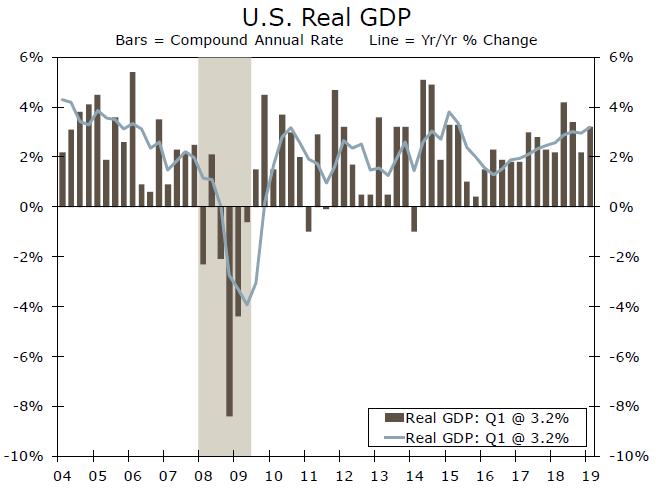
- Economic data out the gate this week were broadly positive— U.S. real GDP grew at an annualized rate of 3.2% in Q1-2019, durable goods orders rebounded in March and the S&P 500 index reached its highest level on record.
- Despite the positive news this week, the U.S. economy continues to face some headwinds. The first quarter headline rate of growth was stronger than most analysts had expected, but underlying details of economic growth were not quite as strong as the headline growth rate suggests.
- This week's data support our expectation for the Fed to refrain from raising rates for the foreseeable future.
Data Reaffirm Fed Patience
Economic data out the gate this week were broadly positive—U.S. real GDP grew at an annualized rate of 3.2% in Q1-2019, durable goods orders rebounded in March and the S&P 500 index reached its highest level on record. Despite the positive news this week, the U.S. economy continues to face some headwinds.
The first quarter headline rate of growth was stronger than most analysts had expected, and it represents a pick-up in growth relative to Q4. But, as we discussed in this morning's GDP report, underlying details of economic growth were not quite as strong as the headline growth rate suggests.
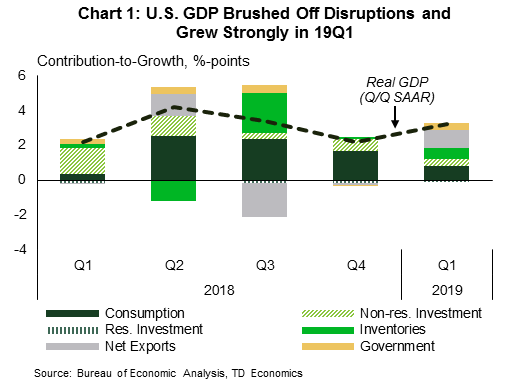
First quarter growth was driven by a surge in inventories and a large contribution from net trade. Underlying consumption was weak, however, with final sales to private domestic purchases rising just 1.3%. That suggests at least some of the $128 billion build in inventories was unintentional. Inventory accumulation should fall back in coming quarters as a result, which would exert a headwind on the overall rate of GDP growth at that time. The one caveat here, however, is the plausible build from the Boeing's 737 MAX aircraft, which while being produced but not delivered is expected to boost Q2 inventories. For additional detail of the economic impact from the 737 MAX, please see our special report.
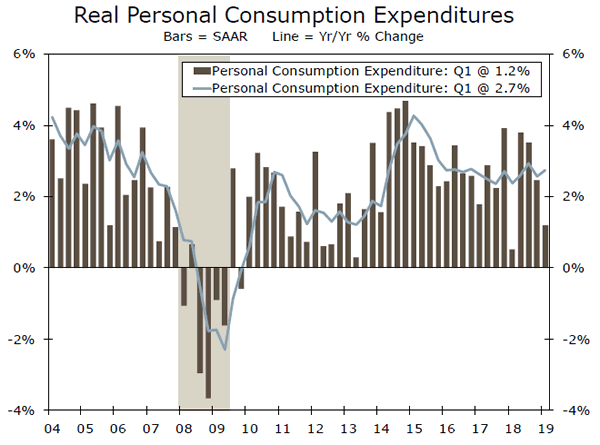
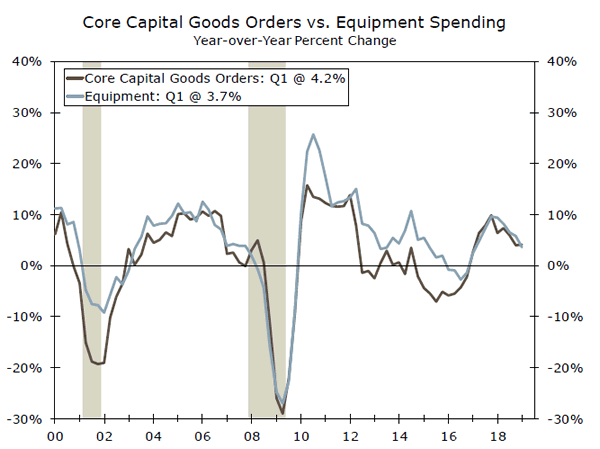
Weaker consumer data in recent months sparked fear among analysts that the consumer had gone into hiding. We have long maintained the view that the weakness was a soft patch and not the start of a broad retrenchment in consumption. That said, as was expected, real personal consumption expenditures (PCE) slowed in the first quarter, rising only 1.2%. But, with the 1.6% surge in March retail sales and consumer sentiment data stabilizing, consumption ended the first quarter on a solid note, which provides some momentum headed into Q2. Fixed investment spending was up only 1.5% in the first quarter. But, investment too may accelerate in coming quarters, as durable goods orders data for March suggest capital spending may be picking up.
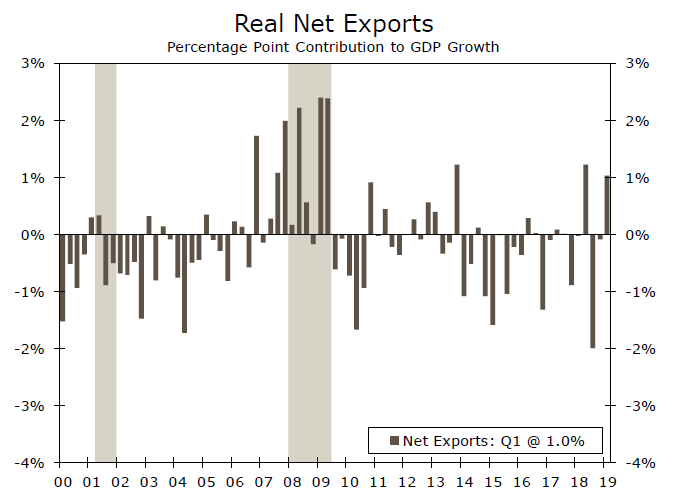
Net exports provided a sizable boost, adding 1.0 percentage point to the overall rate of GDP growth in Q1—which is among the largest positive contributions this component has made this cycle. Exports grew a modest 3.7%, but imports fell 3.7%. As domestic demand strengthens, real imports are expected to rebound in coming quarters, but this will exert a drag on growth.
Although the economy may not have been as strong in Q1 as the headline GDP growth rate suggests, the economy is not in danger of stalling anytime soon. That said, this week's data support our expectation for the Fed to refrain from raising rates for the foreseeable future. As we have highlighted, the underlying details were not as strong as the headline rate of GDP growth suggests. Further, the core PCE deflator rose at an annualized rate of just 1.3% in the first quarter. With the Fed's preferred measure of consumer price inflation remaining below its objective of 2%, it seems likely that the FOMC will be happy to remain on the sideline watching the incoming data. For further reading of our expectations regarding next week's FOMC meeting, please see the Interest Rate Watch section on page 6.
U.S. Outlook
ISM Manufacturing • Wednesday
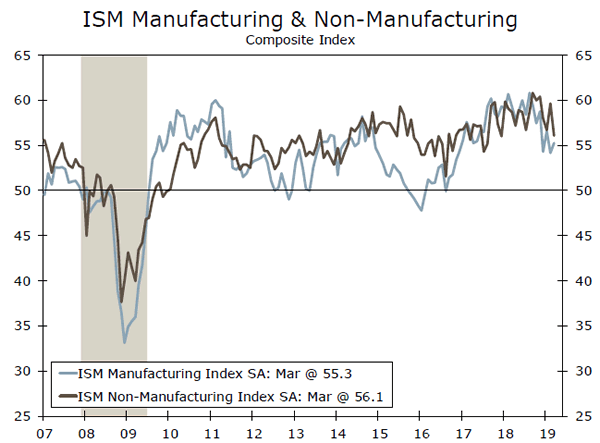
Manufacturing activity has slowed in recent months amid trade uncertainty and cooler global growth. With a trade deal with China looking more likely and the growth abroad firming up a bit, U.S. factory activity looks to be stabilizing. Purchasing managers' indices (PMIs) from the regional Federal Reserve Banks were little changed on balance in April, while the preliminary Markit manufacturing PMI was unchanged. As a result, we look for the ISM to come in close in line with its April print at 55.1.
An upside surprise would signal to the FOMC that the headwinds to the outlook from the trade and global-growth environment are easing, and could spur speculation that the FOMC's next move will be tightening. The ISM non-manufacturing index, released on Friday, is a more meaningful gauge of the overall U.S. backdrop, however. We expect that index to improve to 57.3.
Previous: 55.3 Wells Fargo: 55.1 Consensus: 55.0
FOMC • Wednesday
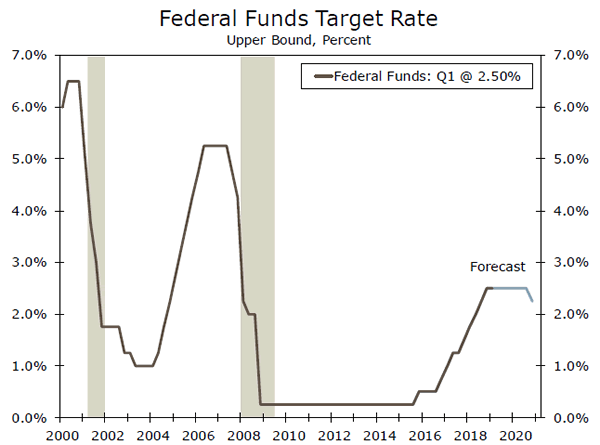
Next week's FOMC meeting will not be followed up by fresh economic projections, but it will be concluded by a press conference with Chair Powell. Closely watched in the statement will be whether the FOMC continues to pledge patience in determining future adjustments to policy. Removing "patient" could give the FOMC more flexibility at future meetings. However, if not carefully communicated, it could be construed that the FOMC is gearing up to hike again given an improvement in recent data, which could lead to a tightening in financial conditions.
Of interest in the press conference will be the way in which conditions would need to change for the FOMC to alter its policy stance either direction given current expectations for it to remain on hold. We view inflation as the key condition to get the FOMC tightening again, but a cut would also depend on renewed tightening in financial conditions and growth slowing below trend.
Previous: 2.25-2.50% Wells Fargo: 2.25-2.50% Consensus: 2.25-2.50%
Employment • Friday
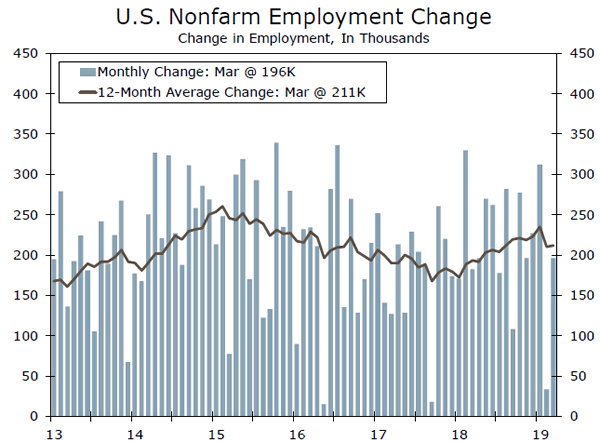
After wild swings to start the quarter, payroll growth settled down in March with employers adding 196K jobs. Hiring of temporary workers has slowed the past few months and points to the overall trend in job growth remaining slower than in 2018. Recent PMI readings of hiring also point to a slower pace compared to last year, but suggest a pickup from the first quarter's lull. The same goes for a new cycle low in jobless claims in April, although the drop was likely exaggerated by the late timing of Easter this year.
Upside or downside, if payrolls come in well-wide of consensus, we expect it to sway sentiment about which direction the FOMC's next move is likely to be. Inflation remains the biggest question for the FOMC in our view, however, which will keep average hourly earnings (AHE) in focus. We expect AHE to increase 0.2% in April, held down in part by calendar quirks, while the unemployment rate will likely hold at 3.8%.
Previous: 196K Wells Fargo: 200K Consensus: 181K
Global Review
Global Growth Concerns Continue to Linger
- At its meeting this past week, monetary policymakers in Canada left their main policy rate unchanged and dropped a reference to future rate increases that had been in every statement since the end of 2017.
- Real GDP growth in South Korea unexpectedly contracted 1.4% on a sequential, annualized basis in Q1-2019, bringing the year-over-year pace below 2% for the first time since 2009.
- The Bank of Japan rounded out the week by reaffirming its extraordinarily easy stance of monetary policy and signaling that the current policy of holding both short and long-term rates near zero would continue through at least the spring of 2020.
Global Growth Concerns Continue to Linger
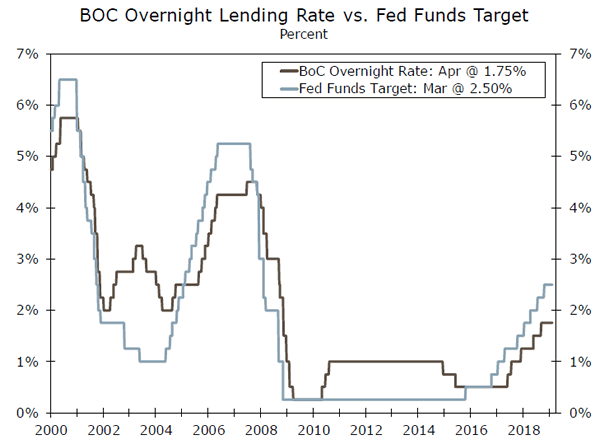
Like the Federal Reserve, the Bank of Canada (BoC) has been a developed economy central bank that has succeeded in bringing its main policy rate up in recent years (see chart on front page). Strong employment growth, a steady closing of the output gap and core inflation that remained in the ballpark of 2% helped the BoC chart a course with more tightening than most.
At its meeting this past week, however, the BoC seemed to bring its language in-line with the dovish mindset that has taken hold at most major central banks of late. Monetary policymakers in Canada left their main policy rate unchanged and dropped a reference to future rate increases that had been in every statement since the end of 2017. The Bank also cut its growth forecast for 2019 by half a percentage point, to 1.2% from 1.7%.
The headwinds in Canada have been strong recently. In its statement, the BoC acknowledged that global economic growth had slowed by more than the Bank forecast in January. Oil's swoon over the winter has also been a hurdle, as has continued trade uncertainty, especially as it relates to NAFTA and its possible heir apparent, the USMCA.
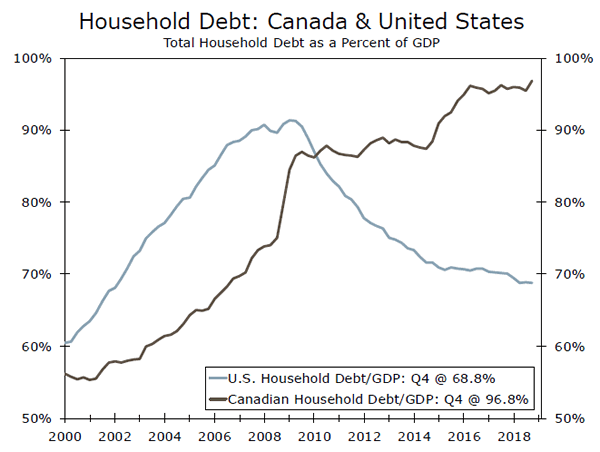
Making matters worse, Canadian households appear to finally be feeling the weight of their significant debt burdens. Unlike households in the United States, households in Canada continued to see leverage as a share of the economy rise during this expansion (top chart). Much of the debt growth occurred as a result of a frothy housing market, but of late home price appreciation has slowed dramatically. Both we and the BoC believe growth should stabilize around 1.5-2.0% later this year, but given the challenges it looks increasingly like any additional policy tightening is a ways away.
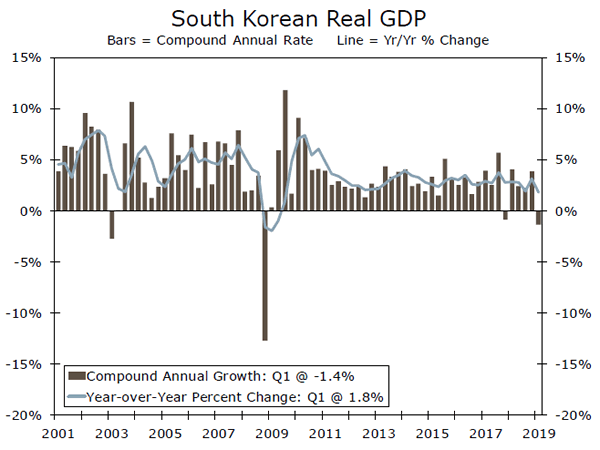
Real GDP growth in South Korea unexpectedly contracted 1.4% on a sequential annualized basis in Q1-2019, bringing the year-over-year pace below 2% for the first time since 2009 (middle chart). South Korea is a country heavily integrated into global trade, particularly to China: total exports are about 44% of South Korean GDP, and nearly 25% of Korean exports are to China. Export volumes fell 2.6% on a sequential basis in Q1, steeper than the 1.5% fall in Q4-2018. Investment spending was also soft. Gross fixed capital formation declined 8.4% year-over-year, accelerating the 3.8% dip seen in Q4-2018. Better economic data out of China and the United States, Korea's second largest trading partner, bode well for the second half outlook. But, the recent weakness in South Korea could be perceived as another sign that the global economy is not out of the woods yet.
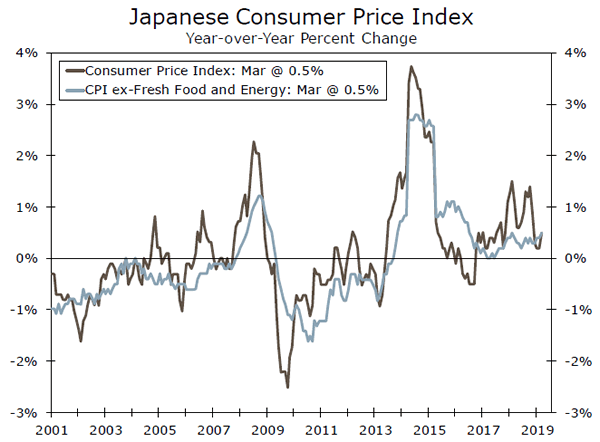
The Bank of Japan (BoJ) rounded out the week by reaffirming its extraordinarily easy stance of monetary policy. The BoJ added a new forward guidance element to its policy statement, signaling that the current policy of holding short and long-term rates near zero would continue through at least the spring of 2020. With policy options more limited in Japan than perhaps any other developed economy, it appears the BoJ is turning to forward guidance to provide additional stimulus and boost inflation, which remains mired below 2% (bottom chart).
Global Outlook
Eurozone GDP • Tuesday
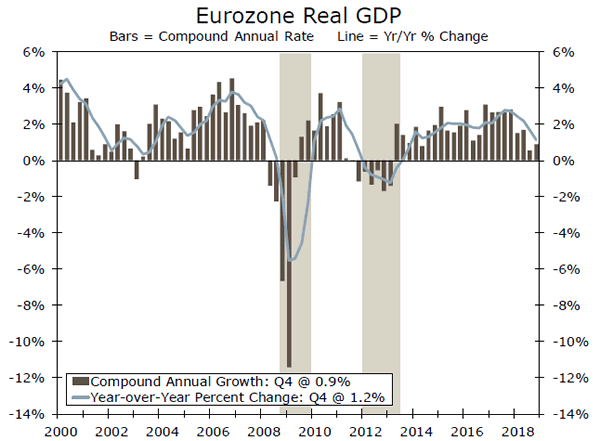
Economic growth in the Eurozone has slowed markedly. Real GDP growth was just 1.2% year-over-year in Q4-2018, the slowest pace since Q4-2013. GDP data for the first quarter will be released next Tuesday, and the monthly indicator data point to some stabilization, but not a full turnaround. Retail sales have rebounded solidly in the first two months of the first quarter after December's inexplicably weak reading, and the services PMI appears to have found a floor in the 51-52 range. Though still negative on a year-ago basis, industrial production growth has also been a bit better of late.
Still, it appears economic growth is likely to come in around a relatively weak 1% pace, both on a year-over-year basis and as a compound annual growth rate for the quarter. It will likely take more than a stabilization around current growth rates to convince policymakers at the European Central Bank that the next move will be for tightening monetary policy rather than additional stimulus.
Previous: 0.2% Consensus: 0.3% (Quarter-over-Quarter, Not Annualized)
China PMIs • Monday/Wednesday
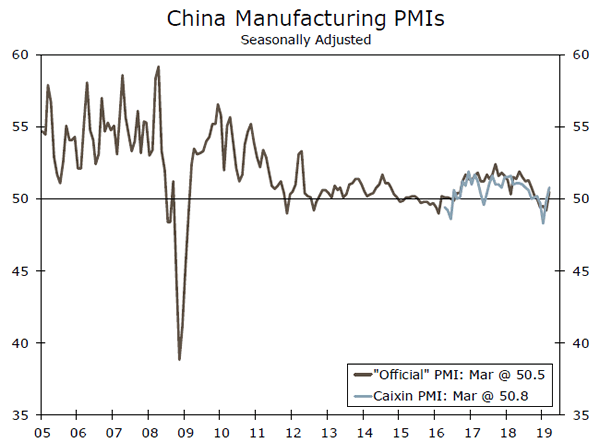
In late March and early April, stronger PMI readings out of China helped assuage some concerns about a significant slowdown in the country to start 2019. "Hard" data reported a couple weeks later showed real GDP growth was steady at 6.4% in Q1-2019, suggesting the government's stimulus efforts have helped prevent a sharp slowdown in the near term.
We have believed for some time that Chinese policymakers would do what it takes to keep economic growth from slowing too sharply. Even with the measures taken thus far, however, the data are still far from robust. Both the "official" and the private Caixin PMIs for manufacturing are only a bit above the key 50 level. Some additional improvement in the data would be welcome, but for both structural and trade-related reasons we expect Chinese economic growth to continue slowing in the quarters ahead, just at a relatively controlled pace.
Previous: 50.5 (Mfg., "Official"), 50.8 (Mfg., Caixin) Consensus: 50.6 (Mfg., "Official"), 51.0 (Mfg., Caixin)
Bank of England Meeting • Thursday
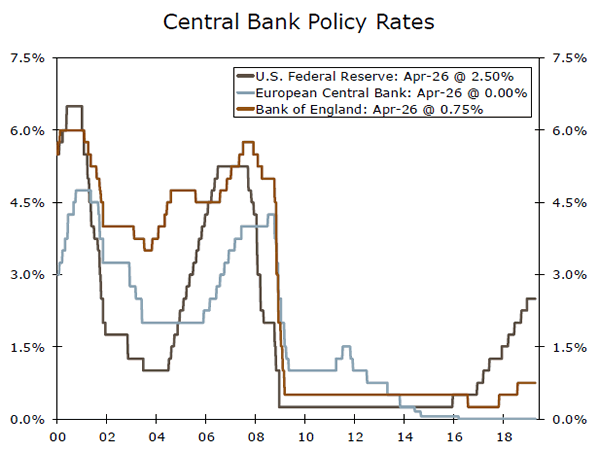
The Bank of England (BoE) has kept monetary policy on hold for an extended period of time while awaiting the resolution of the Brexit knot, originally due to clear a major hurdle on March 29. Two extensions later, and the U.K. now has until October 31 to sort out how to proceed with leaving the European Union.
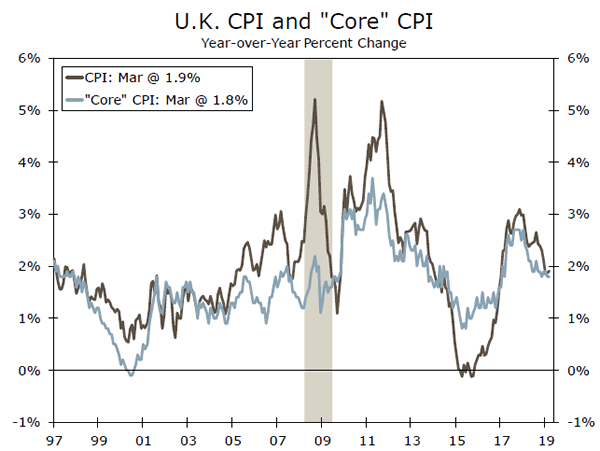
This likely leaves monetary policymakers still stuck in limbo. The Bank of England has appeared poised to hike rates for months but has been held back by the uncertainty related to Brexit. The output gap appears mostly closed in the United Kingdom, and inflation is right around the 2% target. The BoE also noted in its last statement that, with wage growth around 3.5% and continued weakness in productivity growth, growth in unit wage costs has risen. With so much uncertainty still at play, however, we believe the BoE will probably keep its main policy rate on hold until next year.
Previous: 0.75% Wells Fargo: 0.75% Consensus: 0.75%
Point of View
Interest Rate Watch
Rates Are Unmoved By Stronger GDP
The first quarter's surprisingly robust 3.2% annualized real GDP growth was not nearly as strong as the headline indicated. Growth was bolstered by an abrupt turnaround in international trade and surge in inventories, neither of which is likely to continue in the second quarter. Top line growth also benefitted from a surge in state and local government spending, which was largely highway and road work delayed during the unusually rainy fall months. Final sales to private domestic purchasers, which is a more accurate measure of final demand in the economy, rose at just a 1.3% pace.
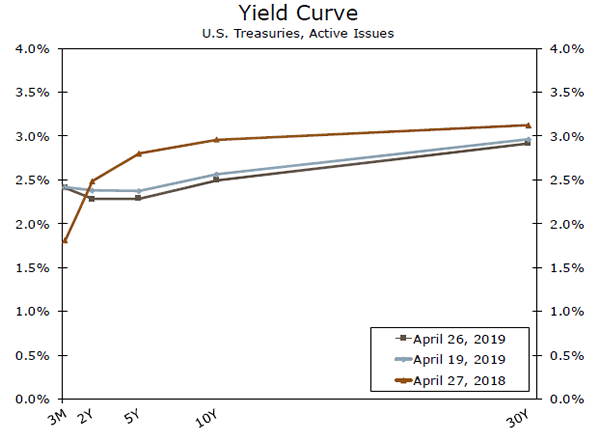
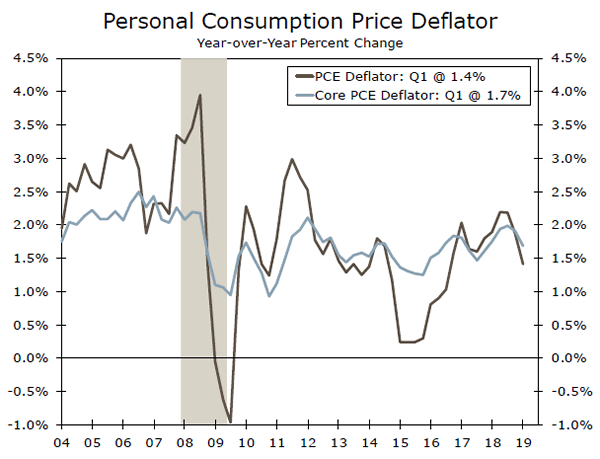
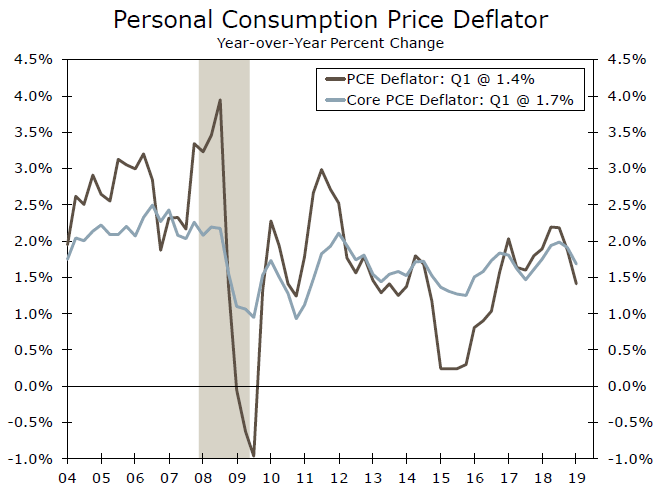
The paltry gain in final domestic demand explains why inflationary pressures cooled during the first quarter, even though headline growth appeared to have surged. The PCE deflator slowed to just 1.4% year-over-year during the first quarter. At this point of the expansion, the financial markets and the Fed are more concerned about where the economy and inflation are headed than where they have been.
The underlying data suggests economic growth is slowing and inflation is decelerating, which at a minimum should keep the Fed on hold. Treasury yields declined following the GDP release. We still see the Fed's next move as a rate cut but not until the fourth quarter of 2020.
We expect to see the Fed focus a great deal on the deceleration in core inflation at next week's FOMC meeting. The year-over-year change in the core PCE deflator has slowed from 2.2% a year ago to just 1.3% currently, even though real GDP growth has risen 3.2% over this time period and the unemployment rate has fallen 0.2 percentage points to 3.8%. Inflation expectations also remain contained.
Slower global growth and heightened uncertainty surrounding trade negotiations with China and Europe are also top of mind for the financial markets and the Fed. Slower global growth appears to be weighing on the U.S. manufacturing sector, although the downside risks appear to have eased more recently. Moreover, data on orders, production and employment have, so far, proved surprisingly resilient.
Credit Market Insights
The Fed and Financial Markets
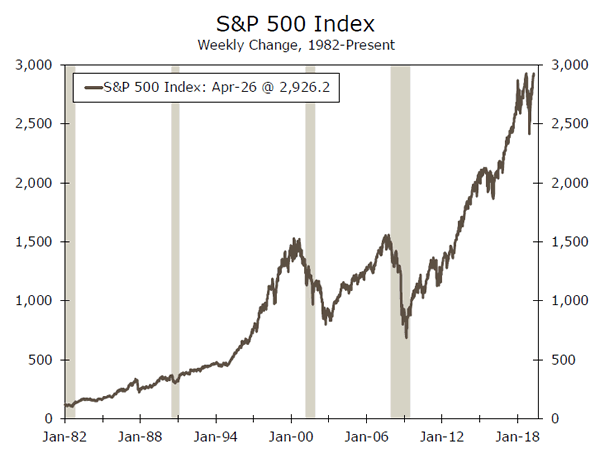
The S&P 500 rose to an all-time high this past Tuesday, as financial markets have enjoyed one of the best starts to the year in decades. The S&P is up nearly 25% since bottoming out at the end of December. Investment grade credit spreads have fallen 50 bps since December back to the levels averaged over most of 2018, while high yield credit spreads have fallen over 150 bps, remaining slightly above their 2018 average. Financial markets have been more than happy to embrace the FOMC's monetary policy pivot, after its recognition at its January meeting of the "tightening of financial conditions and the associated downside risks to the U.S. economic outlook that had emerged since the fall." Fast forward to the March meeting, and the FOMC explicitly attributed the financial market rebound to the "perceived shift in the FOMC's approach to policy following communications stressing that the Committee would be patient." With the next FOMC meeting on Tuesday—one week after the S&P reached a record high—will it deem a further pause appropriate, or has the major impetus for its pivot sufficiently dissipated? We think it was not the financial market sell-off per se that drove the FOMC to pause, but rather the fact that the markets were signaling their displeasure with perceived insufficient policy flexibility. Taking this lesson to heart, the FOMC is now facing persistently sub-2% inflation and unresolved global risks that together justify further patience—despite investors' rediscovered exuberance.
Topic of the Week
Where Has All the Volatility Gone?
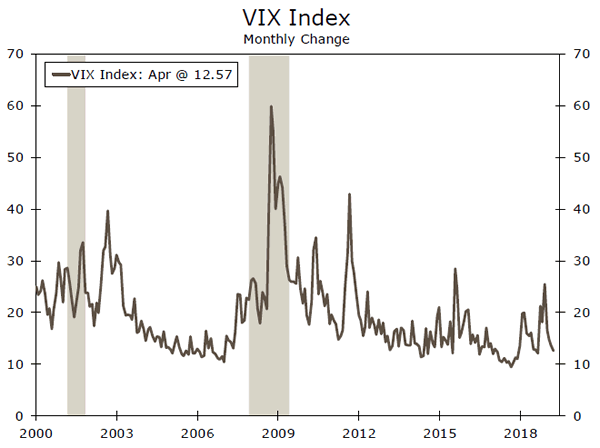
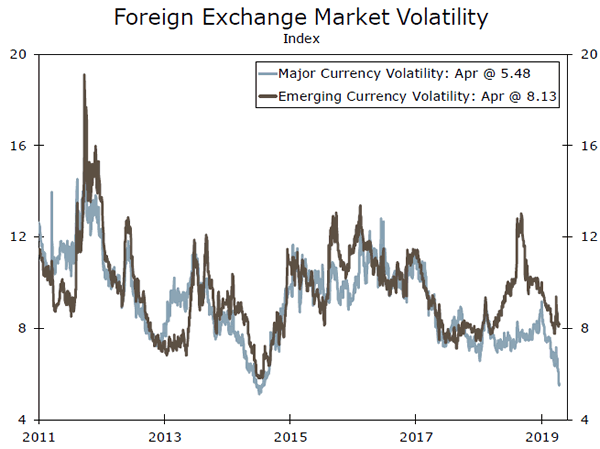
Back in December, financial markets encountered significant turbulence. However, volatility has receded markedly so far this year. For example, the VIX index, which measures volatility in the stock market, has trended significantly lower since the beginning of the year (top chart). Volatility indices in the foreign exchange market have also receded (bottom chart), and the yield on the 10-year Treasury security has fluctuated in a narrow 20 bps range in recent weeks. What's causing the drop in financial market volatility?
For starters, central banks have turned dovish this year. The Federal Reserve contributed to the spike in volatility in December when the FOMC continued to signal that it likely would raise rates significantly further this year. However, most FOMC members now believe that no further tightening will be needed in 2019, and the European Central Bank recently pushed back its projected date of "lift off." The Bank of England likely will be on hold as long as uncertainty about Brexit continues to linger. Trade tensions among some of the largest economies of the world have also died down this year.
We have no idea how long financial market volatility will remain suppressed. But there are a number of potential catalysts that could trigger a return of volatility. First, the Fed could potentially turn less dovish. If economic data in coming months come in stronger than expected and/or if inflation moves markedly higher, then FOMC members may become less sanguine about the outlook for monetary policy. Second, the Commerce Department submitted a report to President Trump on February 17 on whether auto imports constitute a national security threat to the United States. The president needs to decide by May 18 what action, if any, the administration will take. If President Trump decides to impose tariffs on auto imports, American trading partners (e.g., Germany and Japan) could retaliate with tariffs on American goods. A trade war with those countries, should one ensue, would surely lead to higher volatility in financial markets. Stay tuned.
The Weekly Bottom Line: Toward a Lower Neutral Rate, and Not Beyond
U.S. Highlights
- The American economy grew by 3.2% in the first quarter of 2019, comfortably beating market expectations. However, the strength was driven by inventories and net exports, while domestic demand growth weakened.
- The housing market continues to be an economic weak link. Existing home sales in March fell below expectations. A lack of inventory appears to be weighing on sales activity.
- As confirmed in the GDP report, price pressures were softer than expected early in the year, underpinning the Federal Reserve's move to the sidelines.
Canadian Highlights
- The Bank of Canada's April MPR was front and center this week. Both the global and Canadian economic outlooks were revised down for 2019.
- The Canadian economy is now estimated to be operating with more slack, lasting longer than previously forecast. This suggests that current stimulative interest rates will need to persist for some time.
- The weaker economic outlook is broadly consistent with our March QEF. As such, we anticipate that the policy interest rate will hold steady through 2020.
U.S. - Q1 Growth Surge Shakier Underneath The Hood
The U.S. economy brushed off disruptions caused by the partial government shutdown and abnormal weather, and grew strongly in the first quarter, beating consensus expectations by 0.9 percentage points (3.2% vs 2.3%). However, behind the sheen of the solid headline, the drivers of growth were not as lustrous. Domestic demand growth weakened, with consumers saving a little more and businesses slightly more cautious with their investments dollars. Instead, inventories and net exports – the more volatile components of GDP –provided the heavy lifting. The build-up of inventories is now a three quarter trend. It is likely to be reversed in the quarters ahead, dragging on real GDP growth. The good news is that with temporary disruptions dissipating, domestic demand should improve next quarter, taking the mantle in driving growth.
Amid the hurrah of strong real GDP growth, the one segment of the economy that continued to underperform was housing. Residential investment contracted in all four quarters of 2018, and pulled back again in the first quarter. Early indications suggest a mixed start to the second quarter. Existing home sales fell 4.9% in March, below consensus expectations. The pullback followed a strong gain in February, but the level of sales has shown little overall progress over the past several months (and is well off peak levels seen in the fall of 2017). Fortunately, the news was better on the new home sales front. New single-family residential sales rose 4.5%, building on even stronger gains in January and February. In contrast to the existing market, new home sales are just a touch below the recent cycle peak.
With affordability improving – a function of both lower mortgage rates and accelerating income growth – the demand drivers for housing appears to be solid. The supply side appears to be the constraining factor. The inventory of existing homes available for sale continues to hover near historical lows. Unless supply constraints are alleviated, the upswing in demand could reverse the recent deceleration home price growth.
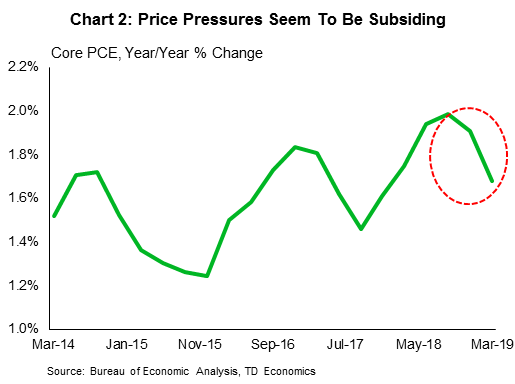
Speaking of prices, PCE inflation data for 19Q1 was released alongside GDP data and came in surprisingly soft. We cannot yet tell which month the weakness was concentrated as only January data are available (February and March data will only be released on Monday). Nevertheless, the weaker reading in Q1 indicates cooling price pressures, reinforcing the Federal Reserve's position to hold off any interest rate hikes through 2019. Bond yields appear to have dipped lower following the digestion of these details, discounting the surprise in real GDP growth.
Headline inflation is likely to see something of a lift in upcoming months, reflecting the broad-based rebound in oil prices since the end of 2018. Still, the ride may be bumpy. The West Texas Intermediate oil price benchmark hit $65 earlier in the week, before falling on Friday on word that Trump has been upping the pressure on OPEC. This, despite news that the administration will no longer exempt countries from Iran sanctions beginning May 2nd.
Canada - Toward a Lower Neutral Rate, and Not Beyond
A light data week allowed the highly-anticipated Bank of Canada interest rate decision to garner the attention it deserved. A disappointing end to 2018, oil production curtailments, and mixed data at the start of 2019 raised concerns about whether the Canadian economy was heading for recession.
In its April MPR, global growth in 2019 is forecast to have slowed to a 3.2% pace, half a point weaker than last year. This markdown largely reflects elevated global economic uncertainty as broadening trade tensions weigh on activity.
Slower foreign growth is bad for commodities and other goods Canada exports. The Bank of Canada acknowledged this by broadly marking down its Canadian outlook for this year. Canada's economy has been going through a rough patch since the middle of last year, and the softness should remain through the end of this quarter. First half weakness, combined with little growth to end 2018, motivated the Bank's downgrade of 2019 GDP growth to 1.2% (from 1.7% in January). The Bank's first quarter growth was revised down to 0.3% (q/q annualized) from January's 0.8% forecast, broadly in line with our tracking. Overall, the Bank's downgraded economic outlook better reflects the reality for both the global and Canadian economies.
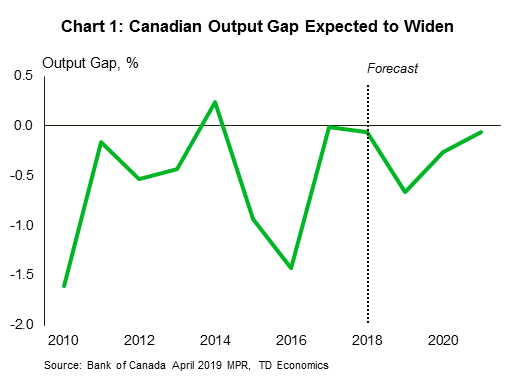
A softer 2019 and rebound to only just above-trend growth next year does little to absorb the slack in the economy that has materialized in the last few quarters (Chart 1). A more negative output gap is consistent with subdued, slightly-below-target inflation. Such an outlook does not call for rate hikes. In fact, this outlook suggests that current stimulative interest rates may need to persist for some time.
The downgrade parade didn't end with the economic outlook. A reevaluation of potential GDP growth saw the trend running speed of the Canadian economy reduced to 1.7% next year, a tenth of a point lower relative to April 2018's assumption. Soft business investment and strong labour markets sent the Bank's view of trend productivity growth about 0.3 ppts lower through 2021.
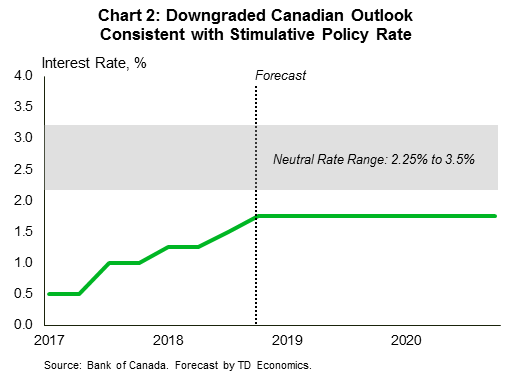
A weaker outlook for domestic trend productivity growth, and the Fed's March downgrade in its interest rate outlook, motivated the Bank of Canada's markdown of its nominal neutral rate range by 25bps. Although unobservable and highly uncertain, the neutral rate has been used as an anchoring mechanism for interest rate expectations by the Fed and the Bank of Canada – Governor Poloz has often referred to it as "home". Moving the lower end of the nominal range down to 2.25% suggests that the policy rate of 1.75, although below neutral, was less stimulative than previously assumed (Chart 2).
Although downgrades were the dominant theme, there is scope for cautious optimism. Domestic service industries remain resilient, and wage growth in most of Canada has improved over the last year. Still, the weaker economic outlook augurs for rates to hold steady through 2020.
U.S.: Upcoming Key Economic Releases
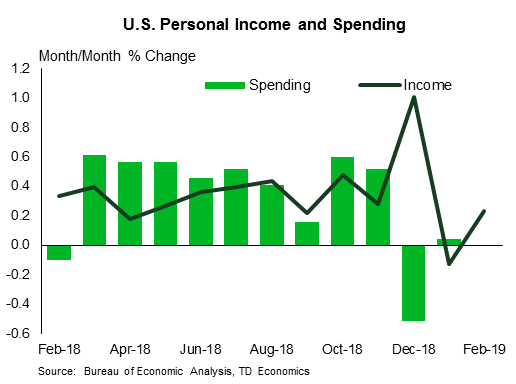
U.S. Personal Income & Spending - March
Release Date: April 29, 2019
Previous: spending: n.a.; income: 0.2%
TD Forecast: spending: 0.8% m/m; income: 0.4%
Consensus: spending: 0.7% m/m; income: 0.4%
We anticipate spending to have closed the quarter on a strong note and advanced at its fastest pace since September 2017 at 0.8% m/m, up from an estimated 0.2% rise in February (also our forecast). In the details, we expect a 0.4% m/m increase in services spending to be the main driver of the March rebound, with a rise in spending on both durables (+2.1%) and nondurables (+1.2%) also helping on the headline. Moreover, we forecast income to rise 0.4% m/m, a stronger pace than that in both Jan and February.
U.S. ISM Manufacturing Sales - April
Release Date: May 1, 2019
Previous: 55.3
TD Forecast: 54.8
Consensus: 55.0
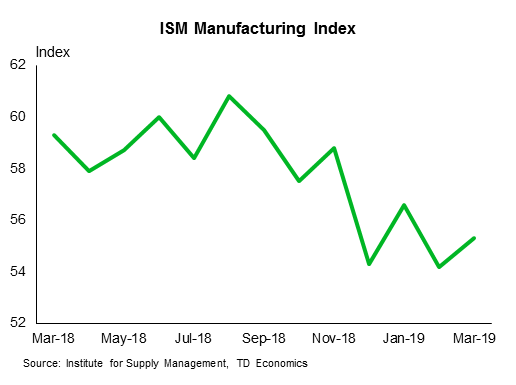
We look for a minor drop in the ISM index as the regional Fed surveys suggest manufacturing activity is holding steady. Indeed, the average of the ISM-adjusted regional surveys remained unchanged at 54.2 in April, despite declines in three out of the four surveys published to date. Based on the regional data, we anticipate downward corrections in the employment and inventories components of the survey and a slight improvement in production. Additionally, new orders likely fell slightly. A recent pick-up in durable goods orders ex-transportation also puts a floor under downside risks for the April ISM print.
U.S. Employment - April
Release Date: May 3, 2019
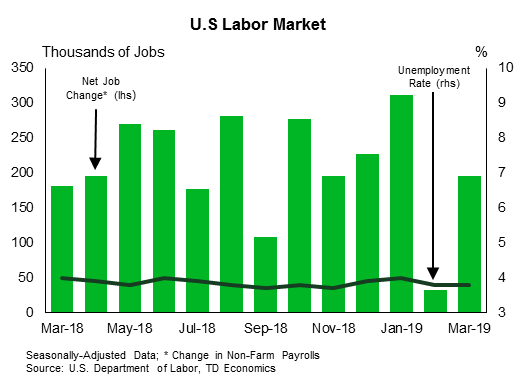
Previous: 196k, unemployment rate: 3.8%
TD Forecast: 170k, unemployment rate: 3.7%
Consensus: 188k, unemployment rate: 3.8%
We look for payrolls to trend modestly lower to 170k in April, following the near-200k print in the previous month. In particular, we expect a minor rebound in manufacturing jobs following two disappointing payroll prints. However, this is likely to be more than offset by a deceleration in job creation in the services sector. We do flag risks to the upside on the back of a larger-than-expected recovery in employment in the retail sector after two notable declines in February and March. All in, the household survey should show the unemployment rate ticked down a tenth to 3.7%, while wages are expected to rise 0.2% m/m. This should leave the annual print unchanged at 3.2%. However, if we get a "soft" 0.2% advance, the annual pace in wage growth should slow to 3.1%.
Canada: Upcoming Key Economic Releases
Canadian Real GDP - February
Release Date: April 30, 2019
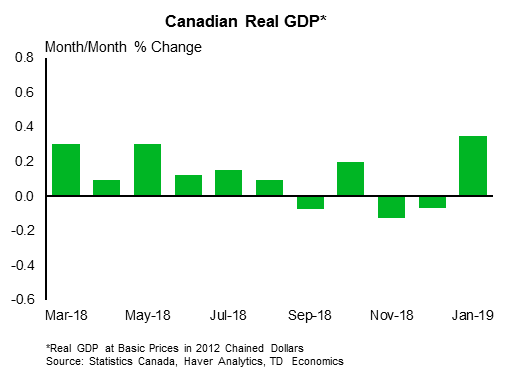
Previous: 0.3%
TD Forecast: 0.0%
Consensus: 0.0%
TD expects industry-level GDP to remain unchanged in February following the robust 0.3% print last month. Activity data for the month of February was mixed on balance, with retail and manufacturing sales helping to offset one another. However, volumes were disproportionately skewed to the downside due to a large increase in consumer prices. Weather will also have an adverse impact if the sharp pullbacks in residential construction and home sales offer any signal, although this will be partially offset by higher utilities output. Looking to the energy sector, mandated production caps began to roll off by an initial 75bpd in February, leaving the daily maximum production 250k barrels below 2018 levels, down from 325k in January. However, preliminary crude production figures show weaker output during the month, which suggests that transportation bottlenecks continue to impact upstream activity despite less government intervention.
Dollar Rally Stalls ahead of FOMC, NFP, Trade Talks, and Earnings
The US dollar rallied for most of the trading week, but gave back gains on Friday after the US first quarter GDP strong beat was supported by transitory factors and softer core PCE. The headline showed US economic growth accelerated much faster than the high end of economists’ forecasts. Net trade inventories and inventories were responsible for half the gains of GDP and personal consumption dropped sharply. The kneejerk rally in the dollar was short-lived as rate cut expectations grew slightly.
- FOMC meeting and Jobs data on tap next week
- Big tech and Pharma highlight earnings on tap
- Trade talks continue and China PMIs due
- Loss of liquidity from Japan’s observance of Golden Week
USD
What is next for the US dollar? After approaching two-year highs, with the last leg mainly being attributed to weakness in Europe, the dollar will look to take queues from the Wednesday’s Fed meeting and Friday’s nonfarm payroll report. No change in policy is expected from the Fed, but investors will look for clues if they will say what is needed to occur for them to make a policy move. The Fed is expected to make this meeting a non-event, but it could become one if they become optimistic on the economy. On Friday, the April nonfarm payroll report is expected to see hiring create 185,000 new jobs, down from 196,000 in March. The labor market remains the strong part of the economy, but we are starting to see some signs of weakness with job openings and jobless claims.
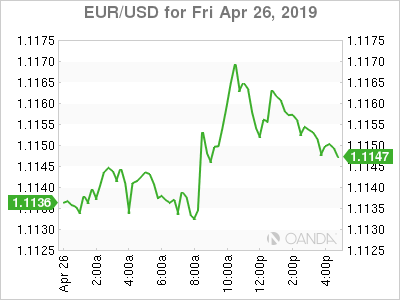
China
Two big risks for Asia will come from the next round of trade talks and another round of Chinese PMI readings. This will also occur during Japan’s observance of Golden Week, which could mean exaggerated moves with yen crosses.
Treasury Secretary Mnuchin and US Trade Representative Lighthizer return to Beijing for another round of talks that will focus on intellectual property, forced technology transfer, non-tariff barriers, agriculture, services, purchases and enforcement. President Xi delivered many assurances with his speech at the Belt and Road Forum in Beijing. If President Trump signals to his team he is content with the latest concessions, we could see a final meeting setup later in May.
China’s Government PMI readings are also expected to remain in expansion territory, with the manufacturing reading rising from 50.5 to 50.6.
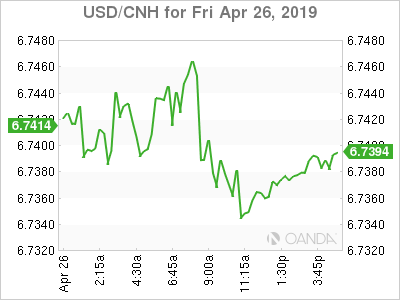
Earnings
So much for negative earnings forecasts. Roughly a third of the way through earnings season and markets are happily surprised with the results. Financials were mixed but optimistic on the consumer, tech has surprised to the upside and the consumer stocks have been mostly positive. The next batch of results focus heavily on tech, pharmaceuticals, energy and transportation results.
Google parent company Alphabet Inc. delivers results on Monday, while Apple Inc. reports on Tuesday. Healthcare results are expected from Pfizer, Merck, Eli Lilly, Amgen, GlaxoSmithKline, and Gilead.
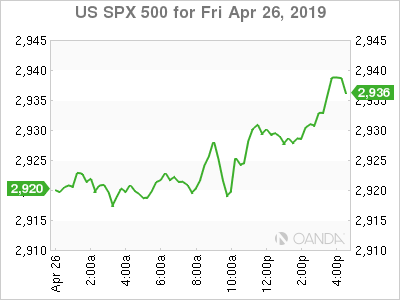
Oil
Crude prices continued to slide from the six-month high made earlier in the week after President Trump tweeted “Spoke to Saudi Arabia and others about increasing oil flow. All are in agreement.” The biggest fall with oil prices in four months is occurring despite the US ending sanction waivers for Iranian crude and a Russian supply outage.
The problem for oil bulls is that the market has been overly bid and there were hardly sellers in place. The path of least resistance may be to the downside in the short-term.
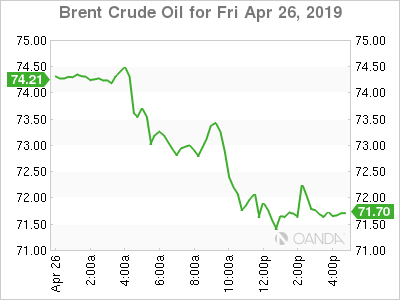
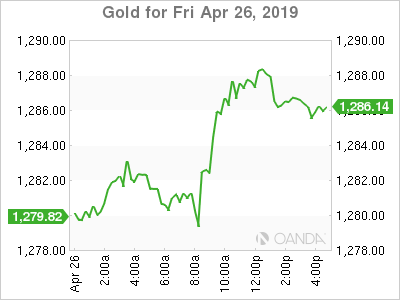
Gold
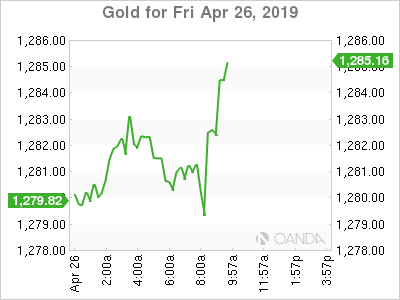
The precious metal finished higher for a third consecutive day after markets dissected the US first quarter GDP beat that was accompanied with softer inflation and with components that suggest weakening consumer demand.
The broad-based dollar weakness also provided some much-needed support for gold prices. Dovish expectations grew for the Fed following the data dump, but if we continue to see record highs in stocks, it will be most difficult for gold to break out much higher.
Forward Guidance: Canada GDP Growth Tracking Soft Q1, But as Soft as BoC Expects?
Canada’s February GDP report will help set the near-term growth narrative following the Bank of Canada’s well-telegraphed shift to a neutral policy bias in the April 24th policy announcement and Monetary Policy Report. We agree that recent growth/inflation trends make it tough to argue that additional interest rate hikes are necessary at this point. We were a bit surprised, though, by the central bank’s call for GDP growth to slow to just 0.3% (annualized) in Q1. Given the economy’s better-than-expected performance in January, it would take substantial declines in February and March to add up to growth that soft. And recent data hasn’t looked that bad. Labour markets look very solid, albeit still without as much wage growth as we would expect at this point in the economic cycle. Unusually bad weather was probably a factor weighing on home resales in February. Housing starts also fell, but that doesn’t appear to have prevented a second consecutive solid increase in residential construction spending. And oil production probably ticked up after being pushed lower in January by mandatory production cuts in Alberta. We think overall February GDP will be little-changed from January’s 0.3% month-over-month increase. Absent revisions to earlier monthly data (which are quite possible), that would still be consistent with growth of around 1% in Q1, certainly on the soft side but a little better than the BoC’s call for essentially no change.
Headline GDP growth numbers are probably less important than the extent to which any softness can be linked to transitory disruptions in the energy sector. On that front, the data has been somewhat mixed. As the BoC noted, household spending growth also slowed dramatically in Q4. We would note, though, that excluding oil & gas extraction and closely-related industries, GDP growth averaged ~1 ¾% per-quarter over the second half of last year and was already 2% above its Q4 average as of January 2019. To be sure, underlying growth is still slowing alongside a loss of momentum in household spending but underlying trends don’t look as bad as headlines might imply. Governor Poloz & Co will (rightly) not be overly swayed by a few data points, so policy interest rates look firmly locked in place for the foreseeable future even if near-term growth were a little stronger than the BoC expects.
External growth has also been a concern for the Bank of Canada, but data has been more positive recently on that front. US GDP jumped a stronger-than-expected 3.2% in Q1. We expect the flow of data to continue to look reasonably solid over the coming week, highlighted by what we think should be another solid 200kish increase in payroll employment. We don’t expect any change in tone from Fed policymakers following Wednesday’s FOMC meeting after the dovish shift just 6 weeks earlier. As in Canada, though, more positive economic reports still argue against market pricing implying that the next move on rates is more likely to be a cut than a hike.
Euro Bears Frustrated by Mixed US Data but More Evidence Needed to Signal Reversal
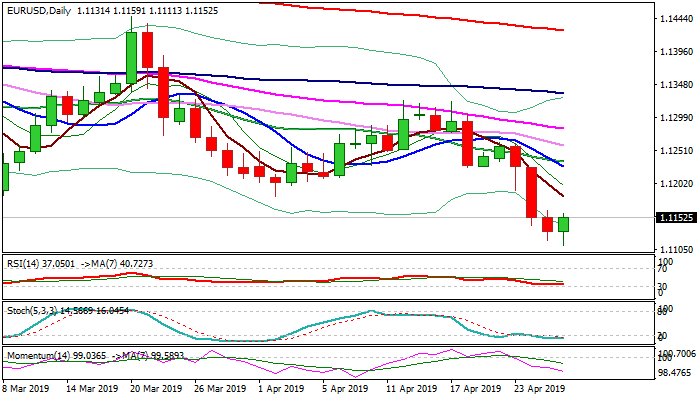
The EURUSD stayed at familiar levels following choppy reaction on today's key event, release of US Q1 GDP data.
Surprise acceleration of US growth in the first three months in 2019 (3.2% vs 2.2 prev and 2.0% f/c) was positive signal. The dollar jumped across the board in immediate reaction but bullish signal was offset by weaker than expected Core PCE indicator which fell below expectations (1.3% vs 1.6 f/c and 1.8% prev).
Core PCE is one of Fed's key references and today's miss could signal that the US central bank would stay on hold for extended period of time, with growing expectations that Fed may cut interest rates by the end of the year.
Mixed US data could discourage Euro bears, as investors in changed conditions, would look to exit dollar longs that would boost recovery of Euro after the currency hit new 23-month low at 1.1111 after data release today.
Improved conditions of one and four-hour charts support recovery attempts, however, dailies continue to maintain strong bearish momentum, but are oversold.
Fresh recovery is on track for bullish close on Friday and potential formation of bullish outside day pattern which would generate initial bullish signal for further recovery action.
In this case, 1.1180/1.1200 zone will mark pivotal point (former lows/Fibo 38.2% of 1.1323/1.1111 bear-leg) violation of which would generate initial reversal signal.
Conversely, limited recovery would signal that bears keep control and would signal extended consolidation before fresh push lower.
Res: 1.1162; 1.1186; 1.1200; 1.1226
Sup: 1.1111; 1.1070; 1.1058; 1.1000
US update: Limited loss in Dollar and stocks, 10-year yield suffers after GDP
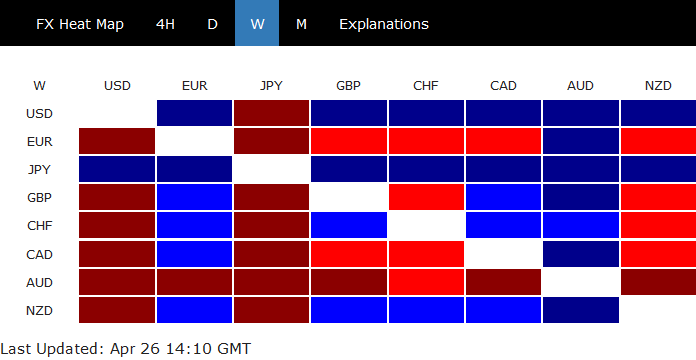
Dollar weakened notably in early US session after US Q1 GDP report. The headline growth of 3.2% annualized blew past expectations. But analysts were quickly to point out that the details were much weaker than the headline suggested. Nevertheless, downside in Dollar is relatively limited for now. It remains the second strongest for the week, next to Yen.
Some suggested readings on US GDP:
- US: GDP Growth Not Quite as Strong in Q1 as Headline Suggests
- US GDP Recap: Traders See Through Stellar 3.2% Headline Growth to Questionable Details
- US: Temporary Factors Boost First Quarter Growth to 3.2%
- US GDP Jumped 3.2% in Q1
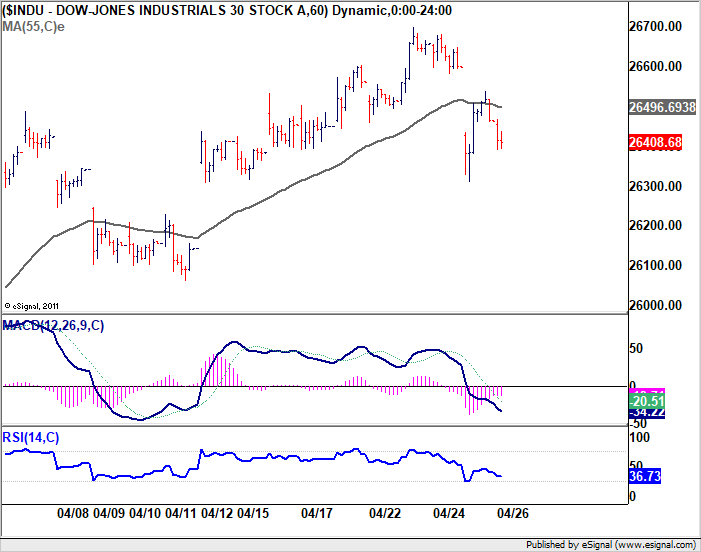
 US stocks also open the day slightly lower. At the time of writing, DOW is down -0.2%. S&P 500 down -0.23%. NASDQ down -0.62%. For now, DOW is staying above yesterday's low at 26310.26 and remains safe. But break of this support could trigger some downside acceleration before weekly close.
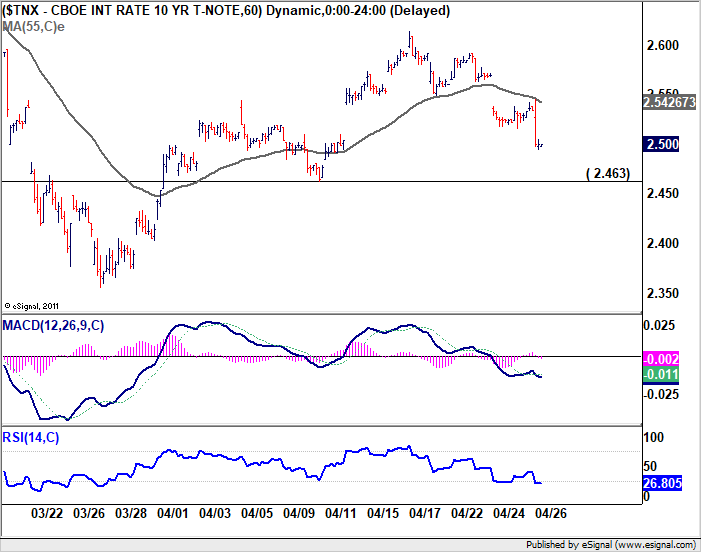
 Decline in 10-year yield is must more seriously, with 2.5 handle now looks very vulnerable. 2.463 is a key support level to defend ahead. Break will likely resume larger fall from 3.248 through 2.356 low.
US: GDP Growth Not Quite as Strong in Q1 as Headline Suggests
Inventories and net exports made sizeable contributions to overall GDP growth in Q1. With price pressures muted, the Fed probably won't be raising rates anytime soon, stronger-than-expected growth notwithstanding.
Some Temporary Factors Lift Overall GDP Growth
U.S. real GDP grew at an annualized rate of 3.2% in Q1-2019 relative to the previous quarter (top chart). Not only was the headline rate of growth stronger than most analysts expected, but it also represents a pick-up in growth relative to the 2.2% rate of growth that the economy registered in the fourth quarter. That said, the underlying details were not quite as strong as the headline rate of growth suggests.
For starters, there was a sizeable build of inventories ($128 billion at an annualized rate), which added 0.7 percentage points to topline GDP growth. Given the lackluster rate of domestic final spending (see below), some of this inventory build likely was unintentional. Therefore, inventory accumulation should fall back in coming quarters, which will exert a headwind on the overall rate of GDP growth at that time. Second, net exports added 1.0 percentage point to the overall rate of growth, which is among the largest positive contributions this component has made in this cycle (middle chart). Although exports grew at a modest rate of 3.7%, imports fell 3.7%. Given continued growth in domestic demand, real imports likely will rebound in coming quarters, which also will exert a drag on growth.
As noted above, domestic demand continued to grow in the first quarter, albeit at a modest pace. Real personal consumption expenditures (PCE) rose only 1.2% in Q1, and fixed investment spending was up only 1.5%. Indeed, final sales to private domestic purchases—a measure of the underlying strength of the domestic economy—rose just 1.3%, which is the slowest rate of growth in this component in nearly six years. That said, final domestic spending should accelerate somewhat in coming quarters. Real PCE ended the first quarter on a strong note, which gives it momentum heading into Q2, and durable goods orders data for March, released yesterday, suggest that capital spending could be picking up. Although the economy may not have been as strong in the first quarter as the headline GDP growth rate suggests, the economy is not in danger of stalling anytime soon.
Price Pressures Remain Muted
In our view, today's stronger-than-expected GDP print does not materially change the outlook for Fed policy, at least in the near term. That is, the FOMC likely will refrain from raising rates for the foreseeable future. First, the underlying details were not as strong as the headline rate of GDP growth suggests. Second, the core PCE deflator rose at an annualized rate of just 1.3% in the first quarter. Consequently, this measure of consumer prices was up just 1.7% on a year-over-year basis in the first quarter (bottom chart). With the Fed's preferred measure of consumer price inflation remaining below its objective of 2%, it seems likely that the FOMC will be happy to remain on the sideline watching the incoming data.
Sunset Market Commentary
Markets
Both German and US bonds oscillated around opening levels during a subdued trading session that saw markets sidelined ahead of today’s US GDP figures. Growth surpassed expectations by a landslide, printing at 3.2% QoQ annualized (up from 2.2% last quarter) vs. 2.3% expected. However details showed a rather meagre contribution from private consumption, the US economy’s backbone. Volatile components such as inventory buildup and especially net exports were this quarter’s strongholds. German and US bonds showed a similar market reaction with moves obviously more outspoken in the latter: slipping on the headline but recovering and even gaining shortly after as growth contributors were scrutinized. The US yield curve bull steepens with changes varying from -5bp (2-yr) to ‑3bp (30-yr). The German curve bull flattens as short term rates are roughly stable while the 10-yr yield slips about 1 bp. Peripheral spreads over Germany narrow up to 2 bps in Portugal and Spain. Italian bonds show remarkable strength ahead of tonight’s S&P rating review (BBB with negative outlook), causing the spread to narrow 4 bps.
There was no news at all to guide EUR/USD trading this morning. The pair was paralyzed in a tight range in the 1.1130/40 area. The dollar spiked briefly higher upon the release of better than expected headline US Q1 growth. However, the move was immediately reversed as USD investors became aware of the rather disappointing composition of the growth mix. EUR/USD is currently trading in the 1.1150 area. The dollar thus trades marginally weaker against the euro compared to yesterday’s close, but the pair holds below previous 1.1177/87 support area. USD/JPY spiked to retest the 112 big figure, but currently trades again in the 111.65 area. The Q1 growth report won’t be a game changer for USD trading.
Today, sterling also showed no clear trend. EUR/GBP hovered in a tight range near 0.8630. UK CBI order data and business confidence showed a mixed picture. Confidence in the industry improved from -23 to -13 on April, but expectations for exports orders were at a post-crisis low. The report had little impact on sterling trading. The government will continue Brexit talks with labor next week, but there are no concrete indications on whether/how the Brexit impasse will be solved. EUR/GBP is trading in the 0.8630 area. Cable tries to regain the 1.29 as the dollar is losing slightly ground after the Q1 GDP release.
News Headlines
The Bank of Russia today as expected kept its key interest rate unchanged at 7.75%. The bank indicated that if the situation develops as expected, it might turn to cutting the rate in Q2-Q3 2019. USD/RUB was steady following the central bank decision but is losing territory after the US GDP release.
At the SNB’s annual shareholder meeting, Chairman Jordan said that abandoning the negative interest rate in the current environment would weigh heavily on the Swiss economy and would cause the franc to appreciate. He reiterated that risks to financial stability will have to be addressed with focused macro-prudential measures.
Dollar whipsaws following strong US Q1 GDP
- GDP – Headline beat does not tell whole story
- XI – Confirms trade deal is nearing
- Oil – Short-term top in place
- Gold- Sinks following solid GDP reading
GDP
3.2%! The US economy grew at 3.2%, much higher than 2.3% consensus, and well above the 1.0% to 2.9% range. It is a blockbuster number, but the components told a different story and with the dollar wrapping a solid week, we should not be surprised seeing a reversal following the release.
Net trade inventories and inventories were responsible for half the gains of GDP and Core PCE came in softer at 1.3%, well below the Fed’s target of 2.0%. The complete story paints a mixed picture, with many believing the US economy, with the exception of the labor market is still slowing down.
USD: The dollar is now softer following the GDP report and we could see many investors unwind their bullish bets following the recent runup.
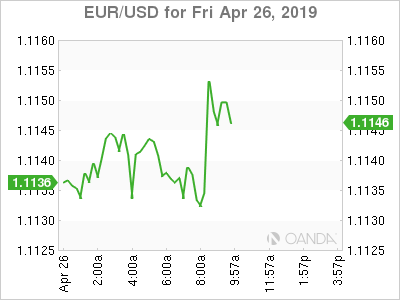
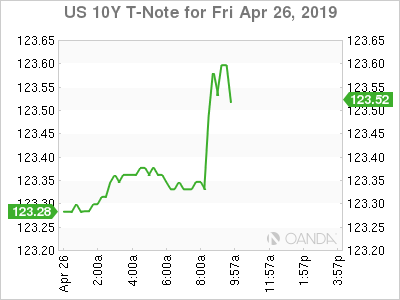
Treasury yields initially spiked higher but have reversed sharply following US GDP. The 10-year yield dances around the 2.500% level.
Fed Fund futures had an interesting reaction following the 8:30am releases. The strong GDP reading along with falling consumption and slightly softer inflation reading have increased rate cut expectations slightly for later in the year. Expectations are at 25% for a rate cut at the June meeting and 50% at the September meeting.
XI
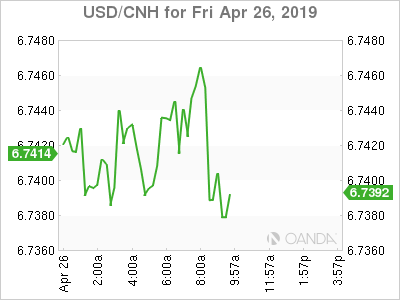
President Xi delivered personal commitments that China will deliver on several key trade deal issues with the US at his speech at the Belt and Road Forum in Beijing. China will deliver a new foreign investment law that will protect foreign companies from forced technology transfers, remove rules that support unfair competition, no more yuan depreciation and opening up China to further foreign investments.
Trade negotiations pick up again in Beijing next week and it appears we are inching closer to a final deal that is looking more likely to happen in May.
The yuan rallied on the last trading day of the week after central bank set the daily reference rate much stronger than what was expected.
Oil
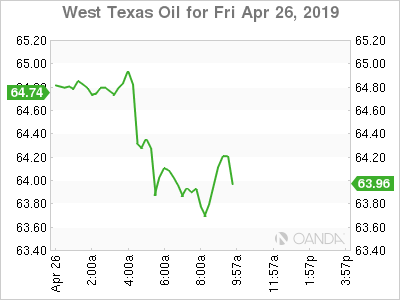
Crude prices were unable to keep the recent rally going despite a Russian pipeline outage. Details on how long the outage will last are unknown, but it appears crude prices are taking a breather here. Russia has not disclosed any plans on fixing the organic chloride problem, but that could change today when they meet with representatives from Belarus, Poland, and Ukraine.
The over 40% rally in oil prices were mainly attributed to the success of the OPEC + production cuts, sanctions on Iranian crude, slower velocity in the increase of US production, and easing of global growth concerns in the US and China. Some of those key drivers however are changing. Saudi Arabia will need to stop over complying with their production cuts to make up for the Iranian shortfall. Russia’s compliance may be waning. US production is expected to continue to accelerate in the warmer months. Europe continues to drag down global growth, but this may be short-lived.
The oil rally may be ready for a stronger pullback after Brent failed to hold the $75 a barrel. The recent surge accelerated once price broke above $70 a barrel, but now it appears recent bullish catalysts have failed to accelerate the move higher.
Gold
The precious metal initially gave up most of its gains after a much better than expected first quarter GDP reading, but followed the general reversal that hit all the asset classes. Gold is still on target to muster up a 3-day rally here. It will be hard for gold prices to continue to stabilize here if the US economy remains this strong.
Goldman Sachs slashed their gold forecasts, but still remain bullish. The 3-month forecast was lowered $50 to $1,300 and the 12-month target fell $75 to $1,375 an ounce.