

Sample Category Title
Active Bitcoin Trading Strategy Generated Over 100% Return In A Year
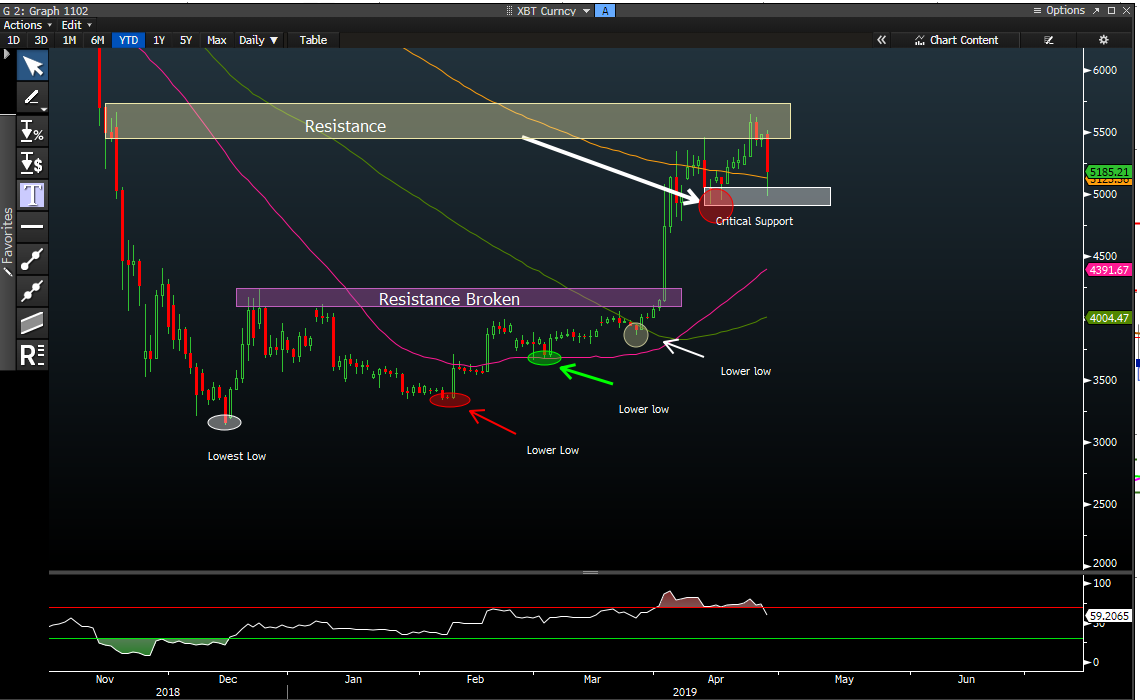
Bitcoin price has started to tumble once again, thanks to another scam performed by Tether. We are seeing an intensive sell-off today and the crypto king is down nearly 5 and a half percent or $300 approximately. Do we need to worry about this?
Well, looking at the daily chart it appears that the price is in a constant battle with the 200-day moving average. Since April 4, we have seen several attempts where the big comprise tried to stay above this critical average. The recent sell-off pushed the price below this average and if we close below this it would send a bearish signal. Having said this, the game isn't over yet for the bulls. The reason that I am saying this is because the price is trading well above the 50 and 100 day moving averages. As long as the price stays above them, we have a strong hope for the bull rally to continue and the price can target the $6,000 to $6,500 mark.
So the question is what is the best strategy for active traders?
It is always best to keep things simple. For this particular reason, I am focusing on a simple moving average. On a 60-minute time frame, the 210-day moving average has worked pretty well. The strategy is: open a long position when the price crosses above the 200-day moving average, and close the long position and open a short position when the price crosses below this moving average. In order to factor in the slippage and brokerage commissions, the long and short trades only open on the next candle after the price crosses above or below the moving average.
There were several important factors for me to consider before I selected this moving average. The factors that I paid the most amount of attention are: percentage of winning trades, percentage of losing trades, profit factor, and percentage of maximum drawdown. The 210-day moving average has the lowest maximum drawdown percentage. The purpose is to keep this number as low as possible. This is because a bigger number opens the portfolio to a major risk.
To make the strategy more robust, I performed the backtest over a period of one year from April 2018 to April 2019. During this period there were 141 trades, 25 winning and 116 losing trades. I had 15 winning trades on the long side and 10 winning trades on the short side. Similarly, there were 55 losing trade on the long side and 61 losing trades on the short side. An important element which needs attention is that the strategy has generated over 100 percent return despite the fact that I had over 82 percent of losing trades. The percentage of losing trades was 82.27 while the percentage of winning trades was 17.73. This gave us a profit factor of 1.83.
In other words, the reason that this strategy performance was over 101.3 percent is mainly that the average win on the long side is $7.12K while the average loss on the long side is $1.18K. Similarly, the average rain on the short side set at $11.73K while the average loss on the short side is only $947.
In summary, the 210-SMA has an extremely good track record and it is worth looking if one is interested in active trading.
Gold Pushing Against $1,280
Europe lower as earnings season comes into focus
It's been a slightly negative end to the week in Europe, with indices marginally in the red, while US futures are once again looking mixed as we await more earnings reports.
Earnings is very much front of mind right now, with central banks around the world having adopted a far more dovish approach in anticipation of a slowdown and some countries in Europe either in or bordering on recession. The US has got things off to a strong start against quite low expectations which has lifted equity markets there into record closing territory. The challenge is likely to be greater across Europe though, as the next few weeks may highlight.
Two banks that have suffered greatly over the last decade – RBS and Deutsche Bank – are the worst performers in their respective indices on Friday after they saw their share price slide in early trade despite reporting stronger than expected profits for the first quarter. RBS came under pressure after warning about the impact of Brexit uncertainty on the outlook while Deutsche's results come at the end of a rotten week for the bank as it abandoned merger talks with Commerzbank.
The Spanish IBEX is one of the worst performers in Europe this morning ahead of the general election this weekend that is expected to deliver no majority government, which means potentially weeks of negotiations before the formation of another coalition government.
Oil looking overstretched
Oil prices are spending a third day in the red, coming off the highs that were reached earlier in the week after the US announced it would not extend waivers on oil imports from Iran, which had previously been afforded to eight countries. This was an unexpected development and triggered another rally in oil prices as traders weighed up the impact of up to a million barrels of oil disappearing, clearly not buying the line that the US, Saudi Arabia and UAE would fill the gap.
Inventory data will have contributed to declines of the last few days, with API and EIA both reporting large increases in stocks. Still, both WTI and Brent remain in a good position, although they are looking a little overstretched to the upside at this point. The last couple of peaks have come amid slowing momentum which is typically a red flag and may indicate a correction in prices.
Gold pushing against $1,280
Gold is trading higher for a third day and is pushing against potentially key resistance. It took a four months and numerous efforts before $1,280 gave way which was viewed as potentially a very bearish development but since then, the bears have struggled to really take hold. We're now seeing this being tested from below for a third time and gold bulls may be having some success.
We're trading slightly above $1,280 at the minute and if we end the week above here, bulls may be encouraged. That said, until we break above $1,310, we remain in a downtrend and while $1,280 would be a quick blow to gold bears, it doesn't change this fact. $1,260 remains a key support level to the downside.
GBPUSD Attempting To Correct
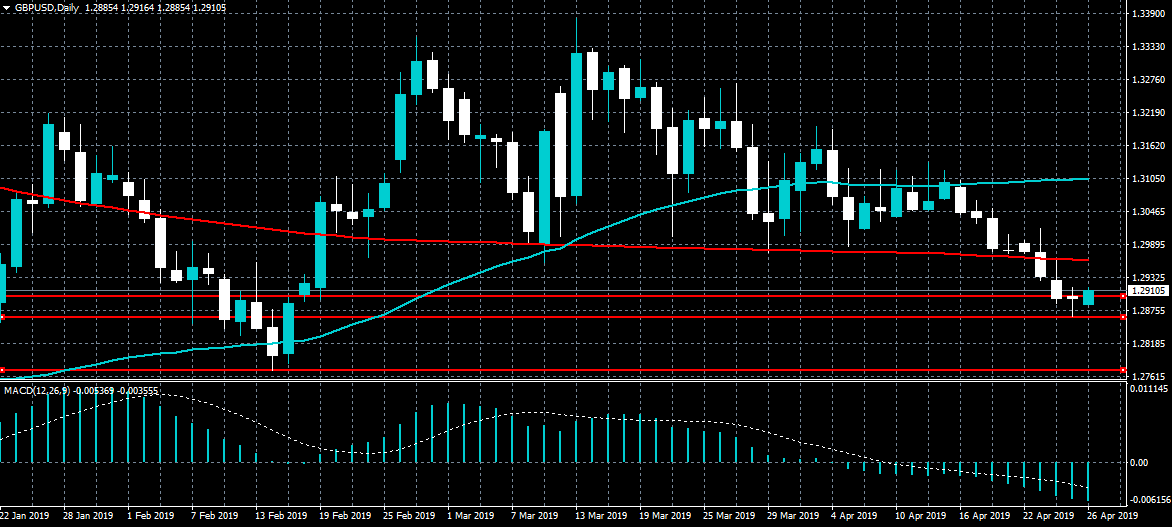
The British pound is attempting to correct higher against the US dollar on Friday after finding strong technical support from the 1.2865 level. The GBPUSD pair could start to correct back towards the 1.2960 level if bulls can stabilize price above the 1.2900 level. If the GBPUSD pair trades back under the 1.2900 support level, sellers may test back towards the 1.2865 support level.
The GBPUSD pair is only bearish while trading below the 1.2960 level, key support is found at the 1.2900 and 1.2865 levels.
If the GBPUSD pair trades above 1.2900 level, key intraday resistance is found at the 1.2960 and 1.2975 levels.
USDJPY 111.80 Upcoming Resistance
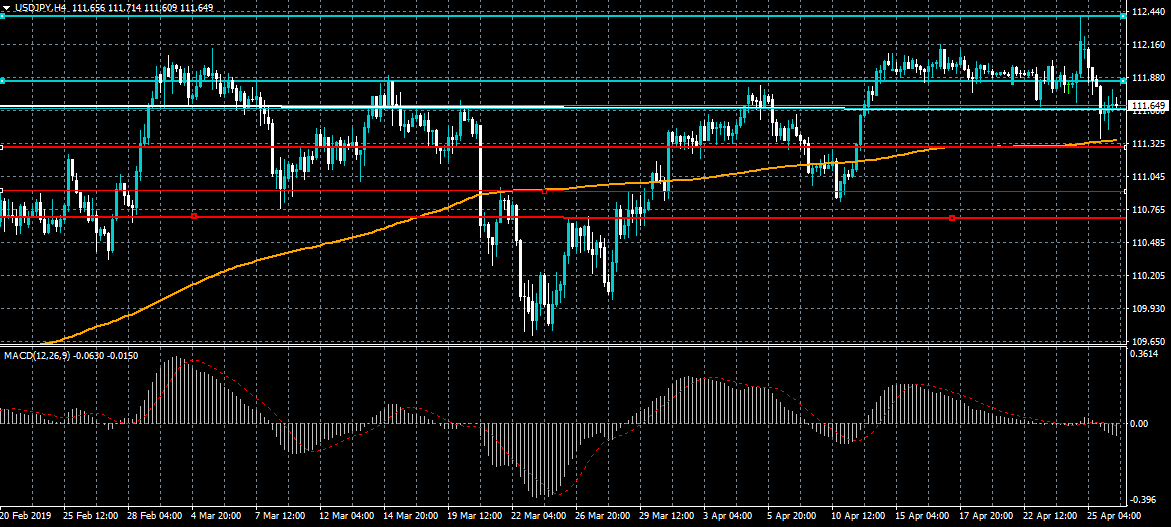
The US dollar is attempting to correct higher against the Japanese yen currency after finding strong technical support from the 111.30 level. The USDJPY pair is attempting to correct higher, with the 111.80 level the strongest form of near-term resistance. The MACD indicator on the four-hour time frame is still bearish and pointing to further downside.
The USDJPY pair is only bullish while trading above the 111.60, key intraday resistance is found at the 111.80 and 112.40 levels.
If the USDJPY pair trades below the 111.60 level, key intraday support remains at the 111.30 and 110.90 levels.
EUR/USD Could Trade Sideways
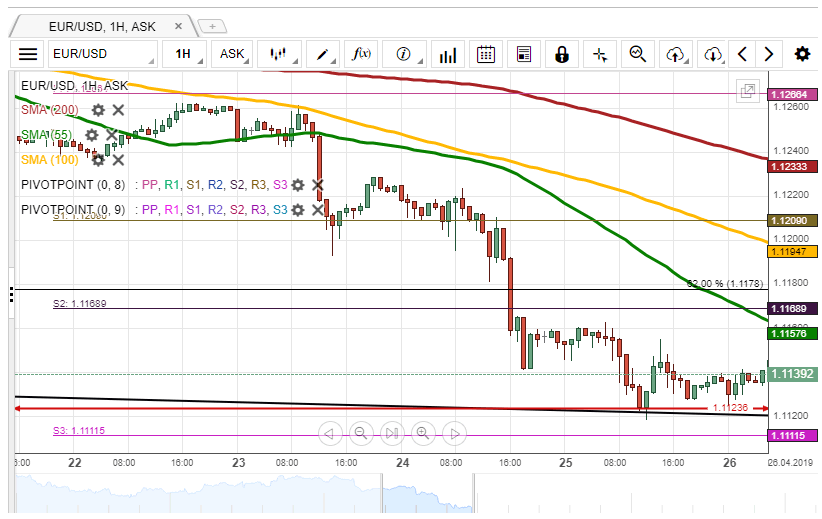
On Thursday, the EUR/USD exchange rate declined to the lower boundary of the medium-term descending channel at 1.1120. During Friday's morning, the rate started trade up.
It is expected, that some upside potential could prevail in the market. However, important resistance cluster to look out for is a combination of the 55-hour SMA, the weekly S2 and the Fibo 62.00% in the 1.1160/1.1178 range.
On the on the other hand, the currency pair could trade sideways around the psychological level at 1.1140, supported by the lower channel line and the weekly S3 located at the 1.1112 mark.
GBP/USD Pressured By 55-Hour SMA
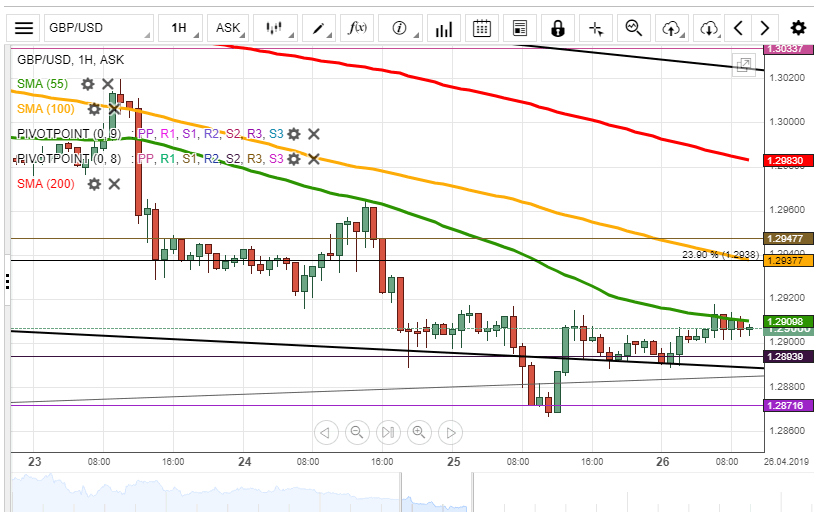
Yesterday, the GBP/USD currency pair reversed north from the lower boundary of the falling wedge pattern at 1.2880. During today's morning, the pair tested the resistance of the 55-hour SMA at 1.2910.
If the given simple average holds, it is likely, that the exchange rate reverses south and re-rests the lower pattern line. It is unlikely, that a breakout south could occur, as the pair is supported by the monthly S1 at 1.2872.
If the given resistance level does not hold, it is expected, that some upside potential prevails in the market. However, the rate has to surpass the resistance level formed by the 100-hour SMA, the Fibo 23.90% and the weekly S1 at 1.2947.
USD/JPY Tested Weekly S3
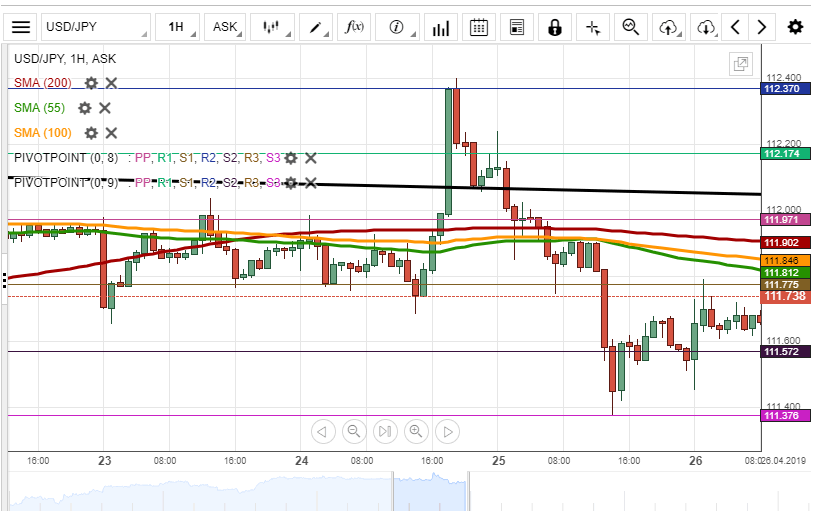
During the previous trading session, the USD/JPY currency pair dropped to the weekly S3 at 111.38 and reversed north.
On the one hand, the pair could trade sideways in the short term, as it is squeezed by the weekly S1 and S2, located at 111.78 and 111.57 respectively.
On the other hand, given that the exchange rate is pressured by the 55-, 100– and 200-hour SMAs, bears could prevail in the market. A possible downside target is the weekly S3.
It is unlikely, that the rate could jump higher than 111.97 due to the resistance of the given moving averages and the weekly PP.
XAU/USD Could Go Upwards
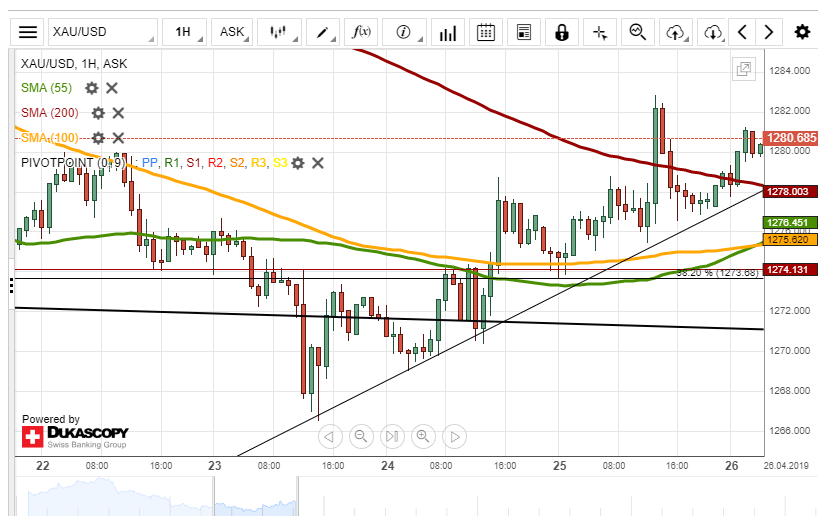
On Thursday, the XAU/USD exchange rate surpassed the 200-hour SMA and reached the psychological level at 1,282.00.
From a theoretical point of view, it is likely, that the rate trades upwards, as it is supported by the ascending trend line located in the 1,280.00/1,284.00 range. A possible upside target is the psychological level at 1,285.00.
In case, bears would prevail in the market, the price for gold could decline to the support level formed by a combination of the 55– and 100-hour SMAs located circa the 1,276.00 mark.
Pause In USD
Pause in USD
FX markets have paused their aggressive demand for USD. Perhaps there is trepidation ahead of today’s release of the first estimate of US 1Q GDP. Assessments of economic activity in 1Q have shifted widely in the last couple of months, reflecting changing views on consumer spending and outlook for global trade. Markets are forecasting an increase of 1.8%, yet balance is for an upside surprise in our view. While this growth read will be the slowest in nearly two years, it remains a solid number. Deeper slowdowns will have analysts quickly point to the flat yield curve and calling for late 2019, early 2020 recession. However, in our view, there needs to be a shock to the labor markets, which paralyze consumer spending before considering consecutive quarters of negative GDP growth. Low unemployment at 4.0% and a steady improvement in wage growth (accelerated from 3.4% to 3.8% over the last year) will protect from temporary shocks. However, the strong labor market also creates a risk, should regular restructuring of blotted headcount, triggers wider layoff worries. Yet, even this feels a distant risk. In the current macro backdrop, we remain constructive on the USD against G10 based on the solid economic outlook, corporate earnings driving stocks and wide interest rate differentials.
While in the EU, concern near term will likely be on the Spanish general election. Spanish parliament will likely become further fragmented with the balance of power shifting to the socialist PSOE. Despite heavy short Euro positioning, improvement in eurusd is unlikely without a fundamental shift.
Kiwi in gain as trade data surprise
After plunging more than 1.36% in the past three days against the greenback due to disappointing consumer inflation figures from its Australian counterpart and having faced a similar drawdown earlier, the New Zealand dollar is reversing the trend, bouncing against major G10 currencies as Reserve Bank of New Zealand (RBNZ) Governor Adrian Orr speech eased fears of growth slowdown. Furthermore, March trade surplus came highest in eight years, which gave currency traders good reasons to start a bullish turn – but risk of further drop is very likely.
Although a monthly trade surplus of NZD 922 million (consensus: 131 million) largely surprised to the upside with exports up 19% (NZD 899 million) and imports down 3.50% (NZD 174 million) compared with March 2018, it appears that the recent bounce is more of a special case. China’s imports of milk, logs, beef and lamb increased by 52% compared to prior year while 12-months exports accelerated by 20.80%, suggesting that trade with top export partners are improving. Yet despite a healthy labor market, April consumer confidence at 13-months high and a solid fiscal situation, it is very likely that the RBNZ will be following RBA’s footsteps by cutting its official cash rate by 25 bps during its 8 May 2019 monetary policy meeting. Headline inflation came at 1.50% in March, dropping from 1.90% in February.
As trading is currently limited in Australia and New Zealand due to bank holidays, we expect both the Aussie and Kiwi to remain under the influence of upcoming US GDP data while further declines are probable ahead of central bank policy meetings. Currently trading at 0.6651, NZD/USD is heading along 0.6620 short-term.
The Analytical Overview Of The Main Currency Pairs
The EUR/USD currency pair
Technical indicators of the currency pair:
Prev Open: 1.11513
Open: 1.11294
% chg. over the last day: -0.17
Day's range: 1.11242 – 1.11470
52 wk range: 1.1141 – 1.2211
EUR/USD retains its bearish mood. Right now the quotes are at the 1.11200-1.11600 range. The demand for USD remains high due to a positive durable goods report from the US. The financial market participants are waiting for the US GDP report for the first quarter of 2019. The experts forecast that the economy growth in the US will slow down from 2.2% to 2.0%. Consider the difference between the real and forecasted events and open positions from these levels.
At 15:30 (GMT+3:00) we expect the US GDP report.
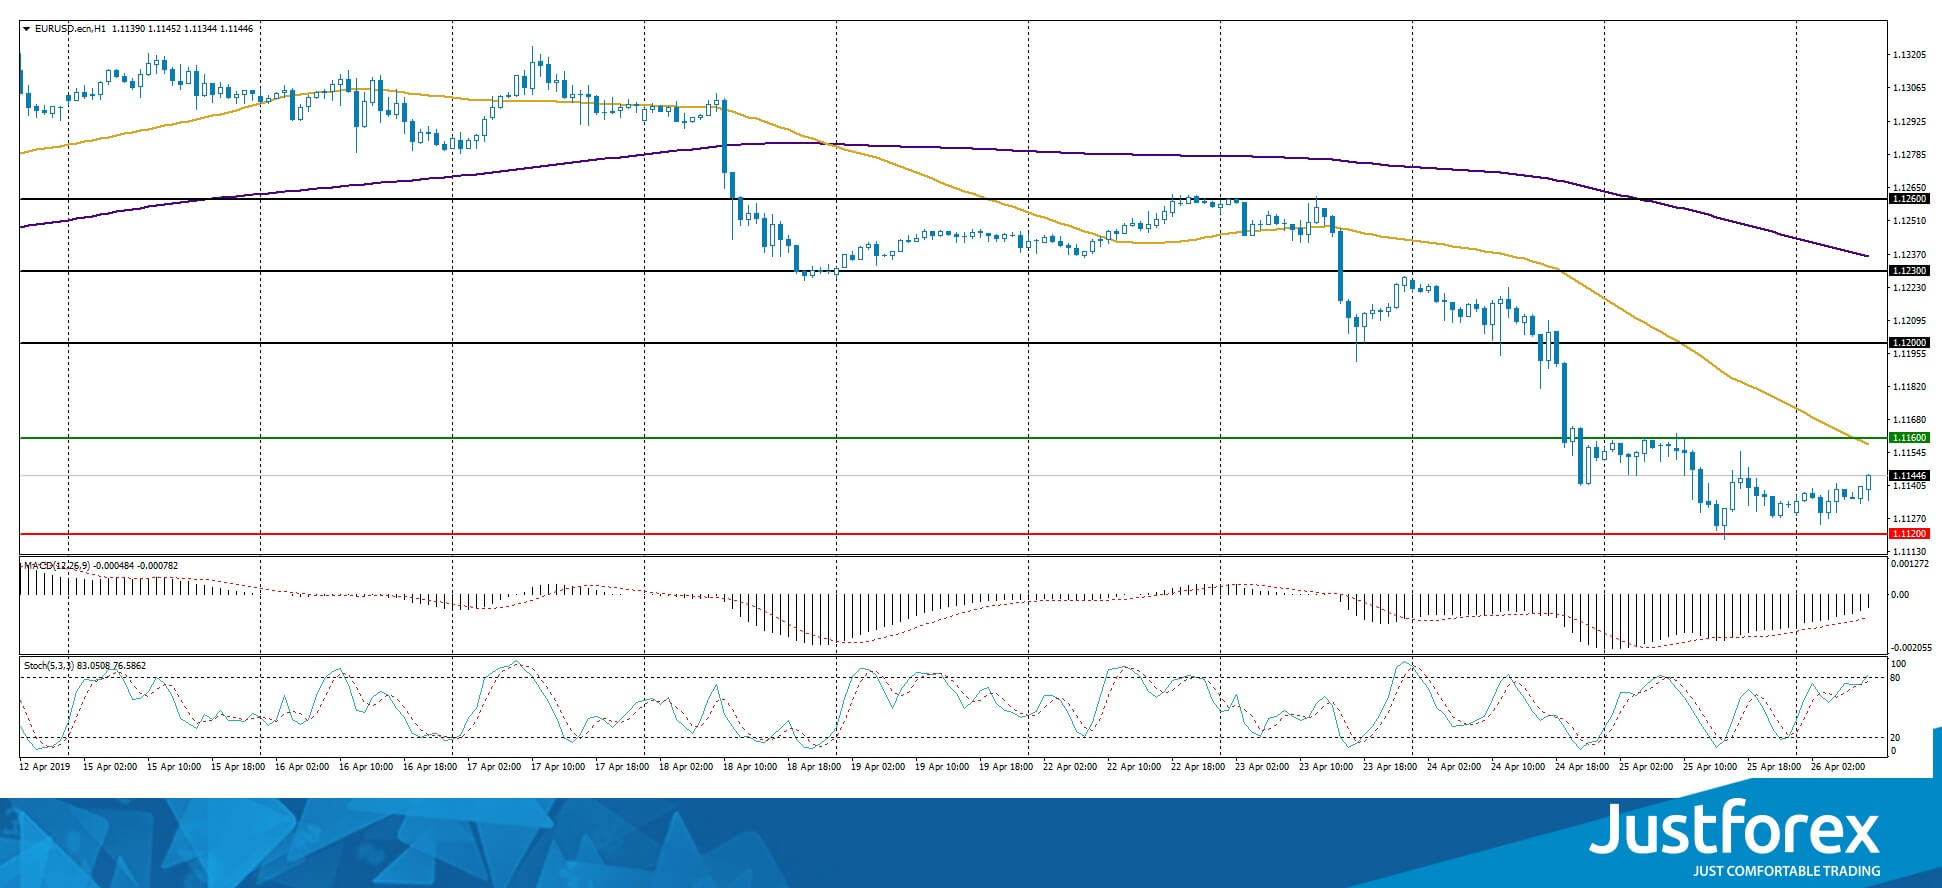
The price fixed below 50 MA and 200 MA which points to the power of the buyers.
The MACD histogram is in the negative zone but above the signal line which gives a weak signal to sell EUR/USD.
The Stochastic Oscillator is near the overbought zone, the %K line is above the %D line which gives a weak signal to buy EUR/USD.
Trading recommendations
Support levels: 1.11200, 1.11000
Resistance levels: 1.11600, 1.12000, 1.12300
If the price fixed below 1.11200, expect further descend toward 1.10800-1.10600.
Alternatively, the quotes can recover toward 1.12000.
The GBP/USD currency pair
Technical indicators of the currency pair:
Prev Open: 1.29031
Open: 1.28884
% chg. over the last day: -0.06
Day's range: 1.28877 – 1.29173
52 wk range: 1.2438 – 1.4378
GBP/USD stabilized aftera long fall in the last two weeks. Right now GBP is testing the local support and resistance levels at 1.28900 and 1.29200. The investors are waiting for additional drivers. You should keep an eye on Brexit. A technical correction is possible soon. You should open positions from the key levels.
The Economic News Feed for 26.04.2019 is calm.
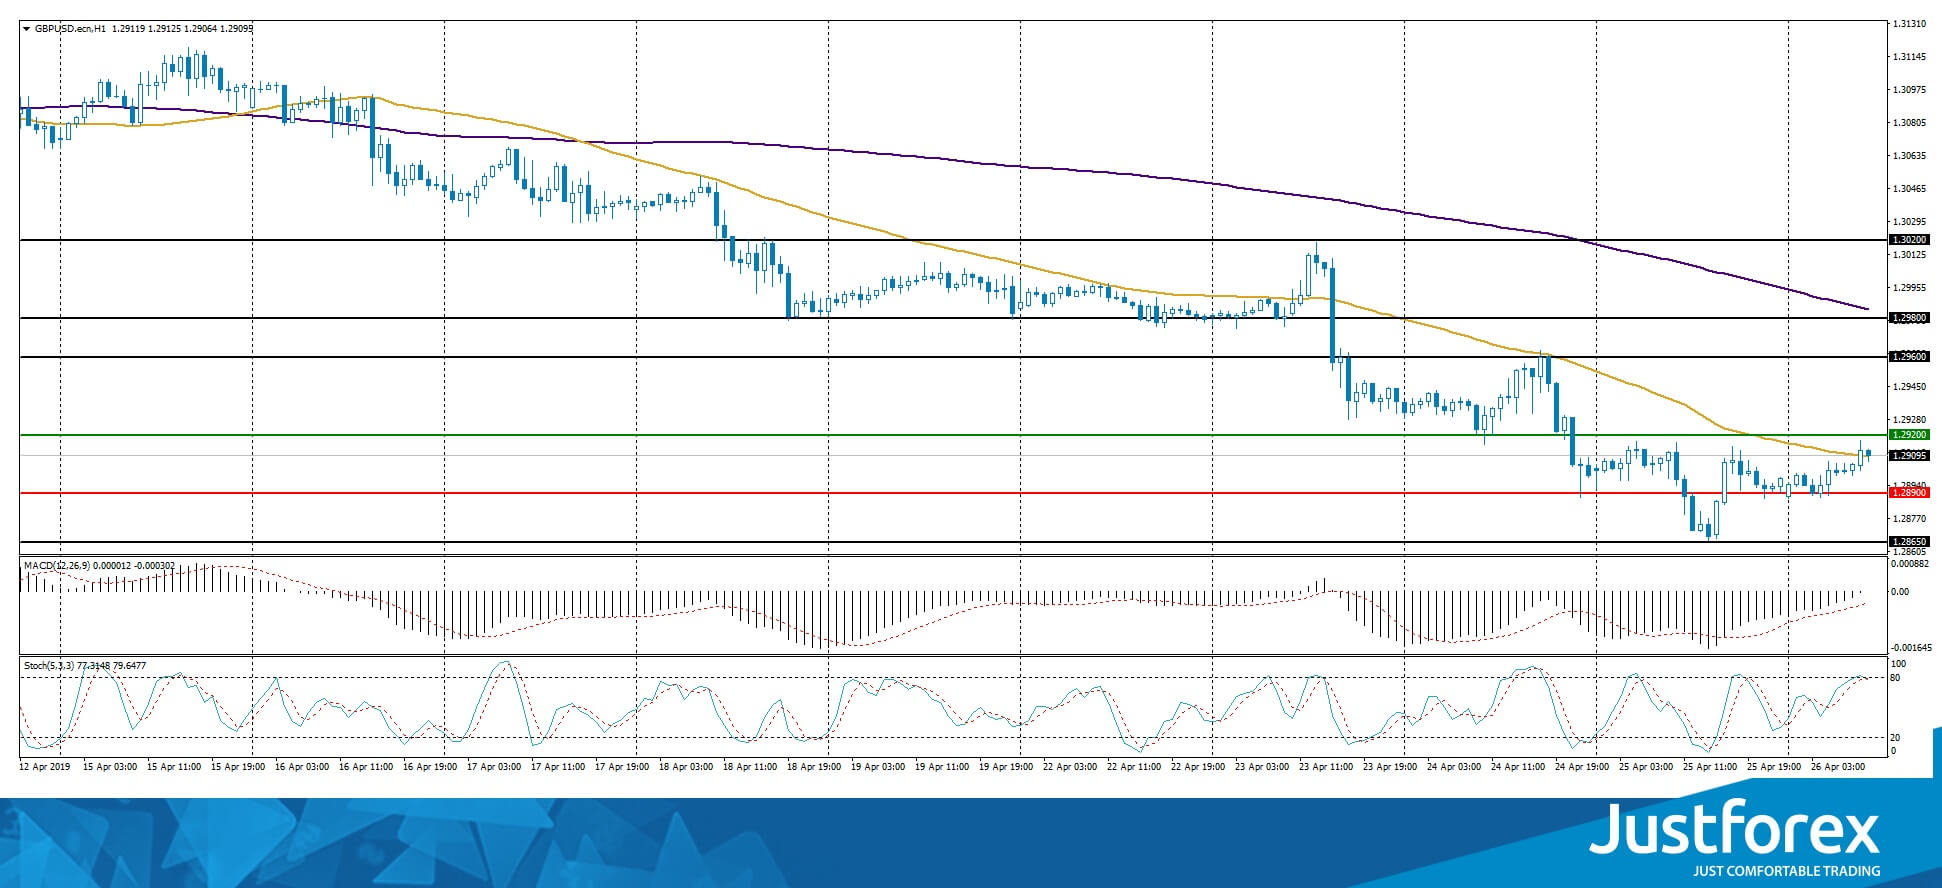
The indicators do not provide precise signals, the price has crossed 50 MA.
The MACD histogram is close to 0.
The Stochastic Oscillator is near the overbought zone, the %K line has crossed the %D line. There are no signals at the moment.
Trading recommendations
Support levels: 1.28900, 1.28650
Resistance levels: 1.29200, 1.29600, 1.29800
If the price fixes below 1.28900, expect further descend towards 1.28650-1.28400.
Alternatively, the quotes can recover toward 1.29600-1.29800.
The USD/CAD currency pair
Technical indicators of the currency pair:
Prev Open: 1.34841
Open: 1.34842
% chg. over the last day: +0.01
Day's range: 1.34805 – 1.34864
52 wk range: 1.2248 – 1.3664
USD/CAD stabilized after a long rally since the beginning of the week. The technical picture remains ambiguous. The local support and resistance levels are 1.34600 and 1.34900. A technical correction is possible soon. The investors are waiting for the US GDP report. Keep an eye on the oil quotes dynamics and open positions from the key levels.
The Economic News Feed for 26.04.2019 is calm.
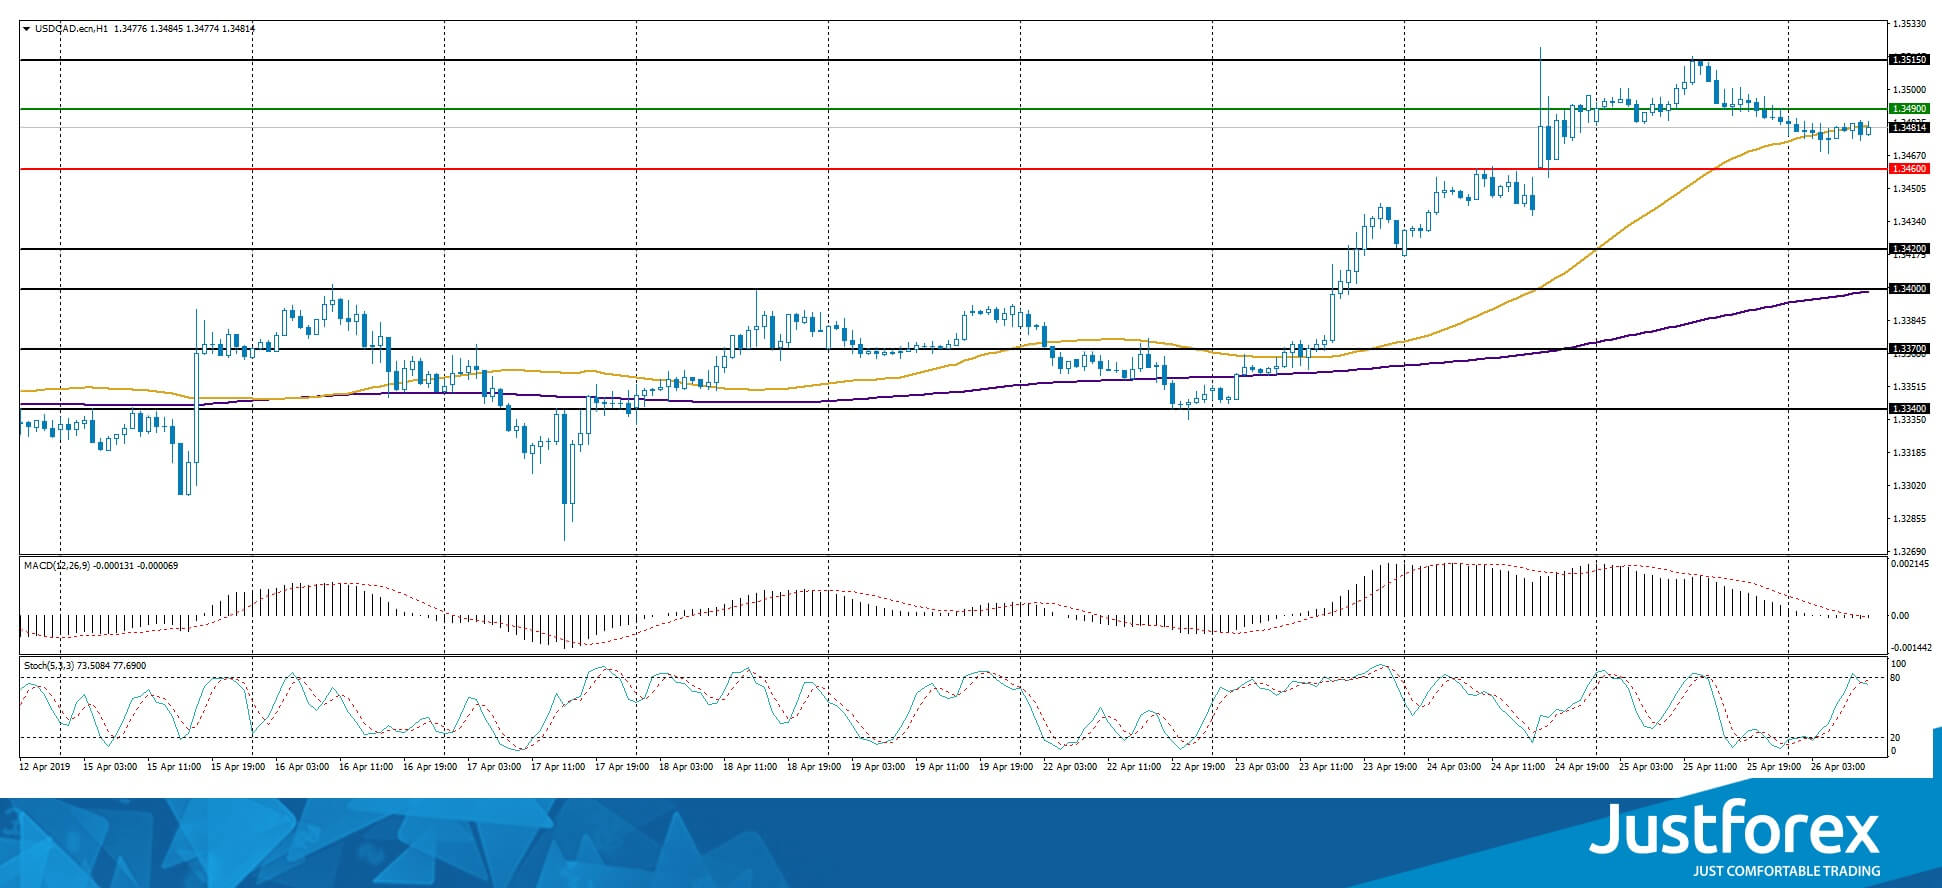
The indicators do not provide precise signals, the price has crossed 50 MA.
The MACD histogram is close to 0.
The Stochastic Oscillator is near the overbought zone, the %K line has crossed the %D line. There are no signals at the moment.
Trading recommendations
Support levels: 1.34600, 1.34200, 1.34000
Resistance levels: 1.34900, 1.35150
If the price fixes above 1.34900, consider buying USD/CAD, since the price will move toward 1.35200-1.35500.
Alternatively, the quotes can correct toward 1.34300-1.34000.
The USD/JPY currency pair
Technical indicators of the currency pair:
Prev Open: 112.136
Open: 111.594
% chg. over the last day: -0.57
Day's range: 111.449 – 111.786
52 wk range: 104.56 – 114.56
USD/JPY shows an agressive sales. The quotes fell by 50 points and updated the local minimums. Right now the safe haven currency is consolidating around 111.550-111.800. USD/JPY has a tendency to descend further. Keep an eye on the US GDP report and open positions from the key levels.
Today during the asian trading session Japan published an array of weak economic reports.
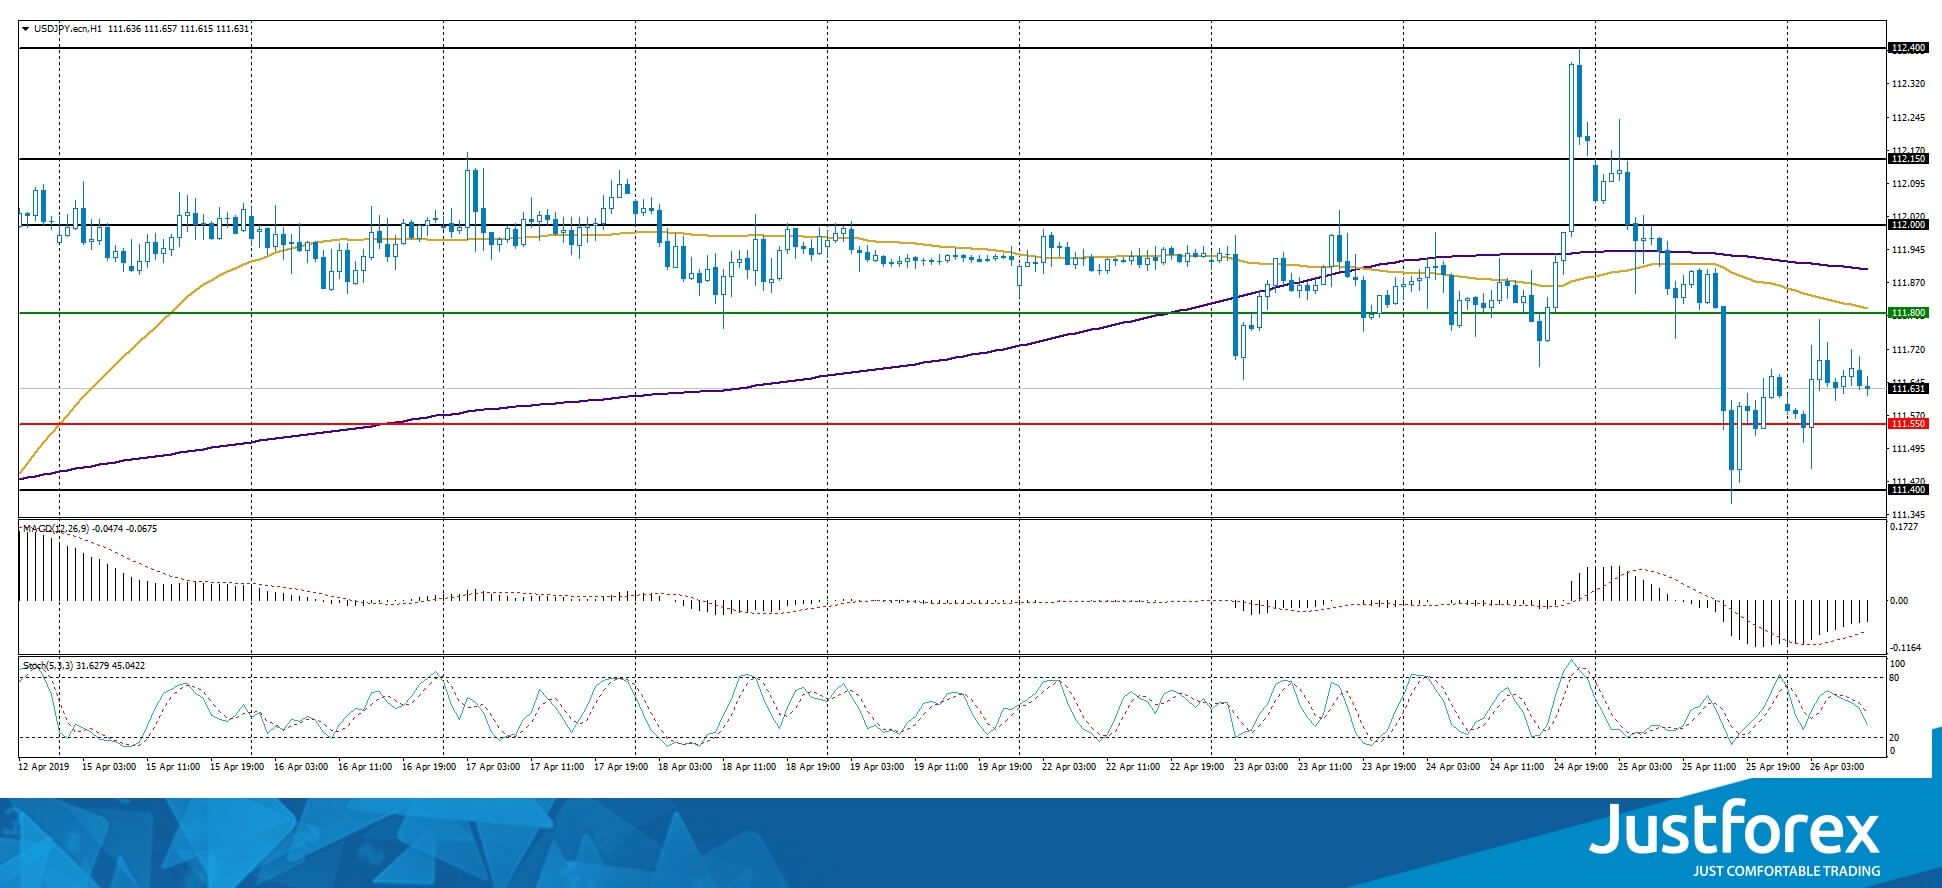
The price fixed below 50 MA and 200 MA which points towards a bearish mood.
The MACD histogram fixed in the negative zone but above the signal line which gives a weak signal toward selling USD/JPY.
The Stochastic Oscillator is in the neutral zone, the %K line is below the %D line, which points toward a bearish mood.
Trading recommendations
Support levels: 111.550, 111.400, 111.000
Resistance levels: 111.800, 112.000, 112.150
If the price fixes below 111.550, expect further descend toward 111.300-111.200.
Alternatively, the quotes can grow toward 112.000-112.150.