

Sample Category Title
UK’s Retail Sales Advanced To Its Highest Level In 2.5 Years In March
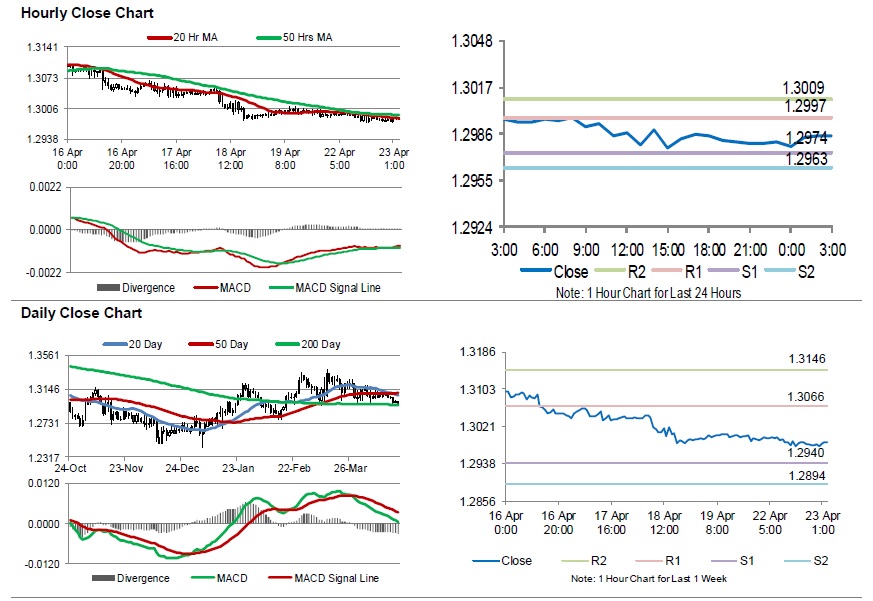
For the 24 hours to 23:00 GMT, the GBP declined 0.09% against the USD and closed at 1.2981.
Data revealed that UK's retail sales unexpectedly climbed 6.7% on a yearly basis in March, hitting a 2.5-year high level and compared to a rise of 4.0% in the previous month. Market participants had envisaged retail sales to record a rise of 4.5%.
In the Asian session, at GMT0300, the pair is trading at 1.2985, with the GBP trading marginally higher against the USD from yesterday's close.
The pair is expected to find support at 1.2974, and a fall through could take it to the next support level of 1.2963. The pair is expected to find its first resistance at 1.2997, and a rise through could take it to the next resistance level of 1.3009.
With no macroeconomic releases in UK today, investors would look forward to global macroeconomic releases for further direction.
The currency pair is showing convergence with its 20 Hr moving average and trading below its 50 Hr moving average.
Japan’s National Consumer Price Index As Estimated In March
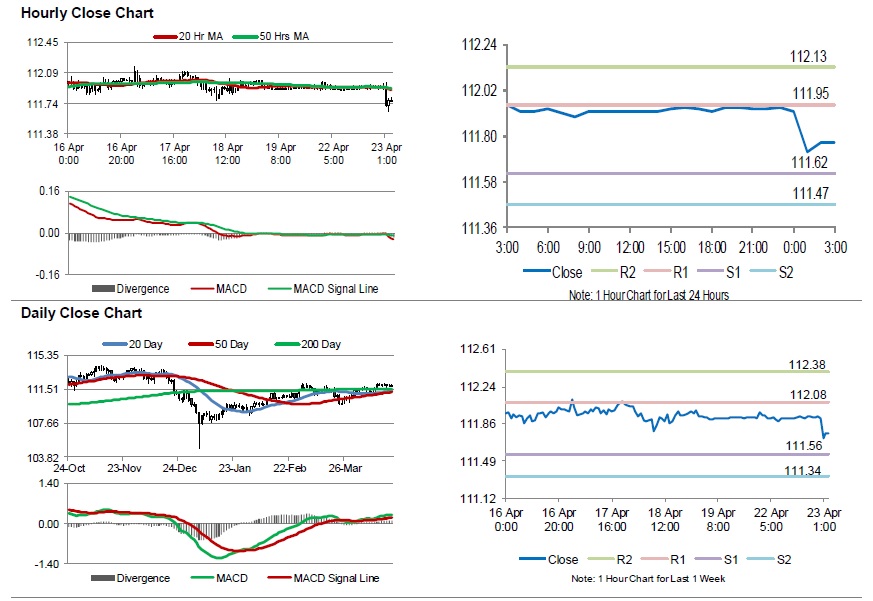
For the 24 hours to 23:00 GMT, the USD slightly declined against the JPY and closed at 111.94.
Data showed that Japan's national consumer price index (CPI) rose 0.5% on an annual basis in March, at par with market expectations. In the prior month, the CPI had recorded a rise of 0.2%.
In the Asian session, at GMT0300, the pair is trading at 111.77, with the USD trading 0.15% lower against the JPY from yesterday's close.
The pair is expected to find support at 111.62, and a fall through could take it to the next support level of 111.47. The pair is expected to find its first resistance at 111.95, and a rise through could take it to the next resistance level of 112.13.
Looking forward, traders would await Japan's machine tool orders for March, slated to release in a while.
The currency pair is trading below its 20 Hr and 50 Hr moving averages.
Switzerland’s Trade Surplus Narrowed In March
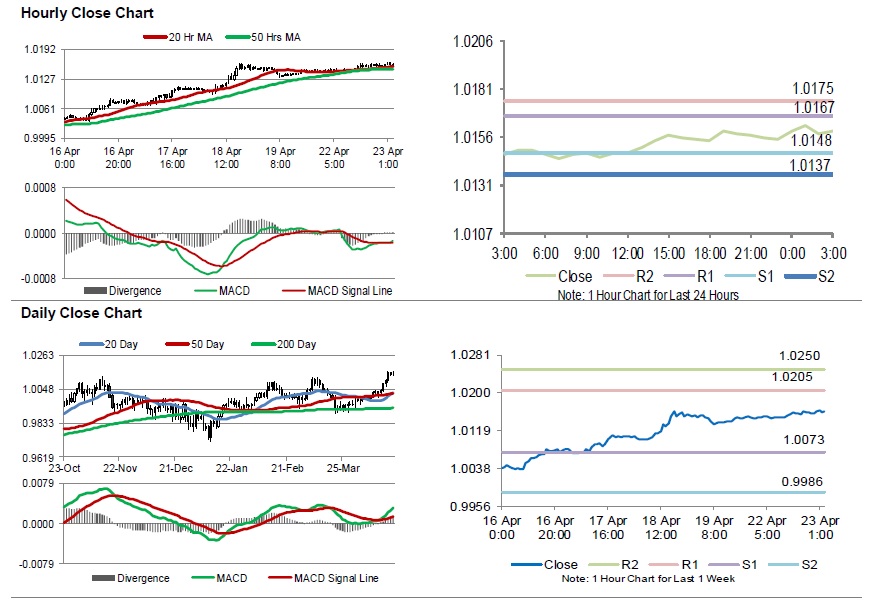
For the 24 hours to 23:00 GMT, the USD rose 0.09% against the CHF and closed at 1.0155.
On the macro front, Switzerland's seasonally adjusted trade surplus narrowed to CHF1.99 billion in March, following a revised surplus of CHF2.49 billion in the prior month.
In the Asian session, at GMT0300, the pair is trading at 1.0159, with the USD trading marginally higher against the CHF from yesterday's close.
The pair is expected to find support at 1.0148, and a fall through could take it to the next support level of 1.0137. The pair is expected to find its first resistance at 1.0167, and a rise through could take it to the next resistance level of 1.0175.
Trading trend in the Swiss Franc today, is expected to be determined by Switzerland's M3 money supply for March, scheduled to release in a while.
The currency pair is showing convergence with its 20 Hr moving average and trading above its 50 Hr moving average.
Canada’s Retail Sales More-Than-Expected In February
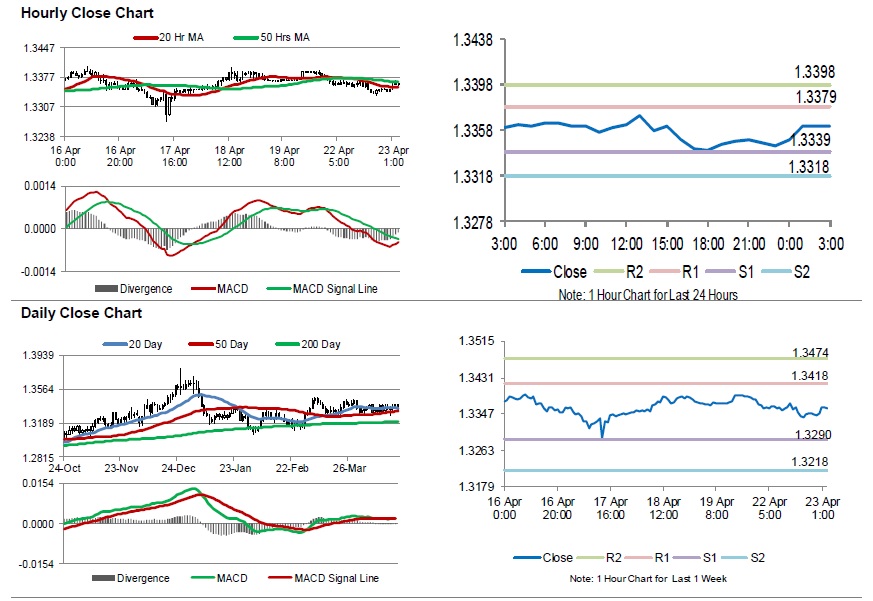
For the 24 hours to 23:00 GMT, the USD declined 0.17% against the CAD and closed at 1.3344.
In economic news, Canada's retail sales rose 0.8% on a monthly basis in February, compared to a revised fall of 0.4% in the previous month. Market participants had envisaged retail sales to record a rise of 0.4%.
In the Asian session, at GMT0300, the pair is trading at 1.3361, with the USD trading 0.13% higher against the CAD from yesterday's close.
The pair is expected to find support at 1.3339, and a fall through could take it to the next support level of 1.3318. The pair is expected to find its first resistance at 1.3379, and a rise through could take it to the next resistance level of 1.3398.
Amid lack of economic releases in Canada today, traders would focus on global macroeconomic events for further direction.
The currency pair is trading between its 20 Hr and 50 Hr moving averages.
Aussie Extends Its Losses In The Asian Session
For the 24 hours to 23:00 GMT, the AUD marginally declined against the USD and closed at 0.7138.
LME Copper prices declined 0.9% or $61.0/MT to $6448.0/MT. Aluminium prices declined 0.1% or $1.5/MT to $1839.0/MT.
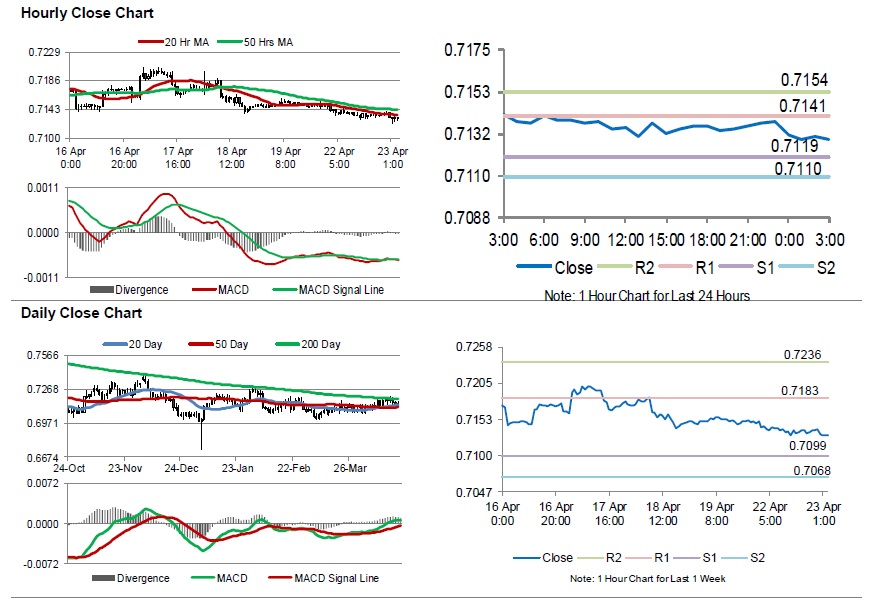
In the Asian session, at GMT0300, the pair is trading at 0.7129, with the AUD trading 0.13% lower against the USD from yesterday’s close.
The pair is expected to find support at 0.7119, and a fall through could take it to the next support level of 0.7110. The pair is expected to find its first resistance at 0.7141, and a rise through could take it to the next resistance level of 0.7154.
The currency pair is trading below its 20 Hr and 50 Hr moving averages.
Gold: Yellow Metal Trading A Tad Lower In The Asian Session
For the 24 hours to 23:00 GMT, Gold declined 0.23% against the USD and closed at USD1277.20 per ounce.
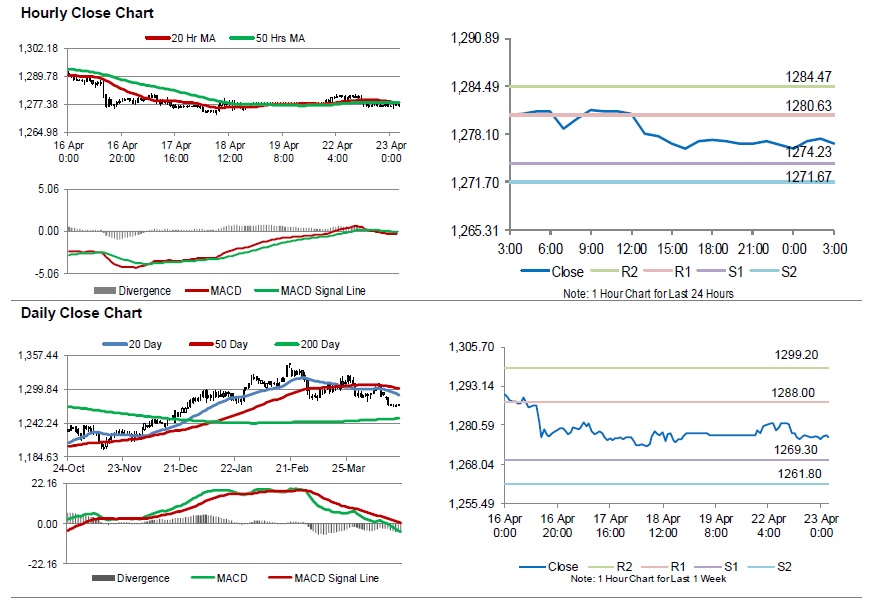
In the Asian session, at GMT0300, the pair is trading at 1276.80, with gold trading marginally lower against the USD from yesterday’s close.
The pair is expected to find support at 1274.23, and a fall through could take it to the next support level of 1271.67. The pair is expected to find its first resistance at 1280.63, and a rise through could take it to the next resistance level of 1284.47.
The yellow metal is showing convergence with its 20 Hr and 50 Hr moving averages.
Silver: White Metal Trading Flat In The Morning Session
For the 24 hours to 23:00 GMT, Silver declined 0.27% against the USD and closed at USD15.05 per ounce, tracking losses in gold prices.
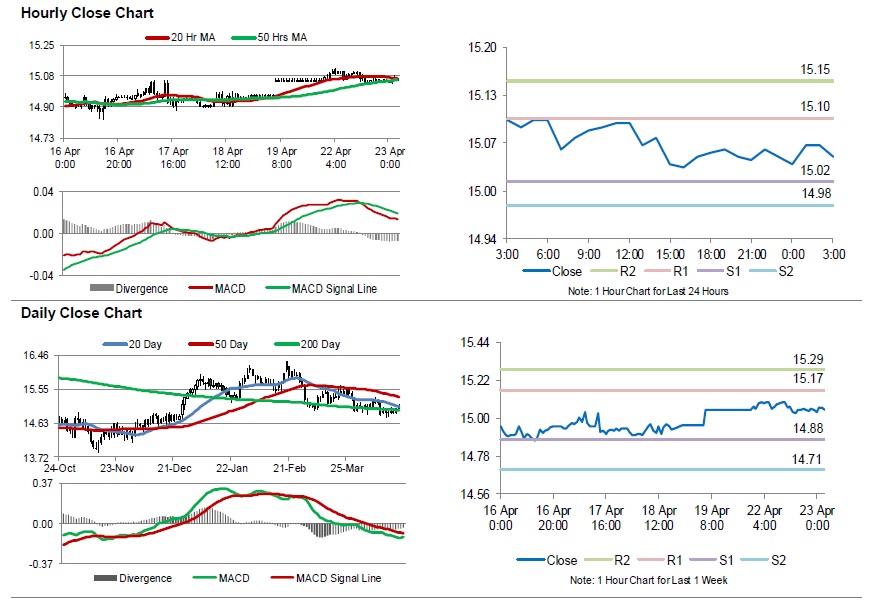
In the Asian session, at GMT0300, the pair is trading at 15.05, with silver trading flat against the USD from yesterday’s close.
The pair is expected to find support at 15.02, and a fall through could take it to the next support level of 14.98. The pair is expected to find its first resistance at 15.10, and a rise through could take it to the next resistance level of 15.15.
The white metal is showing convergence with its 20 Hr and 50 Hr moving averages.
Crude Oil: Oil Trading Higher, Ahead Of API’s Weekly Crude Oil Inventories Data
For the 24 hours to 23:00 GMT, Crude Oil rose 1.11% against the USD and closed at USD65.82 per barrel, after the US decided to terminate waivers on countries to import Iranian oil.
Meanwhile, fresh figures from Baker Hughes disclosed that the number of active oil rigs declined by 8 to 825 in the week ended 18 April 2019.
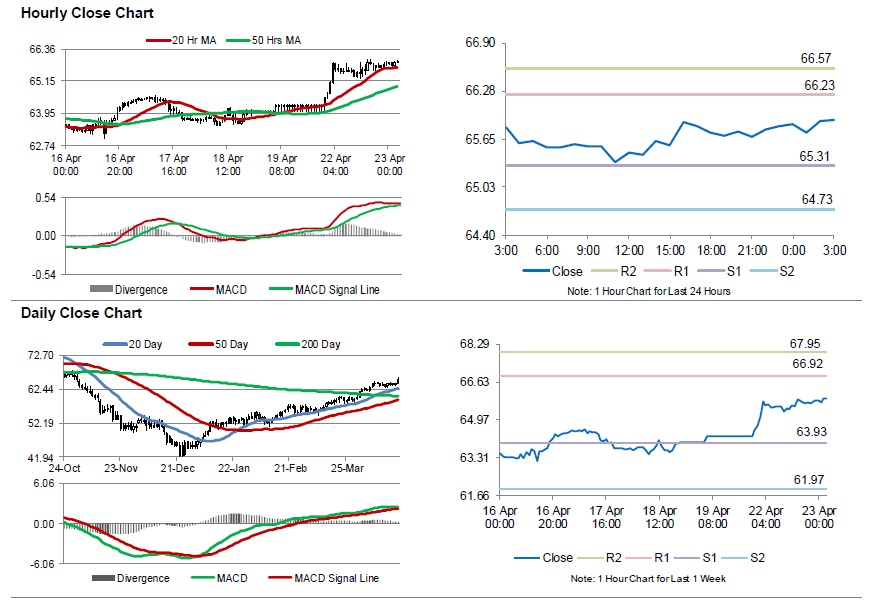
In the Asian session, at GMT0300, the pair is trading at 65.90, with oil trading 0.12% higher against the USD from yesterday's close.
The pair is expected to find support at 65.31 and a fall through could take it to the next support level of 64.73. The pair is expected to find its first resistance at 66.23, and a rise through could take it to the next resistance level of 66.57.
Moving ahead, investors will keep a close watch on the weekly crude inventories data from the American Petroleum Institute (API), due later in the day.
Crude oil is trading above its 20 Hr and 50 Hr moving averages.
Elliott Wave View: Further Strength In Oil
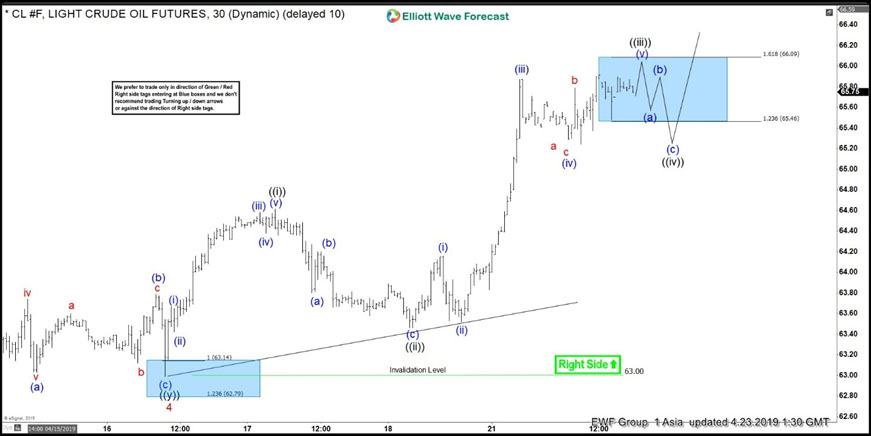
Short term Elliott Wave view on Oil suggests the pullback to $63 ended wave 4. Rally in wave 5 is currently in progress and subdivides as an Elliott Wave impulse structure. Up from $63, wave ((i)) ended at $64.61, wave ((ii)) ended at $63.46, and wave ((3)) is expected to complete soon. Both wave ((i)) and wave ((iii)) also subdivide as an Elliott Wave structure of lesser degree.
Wave ((iii)) shows an extension and almost reaches 161.8 Fibonacci extension. In Elliott Wave Principle, wave 3 typically is the longest and usually reaches at least 161.8 Fibonacci extension. Wave ((4)) pullback should hold above $63 in 3, 7, or 11 swing for further upside. In Elliott Wave Principle, wave ((4)) should not overlap with wave ((1)). Therefore, wave ((4)) should not break into the territory of wave ((i)) at $64.61. Typically wave ((4)) is 23.6 – 38.2% Fibonacci retracement of wave ((3)). We need wave ((3)) to complete first before we can better measure the potential target for wave ((4)). We don’t like selling Oil and expect extension higher as far as pivot at $63 stays intact.
1 Hour CL_F Elliott Wave Chart Asia Update
Daily Markets Broadcast
Wall Street mixed ahead of earnings deluge
It was a mixed performance on Wall Street in holiday-thinned trading, with the US30 and SPX500 declining while the NAS100 index eked out small gains. Oil prices surged as Iran sanction waivers are set to end.
US30USD Daily Chart
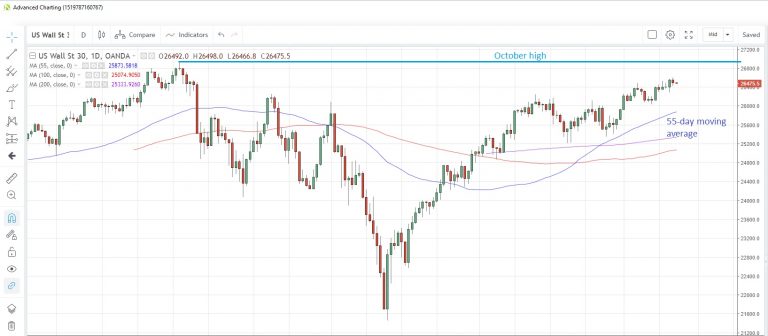
The US30 index touched the highest since October 5 yesterday before closing lower
The index has stalled ahead of the October high of 26,940. The rising 55-day moving average support is at 25,873 today
US existing home sales were soft in March, falling 4.9% m/m, more than the -2.3% expected. Today we see new home sales for last month and, if they are as weak as the existing home sales, it could add pressure on Wall Street.
DE30EUR Daily Chart
The Germany30 index ignored weaker flash PMI readings and extended its recent rally to a seventh day on Thursday. Markets were closed yesterday for Easter Monday
The index touched the highest since October 4 on Thursday. The 78.6% Fibonacci retracement of the May-December drop is at 12,581
Germany's March Markit flash manufacturing PMI rose to 44.5 from 44.1 but missed forecasts of a climb to 45.0. Consumer confidence is seen barely changed in April at -7.1 from -7.2 the previous month.
WTICOUSD Daily Chart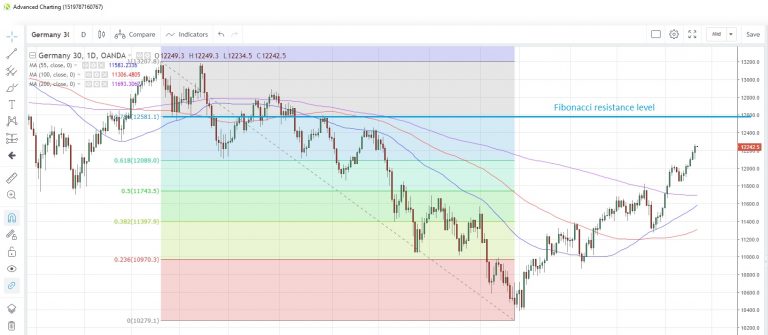
WTI surged more than 2.5% yesterday, posting the biggest one-day gain since January 9, after US President Trump announced that the sanctions waivers granted to eight oil-importing countries would not be renewed when they expire next month
Prices touched the highest since October 31 yesterday.The 78.6% Fibonacci retracement of the October-December drop is at $69.75
API releases its weekly crude inventories data as at April 19 today. Last week saw a drawdown of 3.1 million barrels, the first decrease in three weeks.