Sample Category Title
The Most Traded Currencies in Foreign Exchange
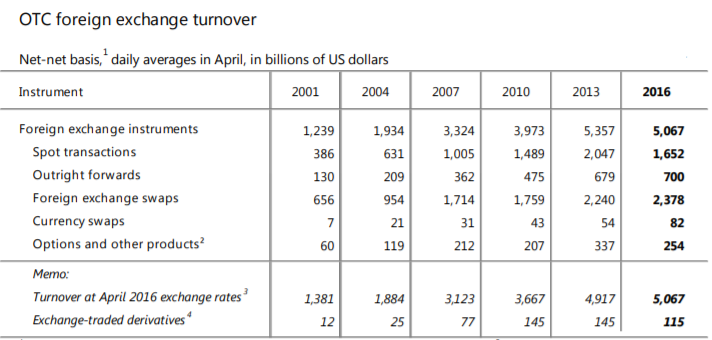
According to the Bank for International Settlement Triennial Central Bank Survey (BIS), the Foreign Exchange market (or FX or forex market) is the largest and most liquid in the world with a global turnover measuring $5.1 trillion per day in 2016.
As disclosed in the table below (courtesy of BIS), foreign exchange swap transactions cleared an impressive turnover of more than $2.3 trillion per day in 2016, trailed reasonably close by foreign exchange spot transactions at more than $1.6 trillion per day. Spot market trading activity actually fell by 19% in April 2016. This is the first time since 2001 spot turnover has decreased.
The FX market is, in effect, a global auction house for currency transactions, determining the relative value of currencies. Unlike other financial markets the FX market is decentralised – an over-the-counter market – meaning no central location or formal exchanges exist.
According to BIS, turnover by currencies shows the US dollar remains the world’s dominant vehicle currency. It was on one side of 88% of all trades in April 2016, up slightly from 87% in April 2013.
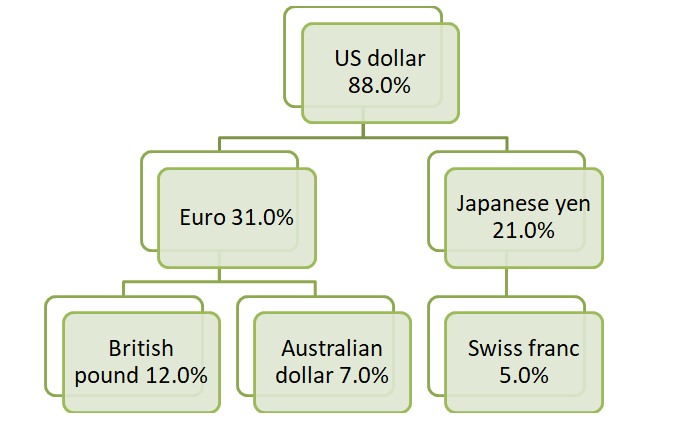 % Daily Share (Approx.)
No matter which trading style you employ, familiarising yourself with some of the market’s G10 currencies (ten of the most heavily traded and liquid currencies in the world) is imperative.
The US dollar
Distributed by the Federal Reserve, regularly titled ‘the Fed’, the US dollar is the official currency of the United States of America.
Typically referred to as the ‘greenback’ or ‘buck’, the US dollar snatches the lion’s share in terms of daily volume in the FX market. The dollar is called greenback as the paper notes issued during the American civil war in 1861 had a distinctive green colouring on the back. The exact origin of the term buck isn’t clear, though strong evidence indicates people began calling dollars bucks in the 18th century thanks to deer, specifically with the trading of deerskins.
Long-term government stability, the world’s largest economy, and a power house in international trade, contributes to the dollar’s popularity. In addition to this, the US dollar is the world’s primary reserve currency, valued at approximately 63% of currency reserves, according to IMF figures.
Another interesting point is the greenback’s connection to commodities. The US dollar is influenced by demand for commodities as many are denominated in dollars. This indicates commodities are subject to not only market supply and demand but also to the relative value of the US dollar. As a result, should the value of the dollar decline, it’ll cost investors more dollars to purchase commodities, and vice versa.
Major currency pairs (all foreign exchange trades involve purchasing one currency and selling, hence the term ‘currency pair’) to keep an eye on containing the greenback are the EUR/USD, USD/JPY, GBP/USD, AUD/USD, USD/CHF and USD/CAD.
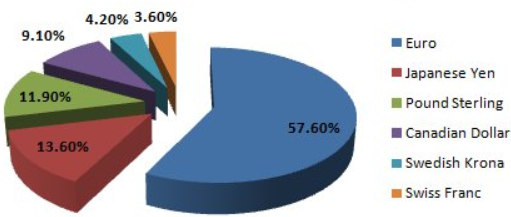
It is also worth observing the US dollar index. The index factors in the exchange rates of six major G10 currencies. Over half of the index’s value is represented by the dollar’s value measured against the euro. The additional five currencies consist of the Japanese yen, the British pound, the Canadian dollar, the Swedish krona and the Swiss franc. One use of this index is deciphering USD positioning across neighbouring currencies as a base for correlations. As an example, say the US dollar index is trading from demand (a form of technical analysis by way of price action) and the EUR/USD from supply, the odds of price turning lower from the said supply increases.
The euro
Issued by the European Central Bank, or more commonly referred to as the ‘ECB’, the euro is the second most traded currency worldwide. The euro, also known as either the ‘single’ or ‘shared’ currency is the official legal tender of 19 of the 28 member states of the European Union (EU). This group of states is known as the Eurozone or euro area, and holds approximately 340 million citizens as of 2019.
The popularity of the euro is primarily down to the scale and economic clout of the area it’s used: the Eurozone. The euro’s value is strongly influenced by political and economic developments.
Decisions regarding interest rates made by central banks tend to have a significant impact on their respective currencies. Inflation is another key factor affecting all currencies, including the euro. The key measure of inflation in the Eurozone is the Consumer Price Index (CPI).
Major currency pairs containing the euro to watch are the EUR/USD, EUR/JPY and EUR/GBP.
The Japanese yen
Headquartered in the heart of Tokyo, the Bank of Japan (BoJ) is responsible for issuing yen, implementing monetary policy and maintaining the stability of the Japanese financial system. The yen’s value is highly dependent on the strength of Japan’s economy, particularly its manufacturing sector. In many respects, international trade is the lifeblood of Japan’s economy.
While the Yen serves as the official currency of Japan, it is also Asia’s most traded currency. Many foreign exchange traders pay attention to economic releases out of Japan, including, but certainly not limited to, BoJ meets and announcements, industrial production figures, unemployment data and GDP numbers.
It might also interest some traders to note the Japanese yen, the third most traded currency in the FX market, and Swiss franc tend to serve well as safe-haven currencies in times of economic uncertainty. This is attributed to the fact Japan is one of the world’s largest exporters, in dollar terms. Japan has always been a large exporter and has continually exported significantly more goods and services than it imports. The result has been decades of current account surpluses, positioning the country as a net creditor to the world.
Major currency pairs containing the Japanese yen to watch are the USD/JPY, EUR/JPY and GBP/JPY.
The British pound
For more than 300 years the Bank of England (BoE) has been the authority issuing British pound banknotes.
Also known as ‘pound sterling’ or ’cable’ (pound coins originally weighed one troy pound of sterling silver, giving the currency the name pound sterling – cable is also a popular nickname for the GBP/USD currency pair [the term dates back as far as the 19th century, when transactions between the British pound and the US dollar were implemented through the transatlantic cable]).
Foreign exchange traders often base the pound’s value, the fourth most traded currency in the FX market, on the overall strength of the British economy and political stability of its government. Central bank monetary policies, employment and GDP releases, among other reports, tend to have a marked effect on the direction the pound takes.
Across the board, sterling’s value has significantly declined of late, affected by the country electing to exit the European Union (EU) on March 2019, creating a somewhat divided country between those who wish to remain in the EU and those who want to exit.
Major currency pairs containing the British pound are the GBP/USD, GBP/JPY and the EUR/GBP.
The Australian dollar
The Australian dollar, often labelled as a commodity-linked currency due to its relationship with China’s movement (China is Australia’s largest trading partner, in both exports and imports while Australia is China’s sixth-largest merchandise trading partner) and the commodity markets (behind China, Australia is the world’s largest producer of gold and therefore has a positive correlation with the precious metal. So when gold prices rise, the Australian dollar typically finds support and appreciates as well), is the currency of the Commonwealth of Australia.
Issued by the Reserve Bank of Australia and representing the fifth most traded currency in the foreign exchange markets, the Aussie dollar often reacts to both local macroeconomic events and those released out of China for reasons briefly highlighted above.
Major currency pairs containing the Australian dollar are the AUD/USD and AUD/JPY.
The Swiss Franc
The official currency of Switzerland and the sixth most traded currency in the FX market.
Switzerland’s reputation for financial services and relatively sound monetary policies has made the Swiss franc a ‘safe-haven’ currency, also known as the ‘’Swissie’ among the financial community. The country has a low rate of inflation and people have confidence in the Swiss National Bank (the Swiss National Bank has the exclusive right to issue banknotes in Switzerland). The Swiss franc, similar to the Japanese yen, typically advances to higher ground in times of global economic uncertainty.
An important inverse correlation to keep an eye on is between the EUR/USD and the USD/CHF currency pairs. This can help traders pin down potential reversals using a myriad of trading strategies. For example, price trading at support on the EUR/USD coupled with a similar scenario present on the USD/CHF from resistance, adds weight to a move being seen in both markets.
Major currency pairs containing the Swiss franc are the USD/CHF, EUR/CHF and CHF/JPY.
Bottom line
As demonstrated above, each currency has specific traits. While it is beyond the scope of an article to list all the currency pair’s twists and oddities, the piece has hopefully provided traders a foundation to expand one’s knowledge in the foreign exchange market.
Do Financial Markets Have Financial Cycles?
Scientific research has shown that certain phenomena that appear to be unrelated, in fact cluster at the same period and turn at the same time. These phenomena are often recurring and follow a cyclic model.
The word ‘cycle’ is derived from the Greek word “κύκλος”, meaning ‘circle’. There are numerous examples of cycles in nature, including: the rotation of the earth around the sun (365.25 days), the rotation of the moon around the earth (27 days), the rotation of the earth around its axis (24 hours), sunspot activity (11 years), Atlantic salmon abundance (9.6 years), night and day, the tides (high and low), and the seasons. Cycles can also be observed in the bull and bear markets.
Price activity in the financial markets
Price activity in the financial markets is charted using two axes - the price axis and the time axis. Price is the center of many technical analysis theories, concepts and tools. In contrast, time often enjoys less attention and focus – but it has not been universally ignored. Ralph Nelson Elliott, an American accountant and author, developed the Wave Principle. This theory centered around wave time analysis and continuation patterns such as triangles, which Elliott stated could forecast the time that a minimum price target or objective may be reached. Another example is W.D Gann, who claimed to be able to predict the dates and times of significant international conflicts and financial events using methods based on geometry, astronomy and ancient mathematics.
Time Cycles
Time cycles may be used to forecast the beginning or end of a bullish and/or bearish market and the validity of a trendline. Moving averages and oscillators may be also optimised to the period of the dominant cycle. In fact, the period of such indicators is usually set to half of the cycle. For example, the Lunar cycle consists of 28 days - so it is hardly surprising that many indicators use 14 as their default period.
Anatomy of a Cycle
There are three important parameters that are related to cycles and cycle analysis; amplitude, period and phase.
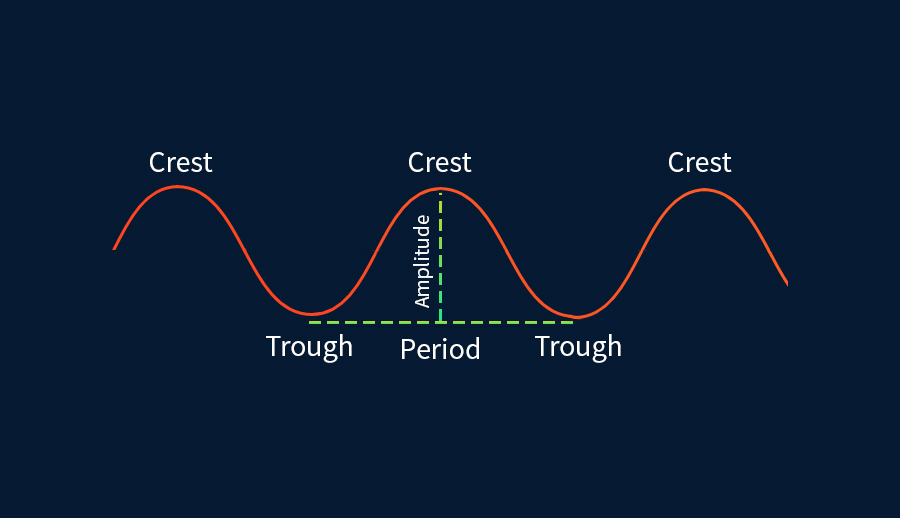
Amplitude refers to the height of the wave, the distance between the wave crest and the wave trough. It is measured in price units. The period of wave refers to the distance of two consecutive troughs. It is measured in time units. On the other hand, phase measures the difference of two waves. It is the distance between the troughs of two waves. It is measured in time units.
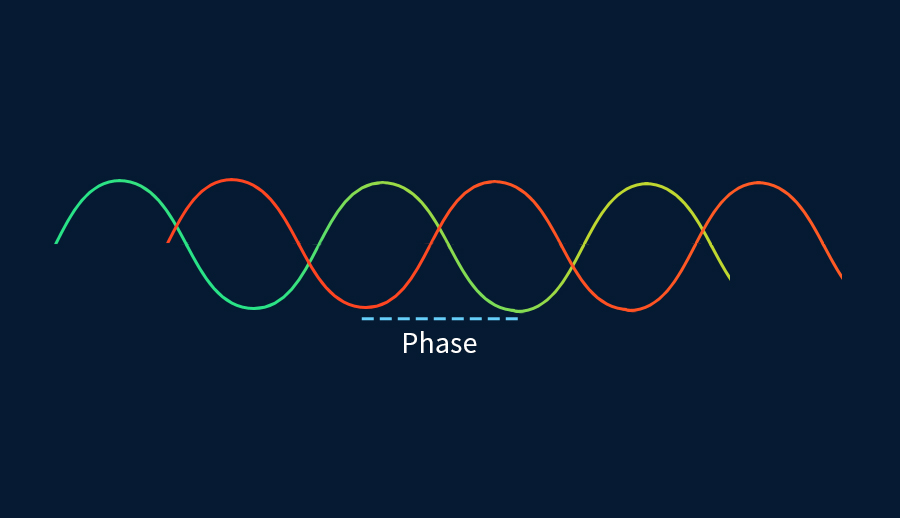
Cycle analysts look for cycles on the price charts to help them identify turning points in the market. One of the ways to identify a cycle is through visual inspection. Of course, this may not be the easiest task - especially for beginners - but with persistent practice, cycles will be visible. Measuring the period between consecutive troughs and then calculating their average can be a good indicator to estimate the next cycle trough.
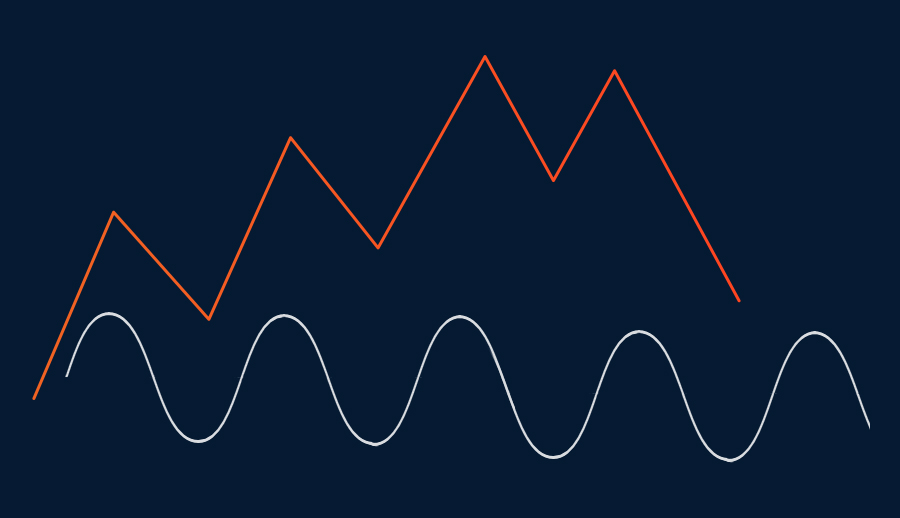
If cycles are not visible by visual inspection, then they most probably do not exist.
Conclusion
Economist William Stanley Jevons was one of the first to observe that financial crisis followed a pattern or cycle of occurring every 11 years during his long research in the 1800s. Other scientists also mentioned the cyclic behavior of economic phenomena. Kondratieff wrote about a cycle of 54 years in wholesale prices, while Kuznets referred to a real-estate cycle of 18 years in the USA. Juglar also identified a cycle in the rise and fall of interest rates of 9 and 11 years.
While many of these researchers received some notable criticism, there is nothing to lose by considering alternative viewpoints. Should cycles indeed exist in the financial markets, investors should be aware and open-minded enough to consider them whilst planning their trading strategies.
Scalping the Forex Market: A Beginner’s Guide
An integral part of becoming a consistently profitable trader is finding a trading style that suits your emotional disposition. Fortunately, a number of trading styles are available.
Although each style differs on holding periods and frequency, position trading, swing trading, day trading and scalping are among the most widely used channels within the technical community.
Position trading involves holding trades long term, ranging from weeks, months and even years for some. Traders in this category tend to glean information from both fundamental and technical analysis, and typically focus their energy on slower timeframes: monthly and weekly scales.
Swing trading is, as its name implies, a medium-term trading style designed to hook market swings that vary from a couple of days to a few weeks. Traders in this class generate the majority of their trading signals via technical analysis, though fundamental analysis can also help form ideas as well. Popular timeframes within this field are the H4 and daily charts.
Many believe day trading and scalping are similar trading styles. While both take place within one trading day, day traders open one, maybe two, setups a day using timeframes ranging from the H1 to the M5 timeframes. Scalpers, on the other hand, aim to achieve profits from relatively small price changes. Scalpers often open and close larger numbers of trades using the M1, M3 and M5 timeframes, with the goal of catching multiple small wins.
Unlike position, swing and day trading, winning is critical when scalping.
Is scalping for you?
Personality is a broad term describing how people habitually relate to the world. After the developmental period through childhood and adolescence, these patterns of relating remain reasonably stable through life. They are traits that influence behaviour, thinking, motivation and emotion. In other words, it is fair to say we each have different goals; different aspirations; different trading account sizes; different temperaments and so on…
With that in mind, is your emotional make-up suited for scalping or are you likely to succeed using a different trading style?
Self-control and patience are two key elements to successful scalping. Although you could also argue these personality traits apply to all trading styles, we are specifically targeting the needs of a scalper here.
Traders need control of their emotions. Scalping the market involves long periods at the screens, which can lead to a loss of control, particularly after a couple of losses. Following your trading plan religiously should keep you out of trouble when the heat is on.
Though you are opening multiple trades each day, scalpers still need to exercise patience. Waiting for your setup to form is essential before pulling the trigger. Jumping the gun and hesitating have no place in a scalper's approach, which can lead to traders wiping out days of gains in one fell swoop.
Another vital point, as highlighted above, is winning is critical in scalping. Unlike other styles which can house a win/loss ratio of less than 50% and still be profitable after a series of trades, scalping requires consistent winning due to the smaller gains achieved on the winning trades. In other words, a day trader might be right only 40% of the time, though on those times he/she is correct, the win outweighs the loss by at least 2:1. This is risk/reward and is an incredibly important facet in trading.
However, when scalping, the risk/reward ratio is typically tipped upside down, meaning traders generally net less than what they risk. An example of this is a position risk of $200 on a trade only netting a $100 gain. With a high winning percentage, though, these wins far outweigh losses. If you are uncomfortable with this high winning requirement, scalping may not be the trading style for you.
As with all methods, strict money-management rules are essential. Without this, irrespective of the trading methodology or trading style employed, you are doomed to fail.
Some pros and cons of scalping:
Pros:
- Carries less risk exposure. Time in the market is limited, therefore reducing the possibility of running into major market events.
- Compared to swing trading, where traders attempt to capture larger market moves, scalpers search for smaller moves that are easier to achieve.
- Even during relatively quiet markets, a scalper can exploit many small movements.
- Scalpers can quickly compound a trading account.
- Traders in this category can focus solely on technical analysis, though should remain aware of macroeconomic events scheduled for release.
Cons:
- Not suitable for those with full-time obligations.
- Forced to trade liquid currency pairs offering tight spreads. The EUR/USD, GBP/USD and AUD/USD boast high trade volume and low spreads, therefore serving as ideal candidates for scalpers.
- Scalping requires immense concentration. This is sometimes difficult for traders to sustain over long periods.
- Trade precision – limited room for error.
- The small gains, although profitable, can sometimes be debilitating for traders who miss bigger moves in the market.
- Commissions can add up. This is why it is important to select currency pairs offering tight spreads.
Final words
What this piece has (hopefully) accomplished is offer a primer into the world of scalping. The piece purposely avoided digging through the different scalping strategies available as to cover the subject in detail would be beyond the scope of this article. This, however, is something the team plan to cover in future articles.
How Keeping a Trading Journal Can Help You Boost Performance
Did you know that you can boost your trading performance and increase your success rate even with your current trading strategy?
The solution is simple yet effective – By keeping a trading journal.
Trading journals are designed to help you spot any weaknesses and mistakes you make while trading. Imagine what impact cutting the number of your losing trades by only 10% could have on your bottom line.
In this article, we'll take a closer look at what trading journals are, the advantages of keeping one and what they should include. I'll also give you some great tips on how to keep journals to make your trading day much easier and more productive.
So, let's begin …
What is a trading journal?
Trading journals are written records of all the trades you take in the market. They consist of journal entries, each of which represents an individual trade you opened.
While journal entries can include a variety of information a trader may find useful when assessing their trading performance, the main elements are always the same. This includes the traded instrument, date and time, trade direction, position size, entry and exit points and the result of the trade.
Some traders like to include certain additional elements into their trading journals, such as charts with technical levels, market commentary or the reasons why they've taken a trade (i.e. entry trigger.)
That said, these elements aren't necessary for a trading journal, they might indeed help you to better understand your trading and to identify certain behavioral patterns that increase the probability of losing trades.
While you can access your entire trade history in your broker's trading platform, keeping a separate trading journal provides much more flexibility and allows you to add additional fields that aren't included in your platform's trading history.
Advantages of keeping a trading journal
Trading journals are a great way to track your performance and identify which part of your trading strategy generates losing trades. They provide valuable insight into your trading behaviour and can help spot any weaknesses in your trading strategy.
To get the most out of trading journal, you need to perform regular retrospectives of your journal entries and analyze why certain trades worked well, while others didn't.
Ask yourself:
- Are there specific chart patterns that produces an unusually high number of losing trades?
- Do some currency pairs you trade at certain hours cause you a loss?
- Are your entries and exit points the main weakness?
Answers to these questions will help you to fine-tune your trading strategy and boost your performance.
Main elements of trading journals
As we already mentioned, certain elements are necessary to be included in a trading journal. Those elements are:
- Date and time. One column of your trading journal should be reserved for the date and time you took a trade. This makes it easier to filter through your most recent trades, if you're using a spreadsheet software like Excel, for example.
- Traded instrument. Naturally, your trading journal should include the instrument that was traded. You can also add a separate column dedicated to the financial market you're trading, such as stocks, currencies, commodities or cryptocurrencies, in case you're trading more than one market.
- Trade direction. In this field, insert the direction of the trade. Was it a short or long trade? A market order or pending order?
- Entry and exit prices. This field is reserved for the entry and exit prices of the trade. Consider using 3 columns for this – entry price, SL and TP.
- Position size. To make later journal retrospectives easier, your journal should include the position size that you've taken. This will make it more efficient to analyze and fine-tune your risk management rules.
- Trade result. Finally, once a trade is closed, enter the result of the trade. Was it a losing trade or winning trade? How much have you made or lost? You can use this column later to filter all losing trades and identify the mistakes that led to their opening.
Additional elements of trading journals
Some traders prefer to add additional elements to their trading journals, such as the reasons for taking a trade, a chart in graphic format or general market commentary. While these fields are not mandatory, they can indeed play an important role when you perform a journal retrospectively.
By writing down the reasons for taking a trade, you'll be able to spot whether you've been taking trades based on emotions or rational decision-making. Even if you're not aware of it, a large portion of your (losing) trades may be the result of trading on gut feeling without proper trade confirmations.
In addition, by taking screenshots of the charts, you'll be able to analyze your taken trades in much more detail and identify certain price-action patterns that generate lower success rates than others.
Having a separate field for market commentary can also help you identify which market environments work best for your trading strategy. Does the majority of your losing trades come during ranging markets? Or do you take trades during major market news and shifts in risk appetite? These comments work great in conjunction with chart screenshots.
Tips on how to keep a trading journal
Now that you know what trading journals are, their main elements and what additional elements you can include, let's see how successful traders keep their journals tidy and clean.
Tip 1: Consistency is key.
To get the most out of your trading journals, you need to be consistent in keeping it. Enter your journal entry as soon as you take a trade, or there is a high chance that you'll forget about it later. Think about journal entries as valuable tools that will help you fine-tune your trading strategy.
Believe me, you'll miss all those trades that you haven't entered into your trading journal that could have provided valuable insight into your trading progress and performance. It takes 21 days to build a habit, so try to stick to it until it becomes second nature to you.
Tip 2: Make your journal part of a trading plan.
Besides your strategy, risk and money management and trading style, your journal should be part of a well-round trading plan. Some traders prefer to have a written trading plan so they can refer to it whenever they find themselves struggling in the markets.
Tip 3: Perform regular retrospectives.
Trading journals have no real value if you don't study their entries on a regular basis. That's why journal retrospectives are so important – they prevent trading journals from being a dead letter. Only by making regular retrospectives will you be able to spot and remove any trading mistakes that cause losing trades.
Check your traded markets, entry and exit points, charts, entry triggers and all other elements of your journal entries and try to fine-tune your strategy accordingly.
Make your own trading journal in Excel
To make keeping trading journals easier, you can create them in Excel or any other spreadsheet software. Simply add all the fields mentioned above into separate columns, which allows you to filter through each of the fields once your trading journal grows.
Also, add some of the additional fields if you feel that they can help you evaluate your trading and keep chart screenshots in a separate folder named by the date you took the trade.
This entry has all the necessary fields to help you in your journal retrospectives and improve your trading strategy. In addition, we've also added 2 additional fields that we find quite helpful – Commentary/Reasons for taking a trade and charts.
Final words
Trading journals are an effective tool for spotting any weaknesses of your trading strategy and, if used properly, can help to avoid them in the future. Journals keep all your market entries in one place.
This makes it easier to go over them from time to time and spot recurring patterns that lead to losing trades. If you don't have a trading plan yet, make sure to create one and include keeping a trading journal as part of your plan.
Nevertheless, even the best trading journals won't help you much if you don't perform regular journal retrospectives. You can decide how often you'll go through its entries. It can be on a weekly basis, monthly or even quarterly, depending on your free time and how many trades you take.
Best Practices that Maintain and Restore Mental Energy for Trading
To achieve a focused and lively trading session, learn good habits that help give you a boost of mental energy. Mental energy revolves around the ability and motivation to accomplish cognitive activities. It is driven by efforts of the mind to process information, complete a task or deliver an analysis.
Much like physical energy, mental energy is needed to perform quality trades. When in the middle of a long trading session, restoring mental energy is key to efficiently execute strategies and carry out action plans. Because of this, it is vital to form reliable habits that rejuvenate the mind and increase mental energy levels.
To enhance your trading sessions, practice different ways you can give yourself a boost of mental energy.
Best benefit of having mental energy when trading
Mental energy provokes actions that lead to fulfilling certain goals. It is about the capacity to perform different projects and accomplish daily tasks. By maximizing mental energy, traders can effectively work on daily trading activities while remaining driven and focused.
There are many benefits of increasing your mental energy. These include:
- Increases overall focus and attention
- Produces desirable results
- Improves sharpness
- Strengthens memory power
- Inspires resilience and diligence
In a challenging market, the most beneficial aspect of mental energy is its effect on cognitive performance.The best benefit of having mental energy is that it prevents mental exhaustion which drives constant quality trades. By boosting your mental energy levels, you can minimize exhaustion that could compromise the quality of your performance. For long term success, this will allow you to be fully aware of your current state and take control of your effectiveness as a trader.
Top habits that provide a great boost of mental energy
In an active forex market, traders need to be at their best state of mind. With different trading activities to accomplish, mental stamina is key to producing the excellent results. From strategizing to analysis, there will be moments when you will feel fatigued and unmotivated. With the risks and rewards at stake, traders must learn how to manage mental energy levels through the use of good habits.
Mental energy plays a significant role when trading forex. With tasks that involve calculation and analysis, traders have to ensure mental resilience at all times. For quality trading performance, be sure to apply ways strengthen mental energy.
Learn about the top habits that give an excellent boost of mental energy:
Prepare for deep sleep
Having quality sleep is one of the most effective ways to optimize brain performance and increase mental energy. When getting ready for a new day of trading, traders need to have the energy to jumpstart cognitive functions. Typically, you will need 7 to 9 hours of sleep to get an immediate effect and increase mental energy levels. By achieving quality sleep, you can give your brain the opportunity to rest and revitalize before taking on new challenges.
Mental energy is most affected by lack of quality sleep. In fact, having a good night's rest plays a vital role when maintaining the overall wellness of your brain. This is because sleep deprivation hinders brain cells from communicating properly. When you lack time to rest and rejuvenate, your brain cannot function at its optimal state. This leads to difficulty in processing information, concentrating and decision making.
To ensure that you are able to achieve deep sleep, here are great tips:
- Together with your trading schedule, set up a bedtime routine.
- Reduce exposure to blue light which comes from digital devices.
- Avoid alcohol, caffeine or high sugar foods 6 to 8 hours before bedtime.
- Use natural products to help you get into a restful mood like lavender scents or chamomile tea.
- Set up a sleeping environment that is highly conducive to quality rest.
- Do physical exercises daily for at least 30 minutes.
Self-care for both body and mind
There is no separation between the mind and the body. What the body feels, the mind feels. What the mind feels, the body feels. – Buddhaimonia, Meditation for Everyday Life
Wellness for both body and mind is key to having a healthy and well-balanced trading lifestyle. To achieve an energized mindset, traders have to take care of physical wellness. To achieve physical strength, you will need the mental drive for motivation. In the long run, ensuring optimal performance in both physical and mental aspects of your life can lead to further success as well as overall health.
To maintain great mental energy levels, get to know the easy and effective ways to achieve self-care for both body and mind.
Body
- Make time for activities that combine physical activity and stress-relief like yoga or dancing.
- Spend time outdoors through walks or hikes.
- Schedule appointments that promote positive and healthy body image.
- Develop an exercise routine that you enjoy.
- Feed your body with a healthy diet.
Mind
- Apply self-compassion and mindfulness.
- Lean towards a more proactive and growth-oriented mindset.
- Practice the art of gratitude.
- Build healthy relationships that serve as motivation.
- Do varied mental activities that help you destress.
Listen to music that boosts mood
Mental energy is linked to mood. Studies in psychology show that music has the ability to improve overall disposition as well as promoting happiness. According to Top Styles of Music That Boost Trading, listening to your favorite tunes can immediately put you in a better mood while also jumpstarting productivity.
One of the most effective ways to instantly boost mental energy and improve mood is by listening to music. Aside from optimizing your physical trading space, music can also enhance your trading environment. To increase the liveliness during your trading session, listening to energetic or classical music can give a quick boost of mental energy.
Schedule time for breaks
Mental exhaustion is common especially during long hours of trading. To maintain and restore energy levels, traders must set aside time for breaks. Having frequent breaks can immediately minimize mental exhaustion and encourage cognitive endurance. This gives you the chance to step away from the computer and refresh the mind.
Breaks not only provide mental energy, but also give physical relief. This allows your body to also recharge and rest. To lessen concerns of digital eye-strain or body aches from sedentary work, make time for breaks when trading.
Pinpoint your peak hours
When making the most out of mental energy, it is key to learn about yourself and your peak hours. This is similar to applying energy management and time saving strategies. At what time during the day do you feel most mentally energized? Do you feel more energized in the mornings? Are you more focused and productive during the afternoons? Reader's Digest notes that everyone has their own circadian rhythm within a 24 hour time period. You may perform better with natural sunlight while others are more active and alert during night time.
One of the best strategies to boost mental energy is to schedule high-value tasks during your peak hours. As you face your task list, try to schedule important activities during your peak hours. This is a great strategy that can help ensure that your optimal timeframe for mental resilience is paired with crucial trading activities.
Steer clear of habits that decrease mental energy
While finding ways to increase mental drive, it is also essential to know the bad habits to avoid. To create a fulfilling and efficient trading environment, its is good to remain aware of the harmful habits that decrease mental energy. These are habits that stop you from performing your best or mindsets that hinder your productivity levels.
When promoting mental energy, it is important to avoid habits like:
- Pessimism and negative self-talk
- Overworking or overstretching
- Unhealthy diets
- Procrastination
- Idleness or laziness
- Disorganization
Enhance mental energy for optimal performance
For a more focused and energetic trading session, use simple and effective habits that boost mental energy levels. Mental energy is paramount when becoming a productive and successful trader. Aside from physical state, a trader's mental state can greatly contribute to overall energy levels. This leads to greater efficiency, better focus, willpower and self-belief when trading. With many important activities to accomplish, it is vital to find ways to boost mental energy and continue trading.
Practicing great habits can give traders a jolt of mental energy. While you are in a busy trading session, having mental energy can help produce quality output and optimal efficiency. When you feel mentally drained, take a break and have a quick walk outside. To prepare yourself for a day of trading, be sure achieve quality sleep to acquire a great level of mental effectiveness. With many options to choose from, be sure to set yourself up for success by preparing excellent habits that can easily boost mental energy.
CADJPY Squeezed by Bollinger Band; Strong Movement is Expected
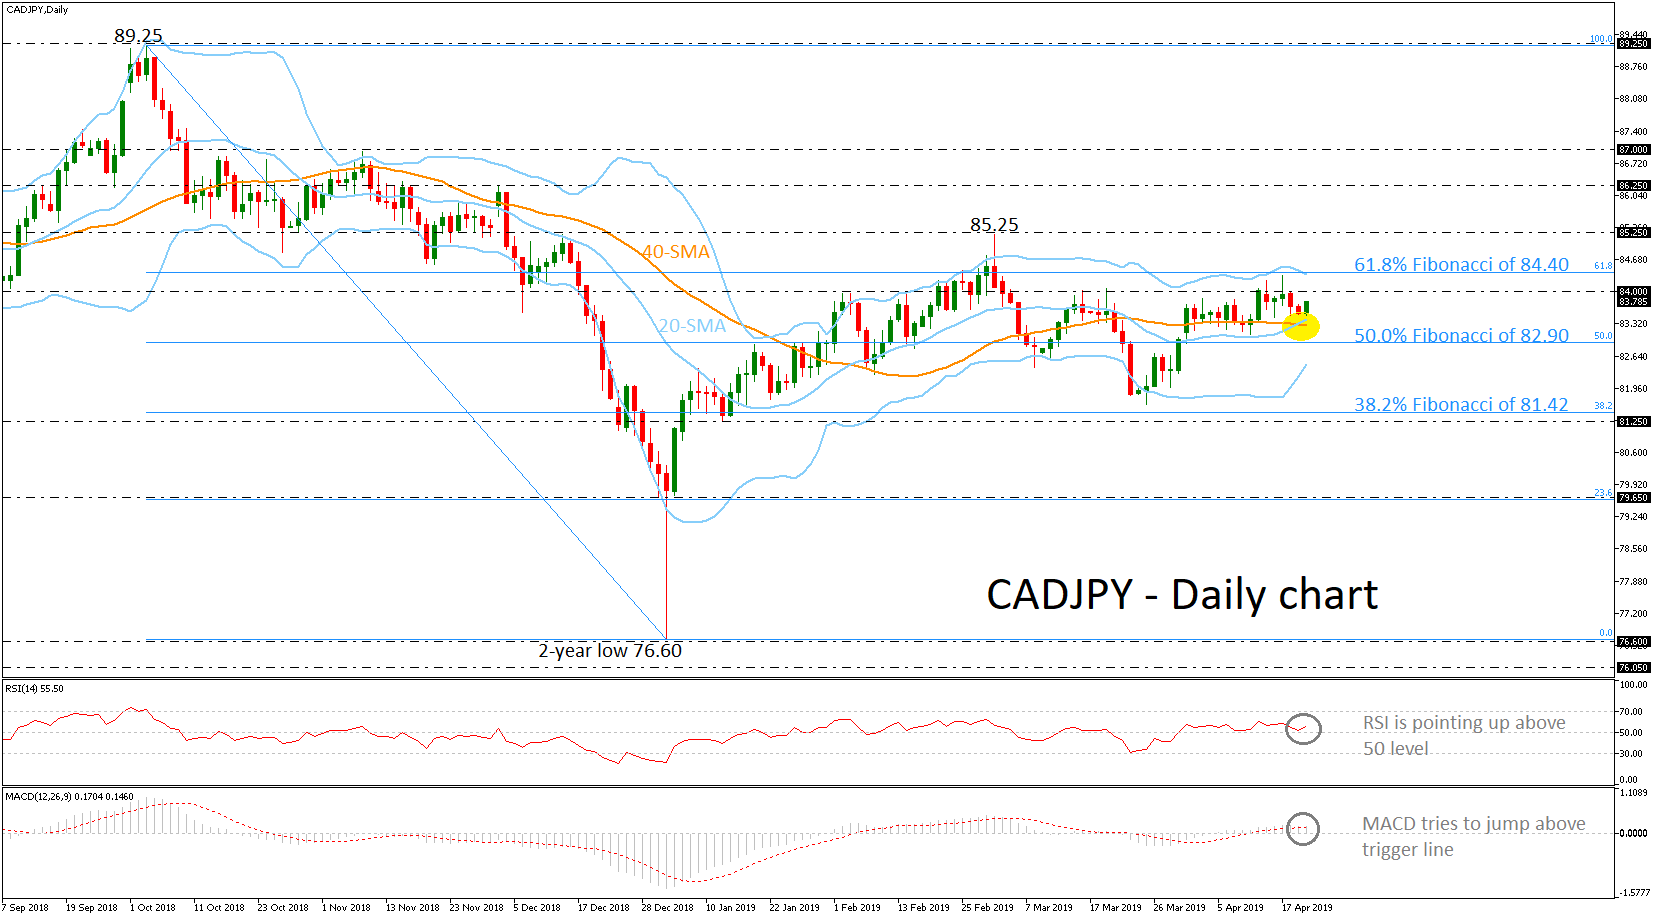
CADJPY has been finding strong support on the bullish cross of the 20- and 40-day simple moving averages (SMAs) since the beginning of this month, creating a narrow sideways move above the 50.0% Fibonacci retracement level of the downleg from 89.25 to 76.60, near 82.90.
Having a look at the momentum indicators, the RSI is pointing up above the neutral threshold of 50 and the MACD is hovering marginally above the trigger and zero lines. Also, the price action holds above the mid-level of the Bollinger band, creating a short-term trading range between the 38.2% Fibonacci of 81.42 and the 61.8% Fibonacci of 84.40. It is worth mentioning that the Bollinger bands are narrowing, approaching the price action, suggesting a possible strong movement in the near future.
An advance above the 84.00 handle and the upper Bollinger Band, which stands near the 61.8% Fibonacci, could open the door for bullish actions towards the 85.25 resistance. Even higher, resistance would be faced around the 86.25 peak, registered on March 1.
However, a significant step lower, below the 20- and 40-SMAs as well as beneath the 50.0% Fibonacci of 82.90 could push the price until the lower Bollinger band of 82.50. More declines could find support at the 38.2% Fibonacci of 81.42.
Easter Monday Provides Another Trading Lull
Notes/Observations
- China's leaders to shift focus to reform and restructure as economy stabilizes.
Asia:
- China Politburo saw downward economic pressure as structural in nature, external economic environment was 'tightening' and would step up proactive fiscal policy.
- Japan ruling Liberal Democratic Party (LDP) lost the Lower House by-elections in Okinawa and Osaka
- South Korea President Moon might deliver a message from US President Trump to North Korea leader Kim if a new inter-Korean summit takes place Europe/Mideast:
- Iran Supreme Leader Ayatollah Ali Khamenei has named Brigadier General Hossein Salami as the head of the country's Revolutionary Guards (first change since late 2007)
Energy:
- US said to be planning to end sanctions waivers related to Iran oil imports. US expected to say that all countries that import oil from Iran would have to end these shipments shortly or face US sanctions (Reminder: On Nov 5th 2018, the US reimposed sanctions on Iran oil transactions, hitting core industries of oil, banking and shipping. US issued waivers to eight countries (China, India, Italy, South Korea, Turkey, Taiwan, Greece, and Japan) which allowed them to continue importing Iranian crude oil)
SPEAKERS/FIXED INCOME/FX/COMMODITIES/ERRATUM
Equities
Indices [S&P 500 Futures -0.3%]
Market Focal Points/Key Themes: Corporate activity is very limited today as the majority of European markets are closed in observance of Easter Monday. Looking ahead notable earners include Halliburton, Kimberly-Clark, Grainger and Lennox International.
Speakers
- China Central Financial Committee reiterated plan to increase financial support for real economy; to fine tune monetary policy on growth and prices
- Saudi Arabia said to be willing to increase oil production to compensate for any loss of supply if US ended waivers on Iranian oil sanctions. Saudi Arabia must first see impact on markets if US makes such a move
Currencies/Fixed Income
- FX markets were little changed in thin post-holiday trade with numerous FX centers closed for Easter Monday holidays in both the Far East and Europe. The major pairs were confined to a narrow range.
- EUR/USD steady at 1.1245 area while USD/JPY still unable to make a clear break above the 112 level. Focus on the upcoming BOJ policy decision later this week. BoJ said to likely to consider slight downgrades to growth and inflation forecasts in its quarterly outlook
- Emerging market countries (Indonesia, India, Turkey) with high current account deficits were under pressure as higher oil prices sparked renewed concerns
Economic Data
- (JP) Japan Mar Convenience Store Sales Y/Y: 0.0% v 2.0% prior
- (MY) Malaysia mid-Apr Foreign Reserves: $103.5Bv $103.0B prior
- (TR) Turkey Apr Consumer Confidence: 63.5 v 59.4 prior
- (TW) Taiwan Mar Export Orders Y/Y: -9.0% v -5.0%e
- (TW) Taiwan Mar Unemployment Rate: 3.7% v 3.7%e
**Fixed Income Issuance**
- None seen
Looking Ahead
- (PT) Portugal Feb Current Account Balance: No est v -€0.7B prior
- 06:00 ((RO) Romania to sell RON500M in 4% 2021 bonds
- 05:30 (SL) Sri Lanka Mar National CPI (NCPI ) Y/Y: No est v 2.4% prior
- 07:25 (BR) Brazil Central Bank Weekly Economists Survey
- 08:30 (US) Mar Chicago Fed National Activity Index: +2.55e v -0.29 prior
- 09:00 (BR) Brazil Mar CNI Industrial Confidence: No est v 61.9 prior
- 09:00 (IN) India announces details of upcoming bond sale (held on Fridays)
- - 10:00 (US) Mar Existing Home Sales: 5.30Me v 5.51M prior
- 11:00 (CO) Colombia Feb Trade Balance: -$0.8Be v -$1.0B prior; Total Imports: $4.0Be v $4.3B prior
- 11:30 (US) Treasury to sell 3-Month and 6-Month Bills
- 15:00 (CO) Colombia Feb Economic Activity Index (Monthly GDP) Y/Y: 2.9%e v 2.2% prior
- (AR) Argentina Mar Budget Balance (ARS): No est v 6.7B prior
- (MX) Mexico Citibanamex Survey of Economists
- 16:00 (US) Weekly Crop Progress Report
Euro Yawing on Easter Monday, but US Oil Sanctions Could Rattle Markets
German banks are closed for the Easter Monday holiday and EUR/USD is almost unchanged. Currently, the pair is trading at 1.1249, up 0.03% on the day. There are no German or eurozone events on the calendar. In the U.S., there is just one release. Existing home sales is expected to slow to 5.31 million in March, after a strong reading of 5.51 a month earlier. Housing data will remain in focus on Tuesday, with the release of the housing price index and new home sales.
The euro dropped sharply on Thursday, after disappointing manufacturing PMIs from Germany and the eurozone. The manufacturing sector continues to post declines, as the global trade war has reduced demand for German and eurozone exports, and taken a toll on the German auto industry. German manufacturing PMI has slowed for nine successive months, and the worrisome trend shows no signs of changing until the U.S and China hammer out a trade agreement. The services sector, which is more reflective of domestic demand, is in better shape, as German and eurozone PMIs continue to indicate expansion.
It’s a quiet start to the week for EUR/USD, but that could quickly change, as the Trump administration is expected to announce on Monday that it will terminate sanction waivers given to some importers of Iranian oil, as of May 1. This move is intended to further tighten sanctions against Iran, and has sent crude prices higher on Monday. If risk apprehension rises, investors could flock to the safe-haven U.S. dollar at the expense of the euro.
EUR/USD Outlook: Recovery Extension Attempts Limited for Now
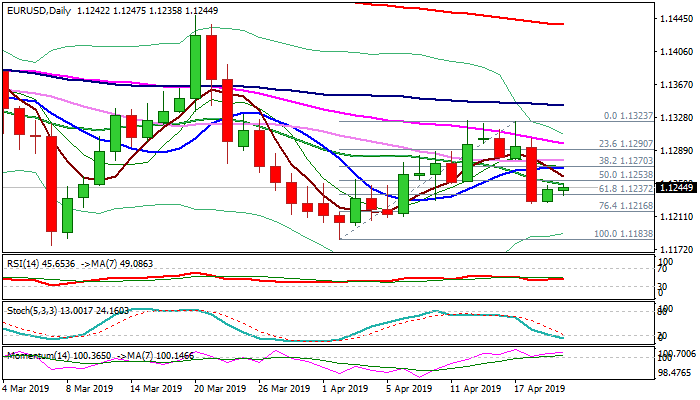
The Euro stands at the front foot and attempts to extend recovery from last Thursday's low at 1.1226, following initial positive signal from Friday's bullish close.
Profit-taking after Thursday's 0.58% fall could push the price higher, as rising bullish sentiment supports the notion.
Recovery faces immediate barrier at 1.1249 (20SMA), break of which would open 10SMA (1.1267) and key barriers at 1.1283/96 (daily cloud base/55SSMA).
On the other side, long bearish candle of last Thursday weighs and suggests limited recovery.
Thick daily cloud (spanned between 1.1283 and 1.1372) also produces pressure and is expected to limit extended upticks.
Only sustained break here would neutralize existing downside risk and open way for renewed attack at 1.1323 lower platform.
Res: 1.1249; 1.1267; 1.1283; 1.1296
Sup: 1.1235; 1.1226; 1.1210; 1.1183
Gold Stops Sell-off Near 4-Month Lows; Eyes on Downtrend Line
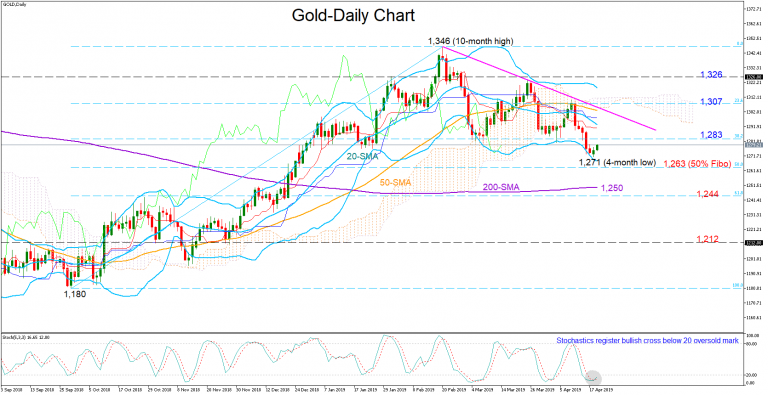
Gold printed fresh losses last week after remaining mostly stable in the first half of the month, slipping near a four-month low of 1,271 on Friday. The price, however, has been flirting with the lower Bollinger band in the past three sessions, while the Stochastics have already registered a bullish cross in oversold area below 20, both justifying today’s upside momentum in the market. Still, the line connecting the lower highs from the 1,346 peak, and a price below the Ichimoku cloud and its moving averages suggests that the trend is likely to hold on the downside.
Should the market extend recovery, the 38.2% Fibonacci of 1,283 of the long upleg from 1,180 to 1,346 could provide immediate resistance. Yet, only a decisive close above the descending line, currently near 1,307 and slightly below the 23.6% Fibonacci, would signal a trend reversal, shifting the focus towards 1,326 a key resistance this year.
Alternatively, a move southward could initially find support near the 50% Fibonacci of 1,263 before a crucial battle potentially starts between the 200-day simple moving average (SMA) (1,250) and the 61.8% Fibonacci of 1,244. A failure to hold above this area would probably bring a more aggressive sell-off towards the former 1,212 restrictive hurdle.
In the medium-term picture, the outlook seems to be switching to bearish after the drop below the 1,280 level. Traders could wait for a confirmation under the 50% Fibonacci of 1,263.
In brief, the short-term risk is skewed to the upside, while the medium-term outlook looks to be turning to bearish.