

Sample Category Title
Oil Price Finds an Unexpected Friend in Trump
It’s difficult to understand what direction President Trump really wants Oil prices to go. On one side of the coin, his social media feed is flooded with public calls for prices to drop lower but on the other side of the same coin, he has given Oil prices another shot in the arm this morning after reports circulated that the United States will soon end waivers granted to countries importing Oil from Iran.
Oil prices have already marched to fresh 2019 highs on this development and are likely to stretch higher, as this headline adds further to the already tightening supply of Oil in the markets.
The fundamental themes in favour of higher Oil prices are clearly stacking up their dominoes, with OPEC-led supply cuts, geopolitical tensions in Libya and possible sanctions on Venezuela all fueling concerns over further supply disruptions. With the US removing sanction exemptions at a time where Oil markets are not only tight but extremely sensitive to price shocks, this news has simply added another domino to a stack that has already sharply piled up to point north.
The truth of the matter remains that what happens with Oil prices has become a game of heads and tails with Trump, and the coin has dropped today in favour of more gains for Oil.
While it is likely still far too early and generously optimistic to predict Oil trading back towards $100, WTI looks set to attempt a potential target of $70 if concerns over tight supply in the global Oil markets remain a major theme persuading more buyers to enter positions.
EURUSD Drops Beneath SMAs in Descending Channel
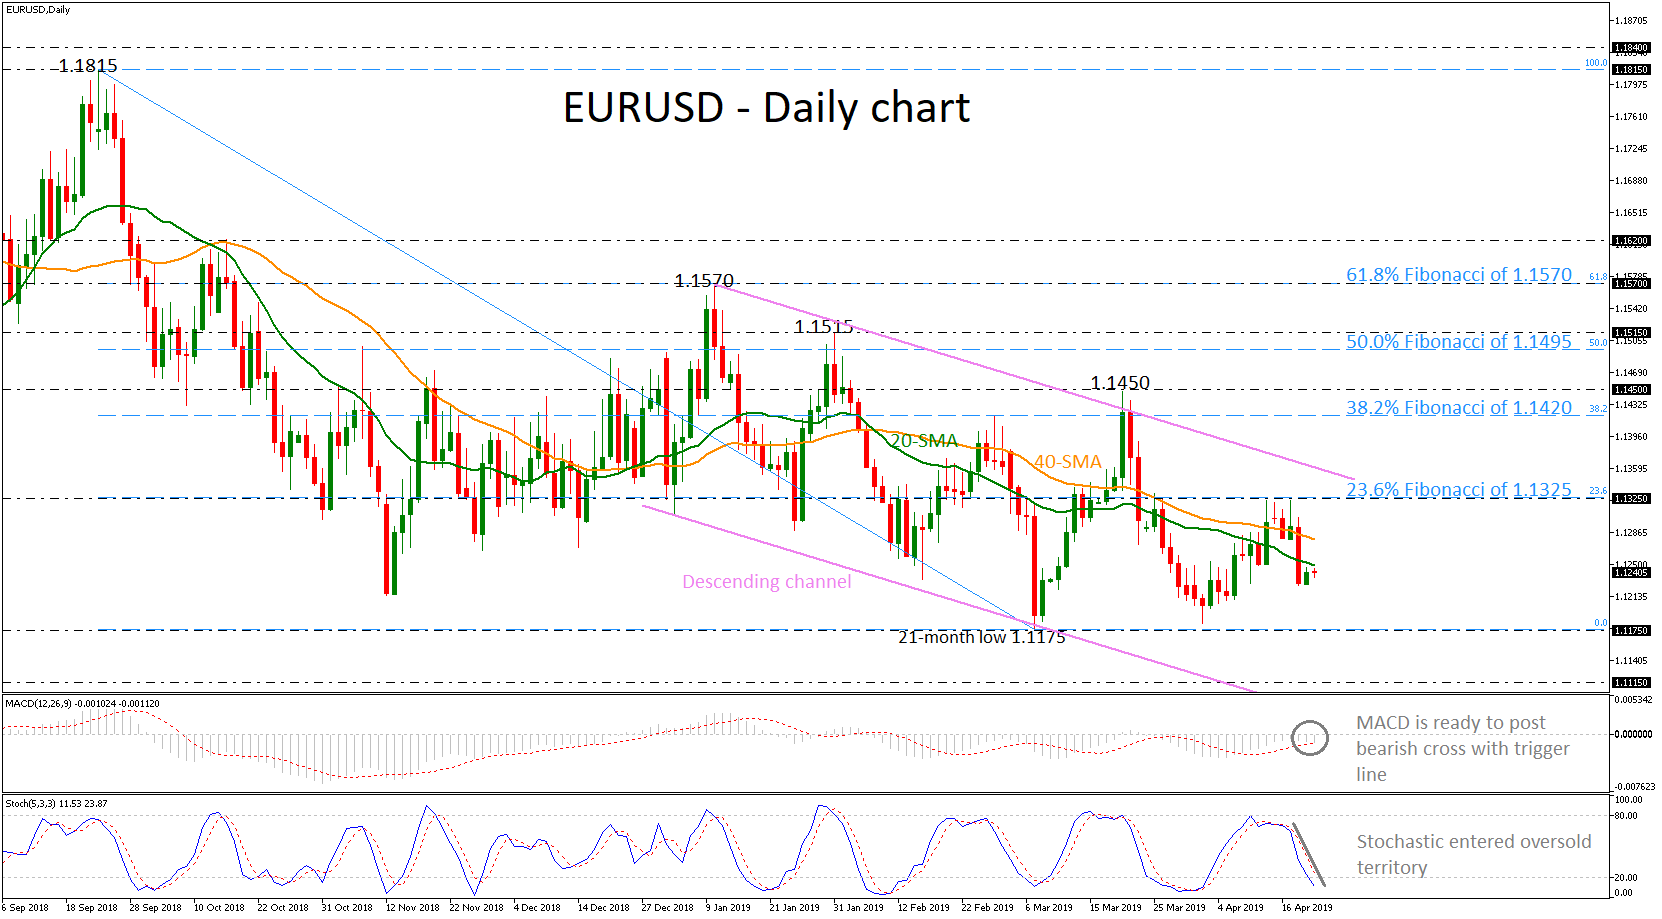
EURUSD is looking bearish in the short term after creating a descending channel over the last three months. Also, the price declined beneath the moving averages on Thursday and the technical indicators are all pointing to further negative momentum. The stochastics are heading south with the %K line entering the oversold zone, suggesting plenty of scope for additional bearish moves. The MACD is ready to cross below its trigger line in the negative zone.
Immediate support to further losses would likely come from the 21-month low of 1.1175 before heading towards the lower boundary of the channel around the 1.1115 support. Failure to hold inside the downward range would endorse the focus to the downside and attention would increasingly turn to the 1.0900 psychological level, reached on March 2017.
On the flipside, if the bearish movement lost steam and the pair reversed higher, resistance would initially come from the 20- and 40-day simple moving averages (SMAs) currently at 1.1250 and 1.1280 respectively. Rising above these lines could take prices towards the 23.6% Fibonacci retracement level of the downleg from 1.1815 to 1.1175, which overlaps with the 1.1325 resistance. If there is a successful jump above this barrier, the price could rest near the falling line of the channel around 1.1350.
Overall, EURUSD could lose further ground as there is enough room until another touch of the lower boundary of the channel.
Oil Jumps as US ‘Tightens the Screws’ on Iran
- Oil soars as US prepares to impose full sanctions on Iran
- Currencies enter holiday lull
- Loonie eyes BoC policy meeting on Wednesday
Oil jumps as US ‘tightens the screws’ on Iran
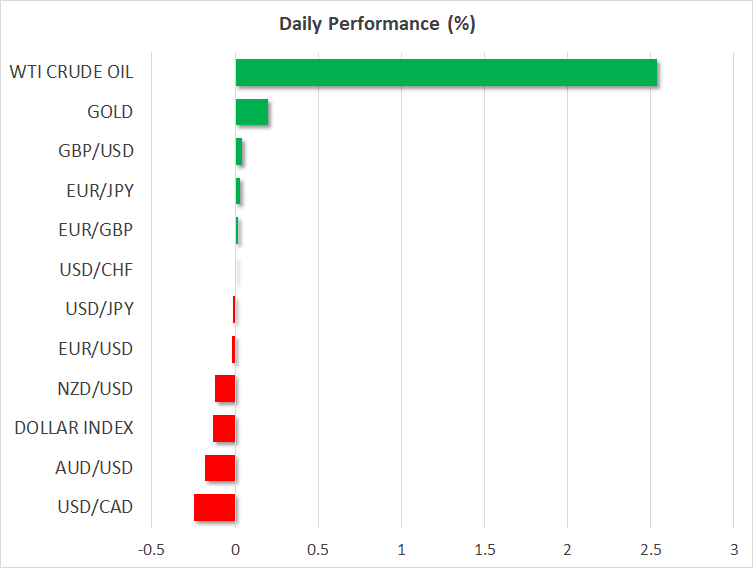
Energy markets came back to the forefront on Monday, following reports that Washington is set to announce that all Iranian oil exports will soon face ‘full’ sanctions, ending the waivers it had granted previously to key customers of Iran, like China, Japan, and India. Oil prices surged to fresh six-month highs, even though the move was widely anticipated, as the original waivers back in November were only meant to last six months.
The scale of the market reaction shows that many had expected these waivers to be extended for a few more months, so the news likely painted an even tighter picture for global oil supply, especially in light of Libya’s production being under threat too. On the demand side, concerns about global growth have subsided lately after some solid numbers from the US and China, creating the ‘perfect cocktail’ for oil prices to soar.
The ball is in OPEC’s court now, as the cartel will likely decide whether and to what extent to ‘open the taps’ and make up for the lost Iranian output – not least due to pressure from the Trump administration. Therefore, oil prices will take their cue by any remarks from the various officials heading into OPEC’s June 25 meeting.
Currencies enter holiday lull
In the FX market, things were much less exciting, with all the major pairs trading in very narrow ranges on Friday as most markets were closed for the Good Friday holiday. Accordingly, news flow was light as well, without any noteworthy headlines crossing the wires.
Even though American traders will go back to their desks today, most other nations – like the UK – are taking the day off again, which implies that liquidity will probably be thinner than usual. In thin markets, large moves can occur without much in the way of news, while any piece of news could have a disproportionally large impact, so extra caution may be warranted.
Loonie awaits BoC meeting
Even the Canadian dollar failed to gain substantially on Monday, unable to capitalize on the surge in oil prices. This likely underscores that traders are reluctant to increase their exposure to the loonie ahead of the BoC’s policy meeting on Wednesday, where the central bank may strike a more cautious tone amid some softness in the domestic economy.
Iran Sanctions Waivers Hit Sentiment in Asia
Speculation that the US is about to announce the end to the Iran sanctions waivers later today boosted oil prices and took the shine off risk appetite that had remained buoyant into the close of trading last week.
Oil prices surge
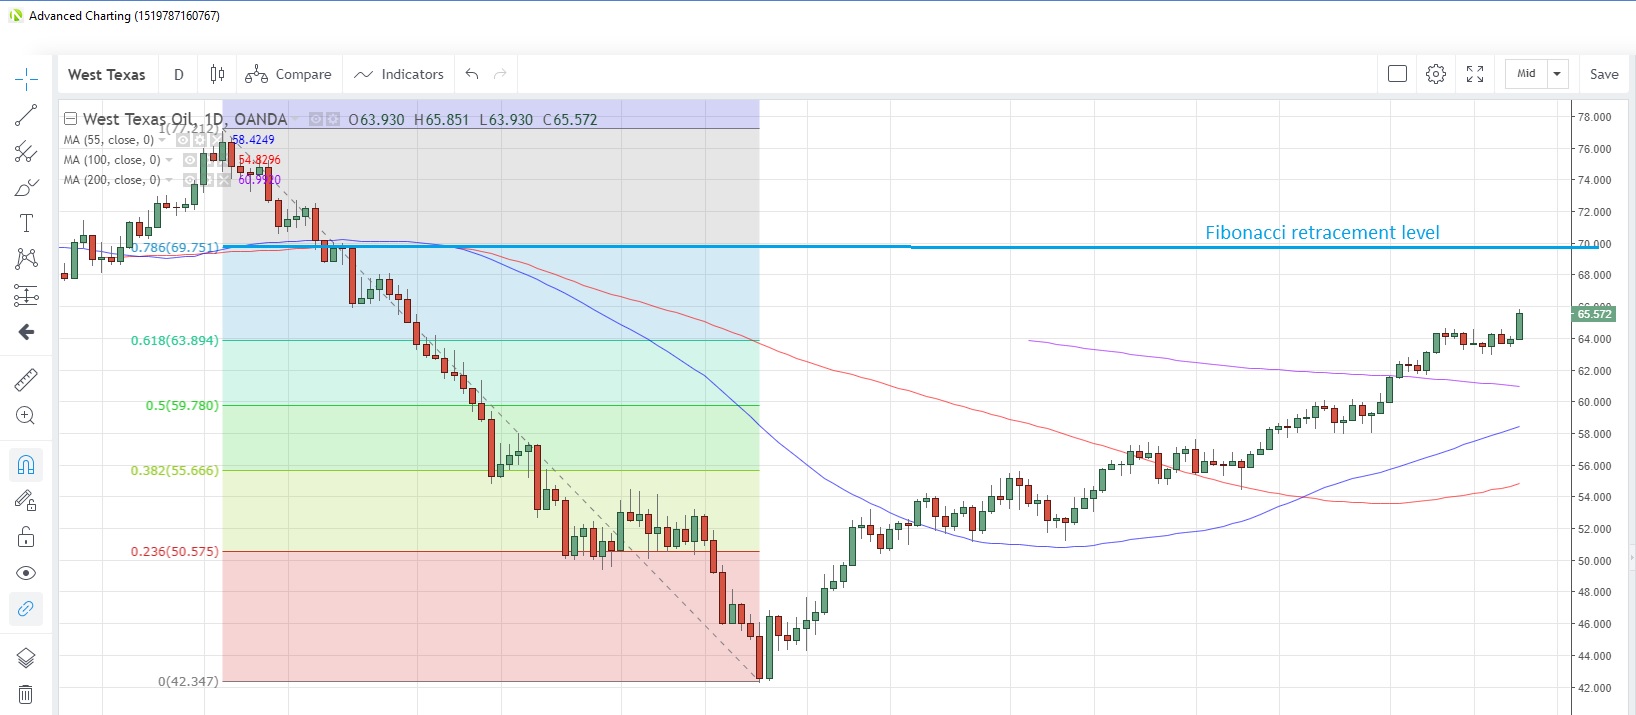
West Texas Intermediate (WTI) climbed 2.5% during the Asian session, hitting the highest level since October amid speculation that the waivers on Iran sanctions granted by the US to eight oil importers last year would cease soon.
WTI surged to an intra-day high of $65.85 per barrel, the highest since October 31, and appears to be heading toward the next potential resistance point at $69.75, which is the 78.6% Fibonacci retracement of the October-December drop last year.
WTI Daily Chart
Equity markets take a hit
The recent equity market rally appears to be coming to a halt, though thin liquidity in markets due to numerous holidays across the globe for Easter Monday could be exaggerating the declines. The US30 index is down 0.24% and the Nas100 has fallen 0.36%. China shares faced additional pressure from a weak property sector, with the broader index falling 3.4%, giving back more than 70% of the gains made last week.
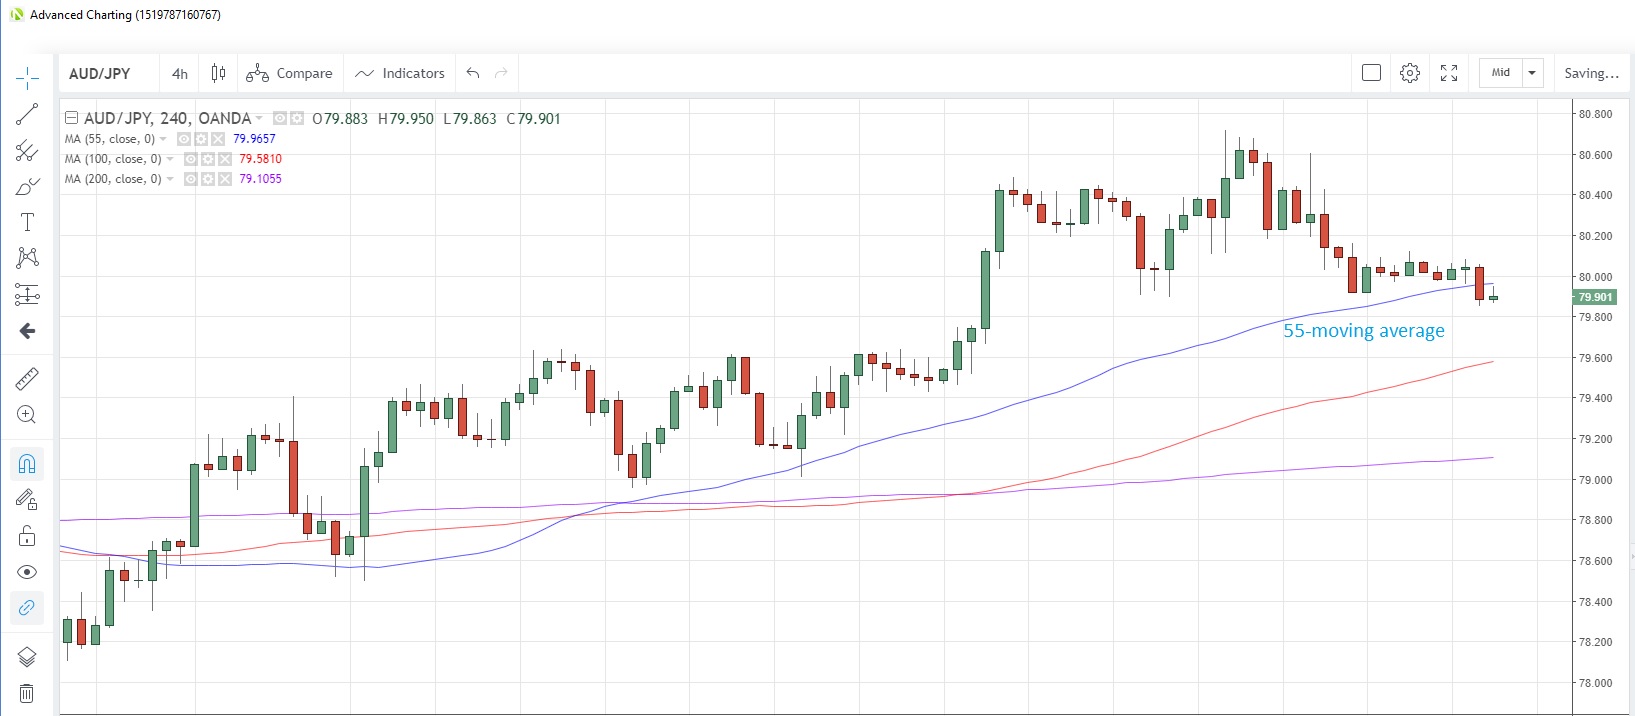
Risk-beta currencies were also under pressure, with the Australian dollar falling 0.19% versus the US dollar and 0.2% against the Japanese yen. AUD/JPY is now below the 55-moving average support on the 4-hour chats at 79.965. The US dollar was generally better bid, with USD/SGD rising to the highest level in 10 days.
AUD/JPY 4-Hour Chart
Bare data calendar to start the week
With many centres still enjoying the long Easter break, there is not much to report on the data calendar. The Chicago Fed national activity index for March and US existing home sales for the same month are the only items scheduled. Home sales are expected to fall 2.3% m/m after an 11.8% surge in February.
Oil Surges Over 2% as Iran Oil Import Deadline Set to End
Crude oil prices jumped over 2% on early Monday. The gains in the oil prices come as Washington will impose a total ban on crude oil imports from Iran. The US imposed sanctions on Iran in November last year. However, eight countries were exempt from the ban, mostly from Asia. The exemption on oil imports is likely to end on May 2nd. This will fully cut off Iran from the international oil markets.
Can Crude Oil Maintain the Bullish Momentum?
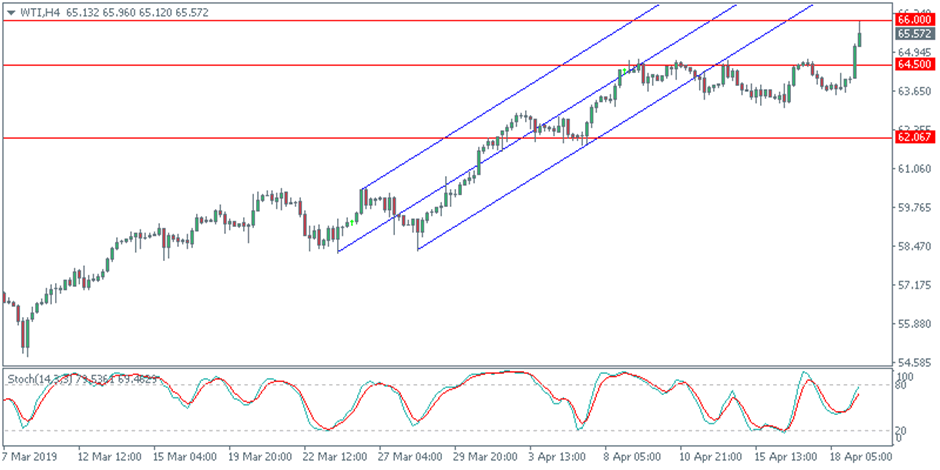
Oil prices surged higher by early Monday’s open and price action is currently testing the highs just below the 66 handle. This marks a retest of the previously breached support level. If resistance is formed near the 66 level, we expect oil prices to begin correcting lower. The initial support is at 64.50.
Gold Bounces Off 2019 Lows
The precious metal opened today after an extended weekend. After gold fell to fresh 2019 lows, the precious metal is currently seen rebounding higher. Economic data was sparse on Friday and the current jump in gold prices is seen as a result of technical positioning. Big ticket events due later this week such as the US advance GDP report will be key in shaping the direction of gold this week.
Will Gold Rise Higher?
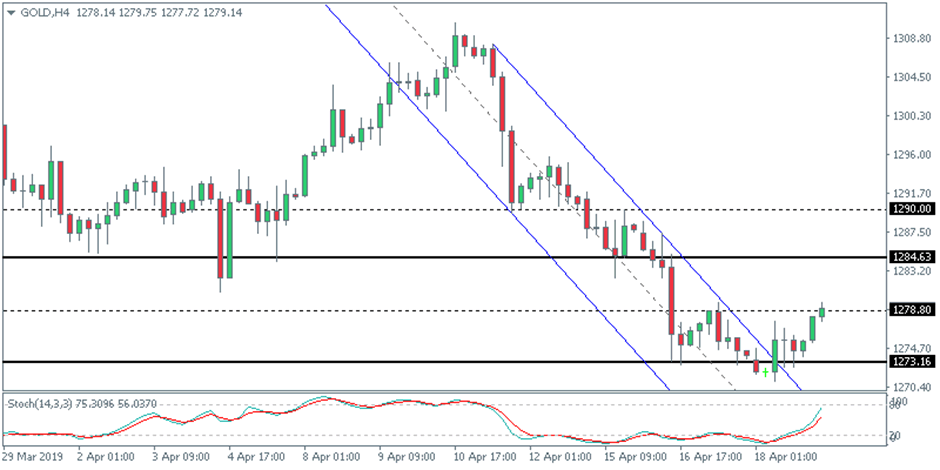
Gold prices formed a bottom near the 1273 handle which also coincides with the 200-day moving average. As price formed a spinning bottom candlestick pattern, a bullish follow-through is required today. If gold manages to close higher, we anticipate further gains in store. Currently, gold is seen testing the previous minor resistance at 1278.80. A breakout above this level will signal further gains targeting 1284.60.
Euro Currency Turns Bearish Again
The common currency gave up the gains from last week as prices slumped to post new one-week lows. The slump in the currency came even as economic data on Friday saw the US building permits and housing starts coming in lower than expected. However, growth concerns continue to plague the common currency bloc.
Will the EURUSD Test the Lower Support?
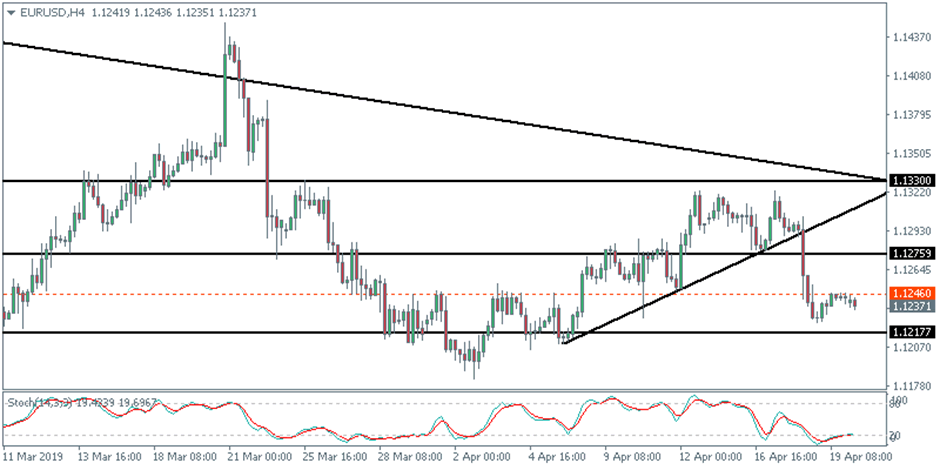
The euro currency briefly bounced higher to test the minor resistance level at 1.1246. Price has failed to breakout out above this level and is currently seen pushing lower. If the previous lows at 1.1228 are tested, then the EURUSD could be seen falling back to the previous support at 1.1217. Only a breakout above the resistance at 1.1246 will signal further gains to the upside.
Are We Gitting an Earnings Recession?
This week is likely to be a critical one in determining the next move for U.S. equities. To date, 79 S&P 500 companies have announced actual results for Q1 2019. As usual, the big banks led the earnings season and most of them have outperformed Wall Street estimates. The financial sector’s positive performance decreased the overall expected decline in Q1 earnings from -4.6% to around -4%. However, markets are still anticipating a slight decline in earnings growth in the second quarter, which if proven right, would mean U.S. companies will hit an earnings recession.
The earnings season will kick into higher gear this week, with more than 150 S&P 500 companies due to announce actual results. If positive earnings surprises remain near 78%, this will reduce the threat of hitting an earnings recession and may in fact show a slight growth in Earnings Per Share (EPS) for Q1.
With the S&P 500 forward PE (Price to Earnings) ratio sitting near highs of 16.8 and the Index 1.2% below its historic record, investors need convincing results to keep buying equities at their current levels. The Federal Reserve has limits on what it can do to tighten monetary policy, and loosening policy may not happen unless we see serious signs of declining inflation, which is not the case at the moment. That’s why a disappointment in results this week may lead to a sharp correction in equity prices.
The earnings calendar for the week includes Microsoft, Intel, Facebook, Twitter, Caterpillar, Exxon, Halliburton, Chevron and Boeing, among many others.
Oil prices surge to new highs
Brent and WTI surged to new 2019 highs early today following reports that the White House will end waivers granted to countries importing Oil from Iran. According to a Washington Post report, Secretary of State Mike Pompeo will announce the move to end exemptions later today. While some market participants were expecting the waivers to end when they expire in early May, this was still not fully priced in.
Whether Oil prices will resume their uptrend from here on depends on OPEC’s next move, especially given the deteriorating situations in Libya and Venezuela. We expect to see increasing pressure from Trump’s administration on OPEC to pump more Oil, and that’s likely to lead OPEC+ to increase output in the second half of the year. However, we may still see an additional spike in prices before the situation becomes clear.
Canadian Dollar Pulled Higher by Oil, But Cautious ahead of BoC
Canadian Dollar open the week generally higher, as helped by strong rally in oil price, on supply concern. Though, the Loonie is generally bounded in range only. BoC rate decision and statement this week will be crucial to the next move. For now, risks are mildly on the upside for USD/CAD, and any dovish twist of BoC would likely trigger an upside breakout. Meanwhile, Sterling and Yen are so far the stronger ones in quiet holiday trading. Australian and New Zealand Dollar are the weakest ones.
Technically, USD, EUR and JPY are three interest ones to watch. USD/JPY turned sideway after struggling to break through 112.13 key resistance. But subsequent retreat is so far very shallow, thus, maintains near term bullishness. Meanwhile, EUR/JPY suggests steep selloff late last week and is now back pressing 125.61 support. Break will suggest completion of rebound form 123.65 and bring deeper fall.
EUR/USD drops sharply after. EUR/USD also dropped sharply late last week but recovered well ahead of 1.1176 low. It remains to be seen if selloff in EUR/USD would drag down EUR/JPY but keep USD/JPY steady. Or it is going to happen some other ways.
US to end Iranian oil sanction waivers for China, Greece, India, Italy, Japan, South Korea, Taiwan and Turkey
Oil price jumps sharply today on news that US is preparing to stop all Iranian oil sanction waivers. The announce could be made as soon as on Monday. Currently, China, Greece, India, Italy, Japan, South Korea, Taiwan and Turkey are buying Iranian oil without facing US sanctions. But such waivers would expire on May 2 and US will not be renewing it them.
WTI crude oil surges to as high 65.92 so far today. Based on current momentum. WTI could now be heading towards 77.06 high in medium term.
The week ahead: BoC, BoJ and US GDP as the major focuses
Two central banks will meet this week, BoJ and BoC. ECB will also release its monthly bulletin. BoJ is widely expected to keep monetary policy unchanged. That is, short term policy rate will be kept at -0.1%. The central bank will also continue to purchase JGB to expand monetary base at around JPY 80T annually, to keep 10-year JGB yield at around 0%. Main focus will be on BoJ's new economic projections. There is little doubt that inflation will be forecast to stay below 2% target throughout forecast horizon. And there are prospects of downgrade in both inflation and growth forecasts.
BoC is also expected to keep interest rate unchanged at 1.75%. At the March BOC meeting, Governor Stephen Poloz surprised the market by removing tightening bias in the statement and turned neutral. Moreover, the central bank acknowledged the "more pronounced and widespread" global economic slowdown. It also noted that "trade tensions and uncertainty are weighing heavily on confidence and economic activity" and "global economic prospects would be buoyed by the resolution of trade conflicts". At a speech two weeks ago Poloz reaffirmed that he has abandoned the bias for a rate hike. He reinforced that future rate decision would be "very data dependent" as "that number is going to change every time something hits the economy, whether it's a positive thing or a negative thing". We believe he would reiterate such stance at the upcoming meeting.
In addition to central bank meetings, some economic data will be closely watched. So far, data from the US have been very resilient. Q1 GDP from US should finally show how well the economy performed, in particular in response to the prospect of a trade deal with China. Durable goods orders will also be watched. From Eurozone, German ifo business climate could continue to show weak sentiments even though there might be some improvement. Australian CPI and a batch of Japanese data will also be watched.
Here are some highlights for the week:
- Monday: US existing home sales
- Tuesday: Eurozone consumer confidence; Canada wholesale sales; US house price index, new home sales
- Wednesday: Japan corporate services price, all industry index; Australia CPI; German Ifo business climate; ECB monthly bulletin; UK public sector net borrowing; BoC rate decision
- Thursday: BoJ rate decision; UK CBI industrial orders expectations; US durable goods orders, jobless claims
- Friday: New Zealand trade balance; Japan Tokyo CPI, unemployment rate, retail sales, industrial production, housing starts; Australian import price, PPI; UK BBA mortgage approvals, CBI realized sales; US GDP
Economic Indicators Update
| GMT | Ccy | Events | Actual | Forecast | Previous | Revised |
|---|---|---|---|---|---|---|
| 14:00 | USD | Existing Home Sales Mar | 5.31M | 5.51M |
GBP/USD and EUR/GBP: Can British Pound Bounce Back?
GBP/USD declined heavily and broke the 1.3050 support area. EUR/GBP is currently correcting lower, but it is still trading above a crucial support at 0.8640.
Important Takeaways for GBP/USD and EUR/GBP
- The British Pound remained in a bearish zone and declined below 1.3050 and 1.3020.
- There are two bearish trend lines in place with resistance at 1.3005 and 1.3035 on the hourly chart of GBP/USD.
- EUR/GBP traded towards the 0.8680 level before starting a downside correction.
- There is a key bullish trend line formed with support at 0.8640 on the hourly chart.
GBP/USD Technical Analysis
The British Pound struggled to stay above the 1.3120 and 1.3100 levels against the US Dollar. The GBP/USD pair started a downward move and broke the 1.3050 and 1.3020 support levels.
The pair even broke the 1.3000 support and settled below the 50 hourly simple moving average. It traded as low as 1.2978 on FXOpen, and recently started consolidating losses. It moved above the 1.2990 level and the 23.6% fib retracement level of the recent decline from the 1.3052 high to 1.2978 low.
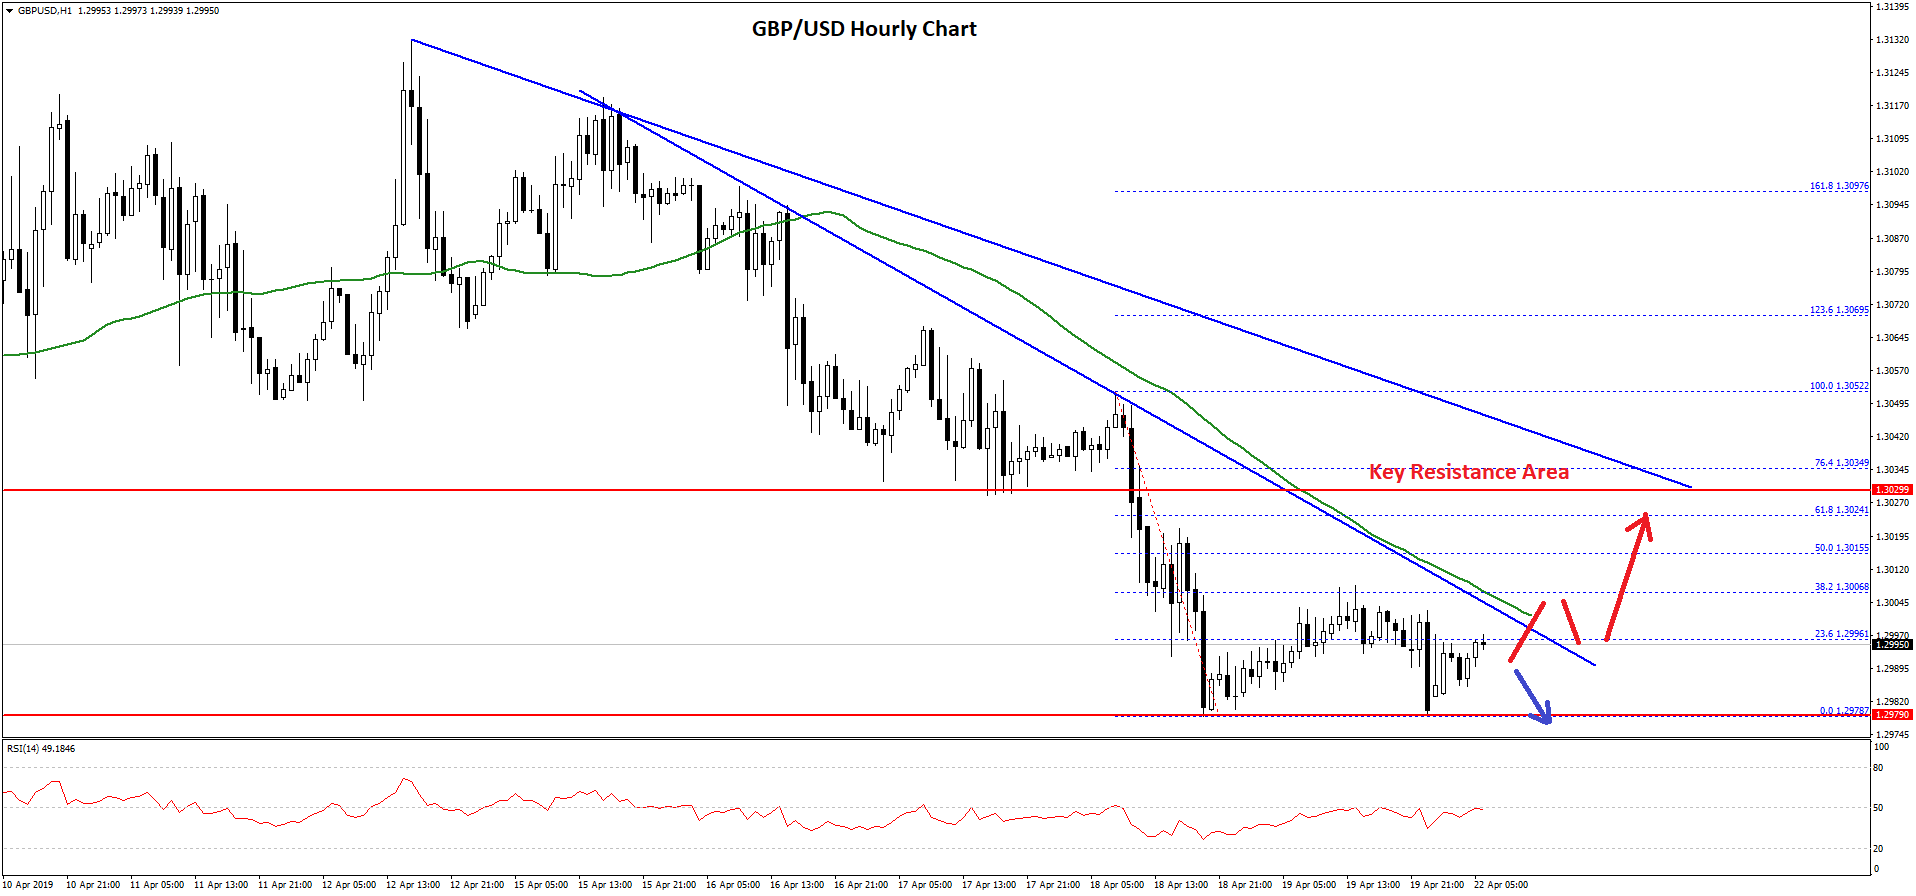
However, the pair seems to be struggling near the 1.3000-1.3010 area. It failed to break the 38.2% fib retracement level of the recent decline from the 1.3052 high to 1.2978 low.
There are also two bearish trend lines in place with resistance at 1.3005 and 1.3035 on the hourly chart of GBP/USD. The first trend line holds the key near 1.3005 since it coincides with the 50 hourly SMA.
If there is a successful break above 1.3005, the pair could recover towards the 1.3030 and 1.3040 levels. On the other hand, if the pair fails to climb above 1.3005, there could be more losses in the near term.
An initial support is at 1.2980, below which the pair may perhaps extend losses towards the 1.2965 or 1.2950 level.
EUR/GBP Technical Analysis
The Euro gained advantage of the British Pound weakness and climbed above the 0.8600 level. The EUR/GBP pair climbed above the 0.8640 and 0.8650 levels to move into a positive zone.
The pair tested the 0.8680 level and recently started a downside correction. It broke the 0.8660 and 0.8650 levels. A swing low was formed at 0.8635 and the pair recently recovered above the 0.8640 and 0.8645 levels.
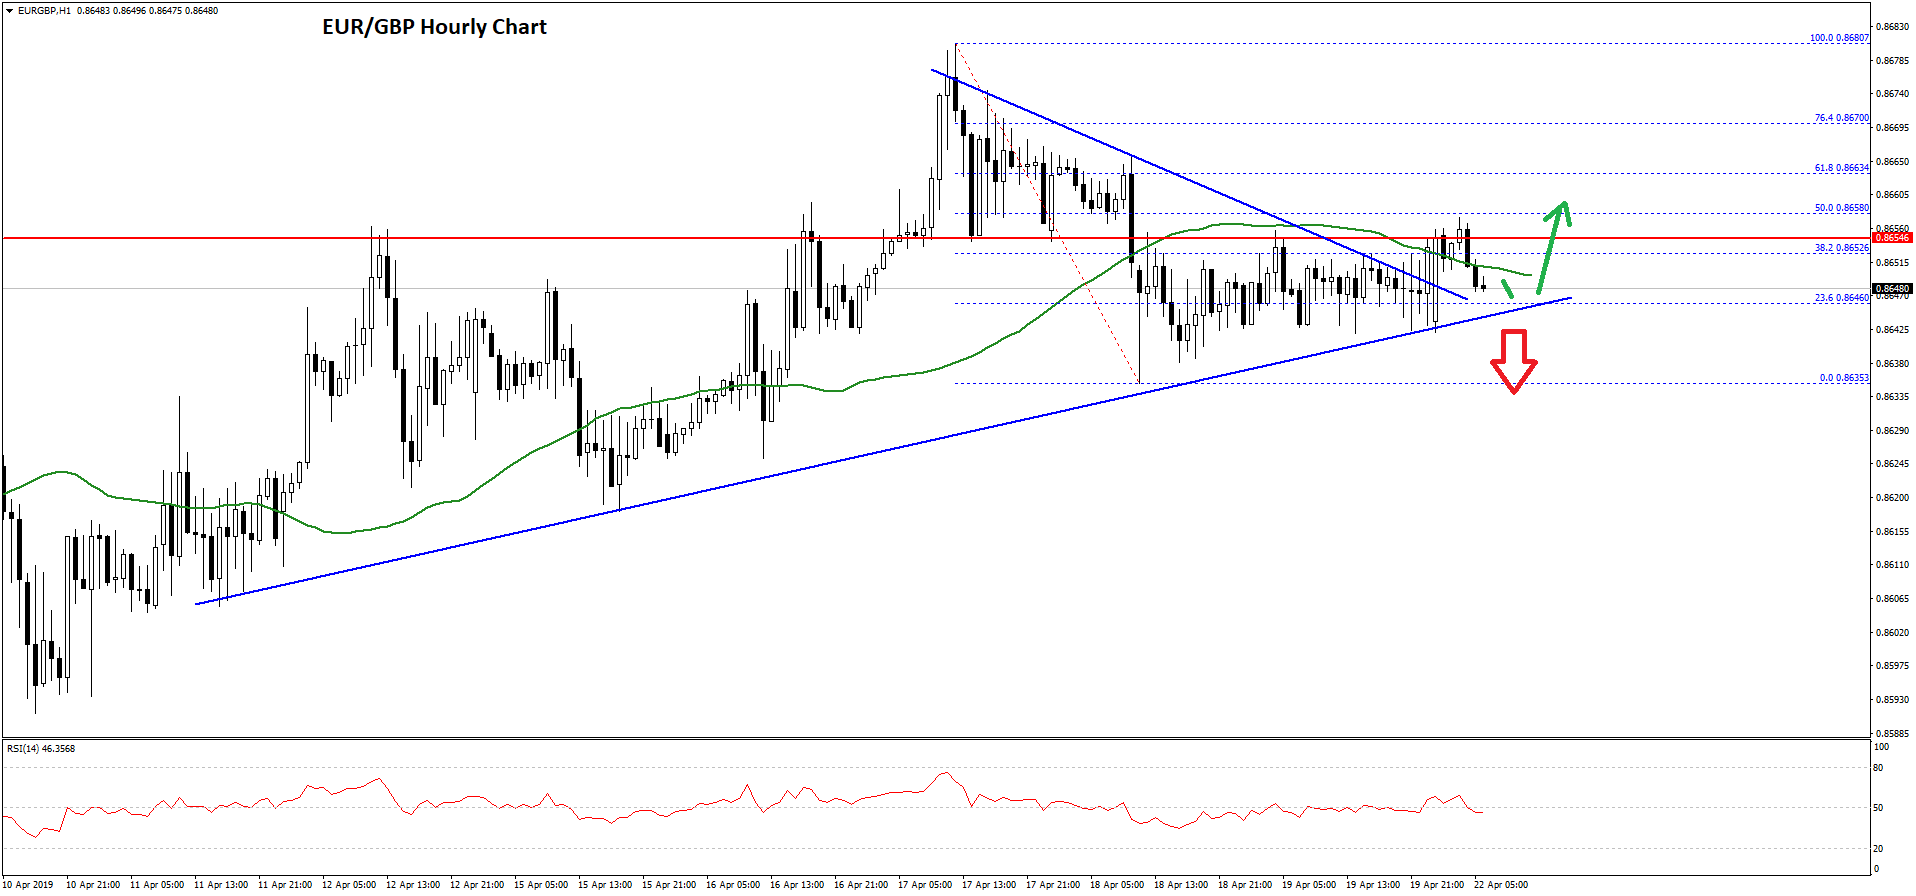
It even broke a connecting bearish trend line at 0.8645 on the hourly chart, plus the 23.6% fib retracement level of the last drop from the 0.8680 high to 0.8635 low.
However, the pair struggled near 0.8655 and remained below the 50% fib retracement level of the last drop from the 0.8680 high to 0.8635 low. On the downside, there is a strong support in place near the 0.8640 level.
There is also a key bullish trend line formed with support at 0.8640 on the hourly chart. If there is a close below the trend line and 0.8635 swing low, there could be a downside extension below the 0.8620 level.
The next key support is at 0.8600, where buyers are likely to appear. Conversely, if EUR/GBP stays above the trend line support, there are chances of a fresh increase above the 0.8655 and 0.8660 levels in the near term. The next main resistances are 0.8680 and 0.8700.