

Sample Category Title
Canada: Consumer Prices Accelerate to 1.9% in March as Past Price Declines Fade
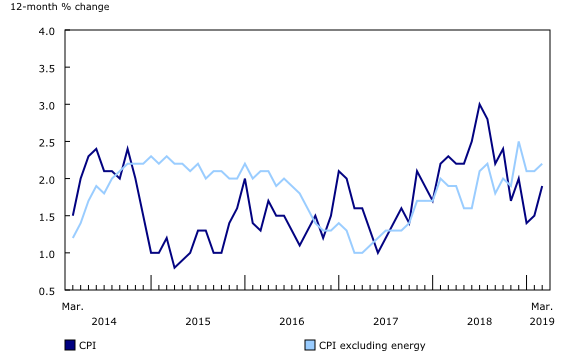
- The consumer price index accelerated to 1.9% year-on-year (from 1.5% in February) on par with the consensus forecast as the drag from past declines in energy prices diminished. Year-on-year, energy prices were down 1.2%, but this was up from -5.7% in February.
- Food price inflation accelerated to 3.6% in March from 3.2% in February.
- More broadly, goods price inflation accelerated to 1.5% (from 0.6% y/y), but service price growth edged modestly lower (to 2.2% from 2.3% in February).
- On a seasonally-adjusted basis, prices were up 0.2% month-on-month. Gains were relatively broad-based with only household operations (-0.2%) and clothing and footwear (-0.4%) pulling back.
- Two of three core inflation measures edged higher in the month. CPI-median moved to 2.0% (from 1.9%) and CPI-trim hit 2.1% (from 2.0%). The CPI-common measure was unchanged at 1.8%. On average, the three core measures are at 2.0%.
Key Implications
- Inflation made a bit of a comeback in March, but mostly as past declines in prices dropped out of the year-on-year calculation. Still, it was enough to push the average of core measures to the 2.0% mark.
- A softer Canadian dollar relative to its year-ago level tends to show up in higher goods prices, and some of this pass through came through in March's reading. Assuming a relatively stable loonie going forward, this impact will not last.
- With the Canadian economy going through a soft spot, this data will have little impact on the Bank of Canada's decision making. Indeed, the weakness in the international trade data (also released today) augurs for continued caution from the central bank.
Canadian Inflation Returns to Nearly 2% as Energy Prices Rise
- As expected, all items CPI rose 0.7% month-over-month in March as gasoline prices jumped nearly 12%
- Energy was also the driving force behind year-over-year inflation rising to 1.9% from 1.5% in February
- Seasonal monthly increases in travel services and clothing prices had little impact on the year-over-year rate
- The BoC’s core inflation measures ticked back up to 2.0% year-over-year in March, remaining in the tight range seen since the start of 2018
As expected, headline inflation bounced back to nearly 2% in March after starting the year closer to 1.5%. That’s largely an energy story, though, as the decline in gasoline prices late last year (driven by lower global oil prices) continues to be reversed. Rising rent and mortgage interest costs are also serving to boost headline inflation. Otherwise, core inflation remains well behaved, with the BoC’s preferred measures averaging 1.9-2.0% for more than a year now. Today’s CPI report isn’t the only evidence of limited price pressure. The BoC’s Q1 Business Outlook Survey released earlier this week showed little evidence of input or output price inflation, while firms’ inflation expectations moderated. We think Monday’s BOS, which more broadly showed deteriorating business sentiment early this year, sets up for a dovish tone from the Bank of Canada next Wednesday. Today’s CPI report does little to change that.
Canadian dollar jumps as core CPI accelerated in March
Canadian Dollar rises in early US session as core inflation came in higher than expected. Headline CPI rose 1.9% yoy in March, accelerated from 1.5% yoy but matched expectation. CPI core common was unchanged at 1.8% yoy, matched expectations. However, CPI core median accelerated to 2.0% yoy, up from 1.8% yoy and beat expectation os 1.8% yoy. CPI core trim rose to 2.1% yoy, up from 1.9% yoy and beat expectation of 1.8% yoy.
Also from released, Canada trade surplus was smaller than expected at CAD 2.9B in February. US trade deficit narrowed to USD -49.4B in February.
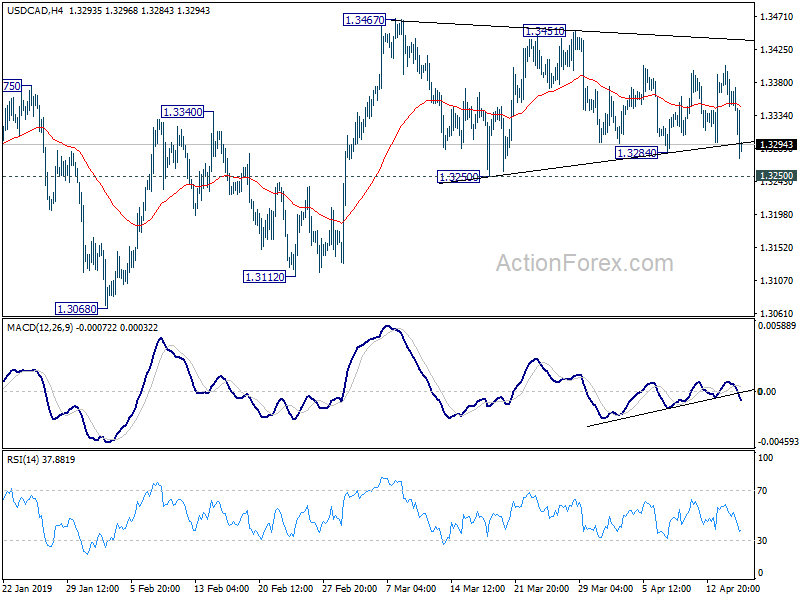
USD/CAD dips through 1.3284 support after the releases. But it's staying above 1.3250 support. There is no change in the view that it's in consolidation pattern from 1.3467. Rise from 1.3068 is expected to resume sooner or later.
WTI Crude – Buoyed by Inventory and China Data
WTI crude is trading half a percentage point higher on Wednesday, continuing recent gains following a brief spell of consolidation.
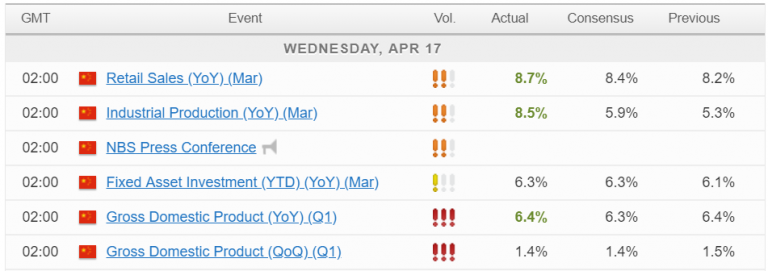
The Chinese data may not have been the catalyst for the recent gains in oil prices – taking Brent to fresh five month highs and WTI just shy – but it may well be helping to sustain them. We haven’t seen much of a corrective move since the rally on Tuesday which suggests there may be more to come.
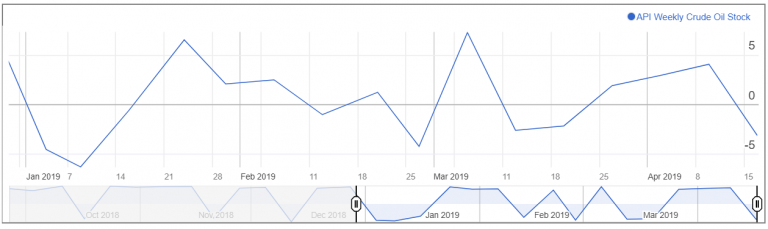
A surprise drawdown in inventories gave oil prices a nice boost just as people appeared to be starting to question the sustainability of the rally. This came after three consecutive weeks of gains as it appeared that demand was slipping just as OPEC+ cuts were starting to bite.
What may support this view is the fact that price has barely surpassed the previous peak in Brent and it’s already stalled, while the momentum indicators aren’t particularly supportive of the bullish case.
WTI Crude Daily Chart
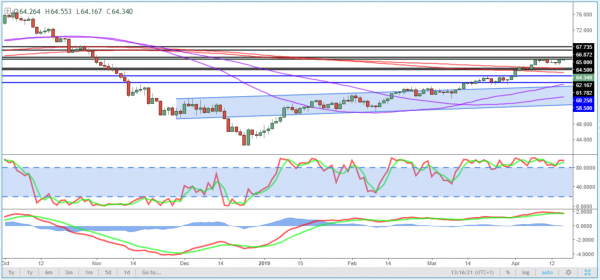 Still, the market can continue to rally in the absence of momentum and if WTI breaks above $65, then $67-67.50 could offer further resistance.
EIA will release their inventory data on Wednesday, which is generally more widely followed than the API number so could trigger more of a market reaction if the number is confirmed or added to.
AUD/USD Outlook: Strong China’s Data Pushed Aussie through Key Barriers
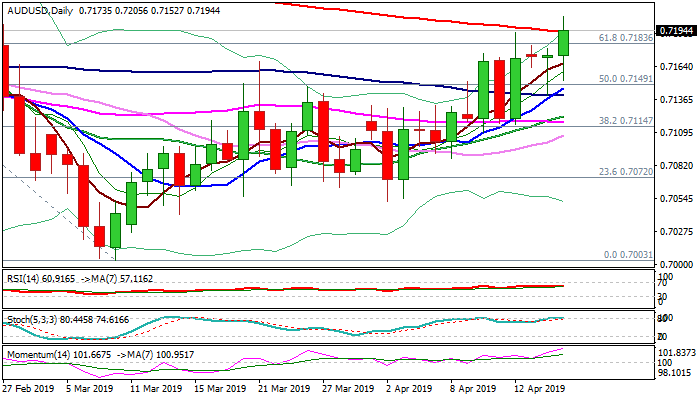
The Aussie dollar maintains positive tone and holding near two-month high at 0.7205 at the beginning of US session on Wednesday. Stronger than expected data from China that showed faster than expected economic growth, boosted Australian dollar for probe above key barriers at 0.7183/93 (cracked Fibo 61.8% of 0.7295/0.7003 descend / 200SMA). Fresh bulls signal continuation after the price action in past two days ended in Doji candles, with Tuesday ones being long-tailed. Close above cracked Fibo barrier (0.7183) is needed for initial bullish signal, while sustained break above 200SMA (0.7193) will confirm break and unmask targets at 0.7226 (Fibo 76.4%) and 0.7270 (weekly clod base). Improved sentiment after data adds to positive techs which maintain strong bullish momentum. Caution on overbought slow stochastic and bearish divergence forming that could have stronger impact on bulls if Aussie fails to eventually close above broken Fibo barrier at 0.7183.
Res: 0.7205; 0.7226; 0.7245; 0.7270
Sup: 0.7140; 0.7120; 0.7097; 0.7075
DAX Rally Continues, But Will German Manufacturing PMI Spoil the Party?
The DAX index continues to roll and has posted gains of 1.2 percent this week. On Wednesday, the DAX is at 12,148, up 0.39% on the day. In economic news, eurozone CPI dipped to 0.8%, matching the forecast. The eurozone trade surplus jumped to EUR 19.5 billion in February, its highest level since April. On, Thursday, Germany and the eurozone release services and manufacturing PMIs.
The German manufacturing sector have taken a beating, courtesy of the global trade war which has dampened demand for German exports and hurt the country’s massive auto industry. This has resulted in recent declines in manufacturing PMI reports. The markets are braced for another soft score for March, with an estimate of 45.2 points. The services PMIs have been indicating healthy expansion, but more bad news from manufacturing could unnerve investors and send the euro downwards.
Investors reacted positively to a milestone reading from the German ZEW economic sentiment survey. The key indicator had been mired in negative territory for the past 12 months, and finally climbed into territory in April. The score of 3.1 points to slight optimism on the part of institutional investors and analysts. The eurozone indicator showed a similar trend, climbing to 4.5 points, its first gain since May. The improvement in investor mood is attributable to the Brexit extension, which will give the parties time until October to try to reach a resolution to the deadlock. The ZEW said that investors were hopeful that the global economy would develop “less poorly” than expected. At the same time, eurozone growth remains weak and Germany is expected to cut its growth forecast for 2019, a result of a drop in exports.
Into US session: AUD strongest on China data, German and US yields jump
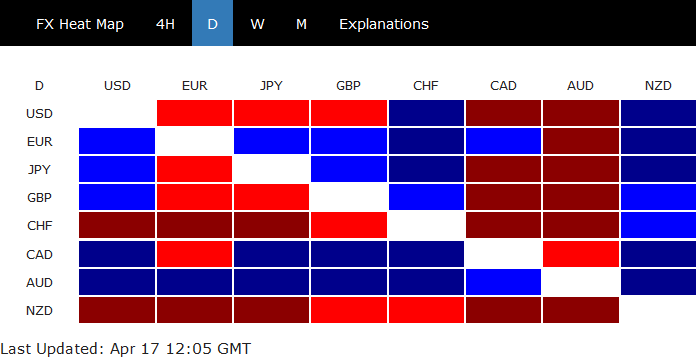
Entering into US session, Australian Dollar remains the strongest one for today, as boosted by better than expected Chinese data. The data further suggests stabilization of slowdown, which is an important factor for the easing global economic risks. While the optimism is not so much reflected in the stock markets, bonds are clearly responding well. German 10-year yield is is now back at 0.08 level while US 10-year yield breaches 2.6 handle.
Staying in the currency markets, Euro is the second strongest for today. German government halved 2019 growth forecast to just 0.5%. But it's largely shrugged off. The key is, Eurozone economy as a whole will certainly be benefited if China could regain some momentum. Canadian Dollar is the third strongest, but could be dragged down by CPI release. On the other hand, New Zealand Dollar is the weakest one as poor Q1 CPI reading raises the chance of an imminent RBNZ cut at next meeting. Swiss Franc and Dollar are the next weakest. Sterling is mixed after slightly lower than expected March CPI.
In Europe, currently:
- FTSE is down -0.11%.
- DAX is up 0.32%.
- CAC is up 0.28%.
- German 10-year yield is up 0.0111 at 0.082.
Earlier in Asia:
- Nikkei rose 0.25%.
- Hong Kong HSI dropped -0.02%.
- China Shanghai SSE rose 0.29%.
- Singapore Strait Times rose 0.50%.
- Japan 10-year JGB yield rose 0.01 to -0.01.
European Update – Markets Shrug Off Chinese Data
Chinese economic reports encouraging
It’s been a sluggish start to the trading week, with there being no lack of market headlines but rather little movement on the back of it.
We’re seeing small gains in Europe early in the day and US futures are posting marginal gains, continuing the trend we’ve been seeing this week.
Take this morning for example. We were treated to a selection of expectation-beating economic reports from the world’s second largest economy and investors simply shrugged it off like it does really matter. Except it very much does and a slowdown in China – which remains locked in a trade war with the US – has contributed to expectations of slower global growth this year.
I’m not one to get carried away with one batch of encouraging data and the longer term trend is very much against China, but these numbers may at least suggest all is not as bad as feared. And if a trade deal is struck in the coming months with the US, as many expect, perhaps things could even improve.
EUR/USD – Euro Edges Higher As Eurozone Inflation As Expected
EUR/USD continues to have an uneventful week. On Wednesday, the pair is trading at 1.1308, up 0.24% on the day. On the release front, eurozone CPI dipped to 0.8%, matching the forecast. The eurozone trade surplus jumped to EUR 19.5 billion in February, its highest level since April. There are no major U.S. events on the schedule. Thursday will be busy on both sides of the pond. Germany and the eurozone release services and manufacturing PMIs, and the U.S. posts retail sales and unemployment claims.
Eurozone inflation is steady, but remains well below the ECB target of 2.0 percent. The eurozone annual inflation rate edged lower to 1.4% in March, compared to 1.5% in February. Low inflation means that the ECB is not under pressure to raise interest rates. After last week’s policy meeting, Mario Draghi noted that the economic outlook for the eurozone remains weak. With no interest hikes in sight and a sluggish eurozone economy, the euro will have likely have trouble making headway against the U.S. dollar.
There was positive news from the German ZEW economic sentiment survey, a key gauge of investor confidence. The indicator has been mired in negative territory for the past 12 months, and finally climbed into territory in April. The score of 3.1 points to slight optimism on the part of institutional investors and analysts. The eurozone indicator showed a similar trend, climbing to 4.5 points, its first gain since May. The improvement in investor mood is attributable to the Brexit extension, which will give the parties time until October to try to reach a resolution to the deadlock. The ZEW said that investors were hopeful that the global economy would develop “less poorly” than expected. At the same time, eurozone growth remains weak and Germany is expected to cut its growth forecast for 2019. This is largely a result of the global trade war, which has hurt the German export sector.
Some Insights into RBA’s Employment Puzzle. Cyclical Jobs are Slowing; Supporting Rate Cut
The minutes of the April monetary policy meeting of the Reserve Bank Board have provided the clearest signal yet that the Bank would be prepared to cut the cash rate.
Firstly, the final section "Considerations for Monetary Policy" states "a lower level of interest rates could still be expected to support the economy through a depreciation of the exchange rate and via reducing required interest payments on borrowing, freeing up cash for other expenditure".
The Board even sets out the conditions for a rate cut, "members also discussed the scenario where inflation did not move any higher and unemployment trended up, noting that a decrease in the cash rate would likely be appropriate in these circumstances".
Recently the latest quarterly breakdown of employment by industry printed for the year to February.
We have considered this industry breakdown to try to find some insights into the RBA's "tension" between the GDP and Employment Reports.
For a start it is reasonable to separate out the employment data into "cyclical" and "non-cyclical" sectors.
We have looked at "non-cyclical" covering: public administration; education and training; health care; and utilities.
Cyclical sectors are considered to be the other thirteen including: construction; manufacturing; retail and wholesale trade; accommodation; transport; finance; mining; real estate; recreation; and media.
The "non-cyclical "group has increased as a proportion of total employment from 27.9% in February 2008 to 31.9% in February 2019. That 4% increase in share represents 510,000 jobs in today's workforce.
The cyclical group has fallen as a proportion of the workforce from 64.6% in February 2008 to 59.4% in February 2019.
It is important to note that "public administration" has increased by 18% over the last year but we assess that a considerable part of that increase has been due to reclassification of health and education workers from "private" to "public".
Because we are including public; education; and health in the noncyclical category the reclassification does not distort the results.
Finally we have one remaining category – "professional services". This group represents 8.7% of total employment covering: management consulting; computer system design; accounting services; legal services; and engineers. This category represents 8.7% of total employment having increased from 7.4% in February 2008.
Consider Table 1 to assess whether there has been any evidence of the impact of the slowdown in growth in the economy on employment. The table uses the six month annualised growth rate for jobs in the three categories (using a two quarter average to smooth the series).
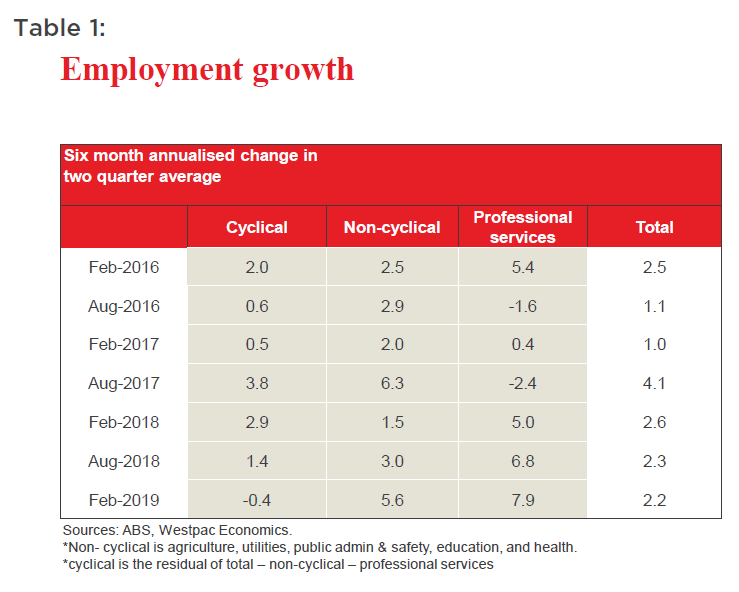
The following observations are relevant:
- As noted by the RBA, overall momentum in the jobs market has held fairly steady over the last 18 months despite the slowdown in economic growth (2.6% in the six months to February 2018 to 2.2% in the last six months).
- However, momentum in the "cyclical" sectors has slowed markedly from 2.9% in the six months to February 2018 to –0.4% in the six months to February 2019.
- Momentum in the "non-cyclical" sectors has lifted considerably from 1.5% to 5.6% over the same period.
- The professional services sector has been booming.
So the "puzzle" about the labour market is not as opaque as might be expected. Non-cyclical jobs (dominated by government) have been strong and this sector is increasing as a proportion of total employment. Cyclical sectors are slowing markedly and are falling as a proportion of total employment. Given the lags and the cautious outlook for growth, employment in these sectors is likely to continue to slow.
It is not clear whether the "professional services" sector best fits in the cyclical or the non-cyclical categories. Certainly, strong government spending in the infrastructure space is likely to explain a considerable part of the success of this category; the sharp lift in government regulations is also supporting this sector. Furthermore, there is also likely to be a structural element to the success of this sector as companies embrace technology to boost productivity and substitute labour.
Conclusion
The Board of the RBA has nominated the labour market as the key for the policy outlook. We are disappointed that ongoing low inflation and the persistent need to lower growth forecasts seems to be out-weighed by the employment "story".
Our analysis points to a marked slowdown in jobs growth already being well underway in the cyclical sectors of the economy.
We expect that eventual recognition of these facts will keep the RBA on track for our expected first rate cut in August.