

Sample Category Title
Australian Employment: March Labour Force Prints a Robust Employment Gain
March Labour Force Survey: Total employment: 25.7k from 10.7k (revised from 4.6k). Unemployment rate: 5.0% from 4.9% (unrevised 4.9%). Participation rate: 65.7% from 65.6% (unrevised 65.6%).
Total employment rose 25.7k in March, stronger than the market median estimate of 15k. The three month average is now 23.7k, from 21.8k in February, indicative of a robust trend in the labour market so far in 2019. In the year to March employment has lifted 305k or 2.4%. Our Jobs Index is pointing a pace of growth around 2.3%yr while jobs ads suggest that while growth should be a little softer than this it still should be stronger than 2%yr.
A further indication of the robust nature of labour demand is that full-time employment rose 48.3k in March, to be up 289.8k/3.4% in the year, while hours work lifted 0.7% in the month to be up 3.0%yr.
In March the unemployment rate did drift higher, from 4.9% to 5.0% (4.94% to 5.05% so a whisker away from rounding to 5.1%) as the lift in participation (65.66% from 65.58%) resulted in a 42.7k gain in the labour force. The labour force grew at a 2.0% pace in the year to March.
By state unemployment was flat in NSW at a national low of 4.3% (employment fell 2.6k following a –6.7k in February) while it fell to 4.6% in Victoria from 4.7% even though there was a robust 10.0k gain in employment following a solid 6.4k gain in February. For now, even though the labour market is softening in NSW in terms of employment unemployment is holding the record low with the support of falling participation. NSW has had a great degree of weakness in cyclical industries than other states at this point in time (construction and production in particular) while it is also reporting job shedding in some structural sectors (health & education).
Unemployment is lifting in Victoria as participation there continues to drift higher. Victoria is also the state that has reported strong gains in government as well as white collar employment that is more than offsetting only modest weakness in cyclical sectors For further information please see "Some insights into the RBA employment puzzle" and "Australian employment gains have been in while collar industries").
Outside of Victoria the other states to make a positive contribution to employment in March was Qld with +10.4k (unemployment rose to 6.1% from 5.4% on rising participation) and South Australia with +8.5k (unemployment rose to 5.9% from 5.7% on rising participation).
March was a positive update from the Labour Force Survey suggesting that the non-cyclical side of the economy (we suspect the ongoing rollout of the NDIS is supporting gains in not just health professionals but also in white collar professionals) is providing ongoing support for employment gains especially outside of NSW.
But note, the state that is on the forefront of the downturn in dwelling investment, NSW, has seen trend in employment gains slow from 50.5k per month in January to 13.7k per month in March. We are closely watching the impact that the downturn on construction, and the impact of falling house prices will have on consumption, will have on the cyclical employment in that state.
Gold Price Daily Chart Signaling Bearish Continuation
Key Highlights
- Gold price topped near the $1,346 level in Feb 2019 and later corrected lower.
- There is a crucial declining channel formed with resistance at $1,292 on the daily chart of XAU/USD.
- China's GDP grew 6.4% in Q1 2019 (YoY), more than the 6.3% forecast.
- The US Retail Sales in March 2019 could increase 0.9% (MoM), better than the last -0.2%.
Gold Price Technical Analysis
There was a strong rise in gold price in January and February 2019 above $1,300 against the US Dollar. The price even broke the $1,325 resistance, formed a top near $1,346, and recently corrected lower.
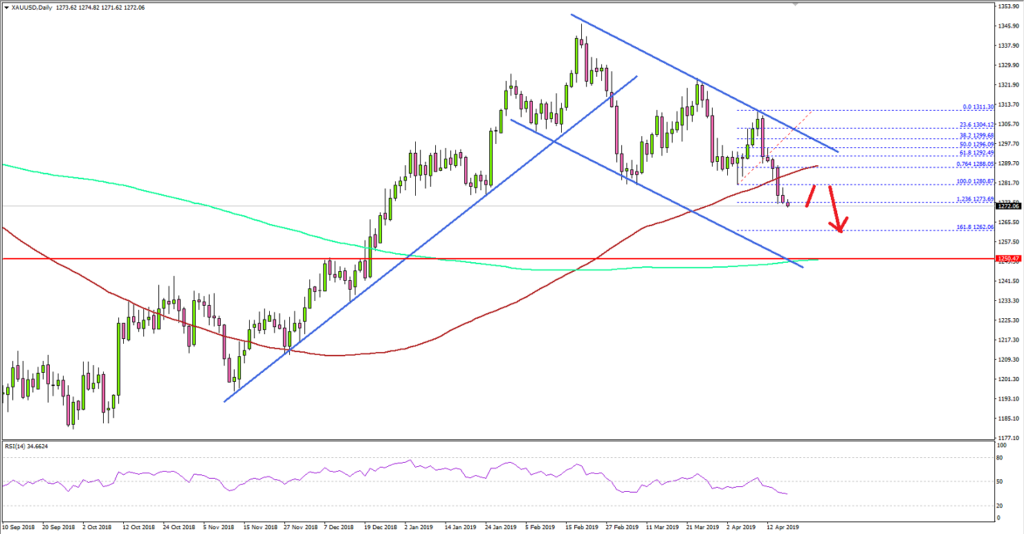
The daily chart of XAU/USD indicates that the price declined below the $1,320 support level and a major bullish trend line to move into a bearish zone. The price even broke the $1,310 and $1,300 support levels to enter a bearish zone.
Intermediately, there were a couple of swing lows formed near $1,282. The last low was near $1,280 before the price rebounded above $1,300. However, the price failed to clear the $1,310 resistance and declined back below $1,300.
There was a break below the $1,280 low and the price tested the 1.236 Fib extension level of the last wave from the $1,280 low to $1,311 high.
It seems like there is a crucial declining channel in place with resistance at $1,292 on the same chart. Therefore, there is a risk of more losses below the $1,270 level in the near term.
The next major support is at $1,262 and the 1.618 Fib extension level of the last wave from the $1,280 low to $1,311 high. However, the main support is at $1,250 and the 200-day simple moving average (green).
Looking at the major pairs, EUR/USD recovered recently above 1.1250, but GBP/USD remains at a risk of more losses below 1.3050.
Economic Releases to Watch Today
- Germany's Manufacturing PMI for April 2019 (Preliminary) – Forecast 45.0, versus 44.1 previous.
- Germany's Services PMI for April 2019 (Preliminary) – Forecast 55.1, versus 55.4 previous.
- Euro Zone Manufacturing PMI April 2019 (Preliminary) – Forecast 47.9, versus 47.5 previous.
- Euro Zone Services PMI for April 2019 (Preliminary) – Forecast 53.2, versus 53.3 previous.
- UK Retail Sales for March 2019 (YoY) – Forecast +4.6%, versus +4.0% previous.
- UK Retail Sales for March 2019 (MoM) – Forecast -0.3%, versus +0.4% previous.
- US Manufacturing PMI for April 2019 (Preliminary) – Forecast 52.8, versus 52.4 previous.
- US Services PMI for April 2019 (Preliminary) – Forecast 55.0, versus 55.3 previous.
- US Initial Jobless Claims – Forecast 205K, versus 196K previous.
- US Retail Sales March 2019 (MoM) – Forecast +0.9%, versus -0.2% previous.
Daily Markets Broadcast
Wall Street struggles to make further headway
Despite strong Q1 growth data from China and strong earnings reports from the transport sector, US indices struggled to post additional gains, with only the NAS100 index moving higher. The Australian jobs report is due today.
US30USD Daily Chart
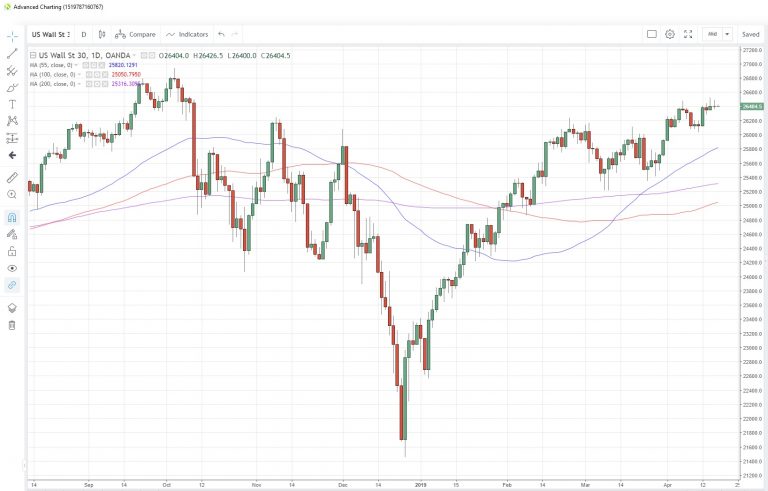
The US30 index gave back early gains to close little changed yesterday after failing to push above Tuesday’s six-month high
The rising 55-day moving average support is at 25,820 today
US retail sales are expected to grow 0.9% m/m in March, according to the latest survey. That would be the fastest increase since September 2017.
DE30EUR Daily Chart
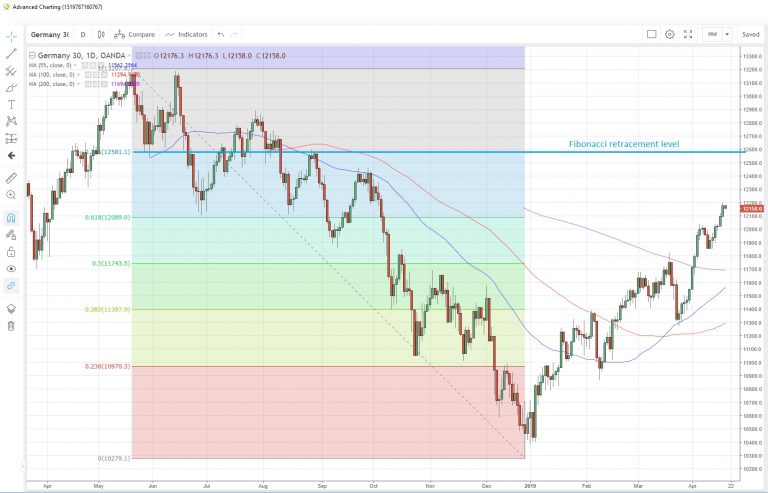
The Germany30 index rallied for a sixth consecutive day yesterday, assisted by the better performance by the Chinese economy
The index touched the highest since October 5 and is now comfortably above the 61.8% Fibonacci retracement level of the May-December drop at 12,089. The 78.6% retracement is at 12,581
Germany’s Markit flash manufacturing PMI is seen rising to 45.0 in April from 44.1 in March. The services PMI is expected to slip to 55.1 from 55.4.
AU200AUD Daily Chart
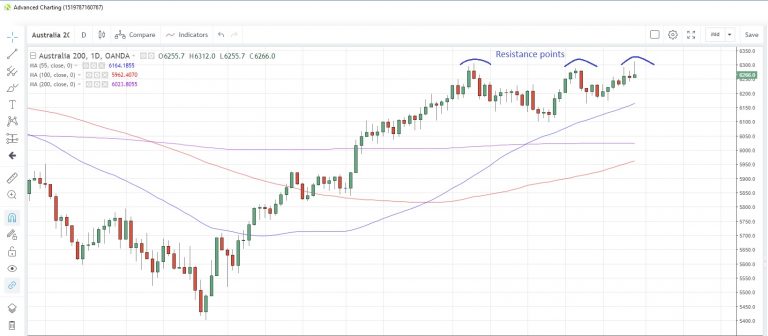
The Australia200 index climbed to the highest since September 4 in early trading this morning ahead of the March employment report
The index could be facing tough resistance above 6,300, with three recent highs failing to close above the level
The Australian economy probably added 12,000 jobs in March, according to the latest survey. The unemployment rate is expected to tick higher to 5.0% from 4.9%.
US Crude Oil Inventory Surprisingly Declined as Production and Imports Trimmed
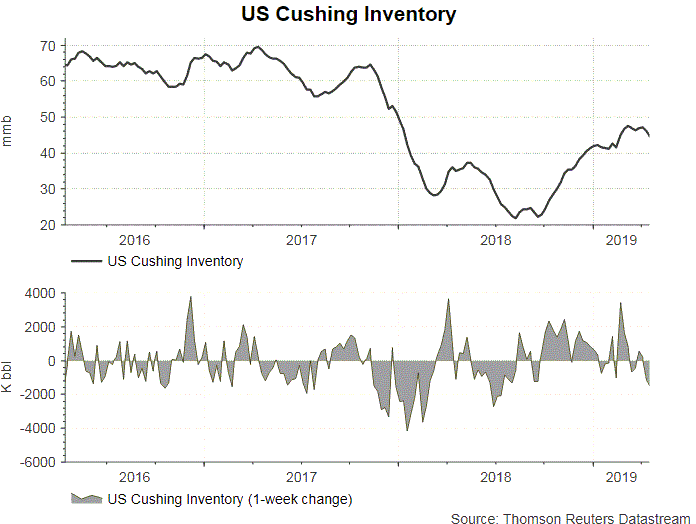
The report from the US Energy Information Administration (EIA) shows that total crude oil and petroleum products (ex. SPR) stocks surged +7.22 mmb to 1229.13 mmb in the week ended April 12. Crude oil inventory surprisingly dropped -1.4 mmb to 455.15 mmb (consensus: +1.71 mmb). Inventories declined in 3 out of 5 PADDs with PADD 2 (Midwest) seen a -2.42 mmb decrease. Meanwhile, Cushing stock fell -1.54 mmb to 44.45 mmb. Utilization rate added +0.2% to 87.7% while crude production slipped -0.1M bpd to 12.1M bpd for the week. Crude oil imports decreased -0.61M bpd to 5.99M bpd in the prior week.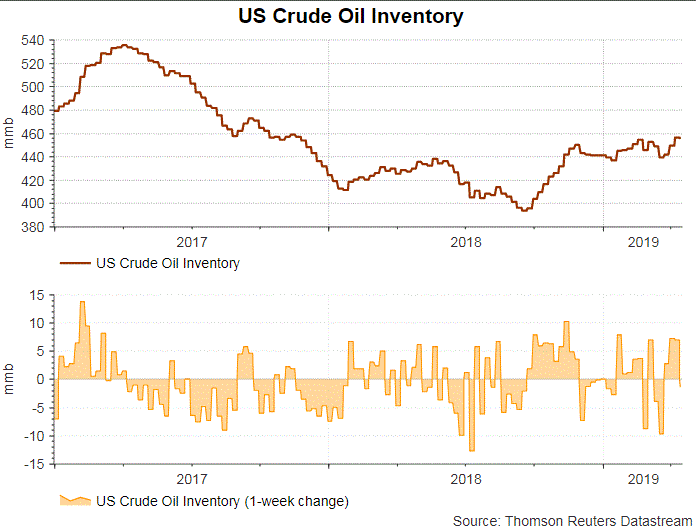
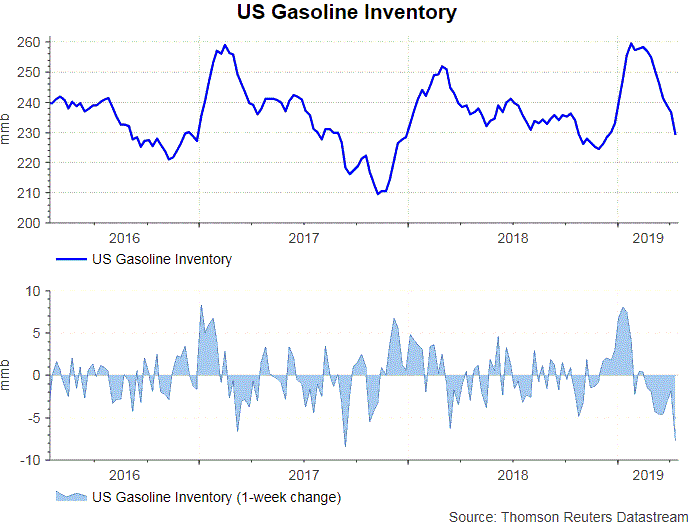
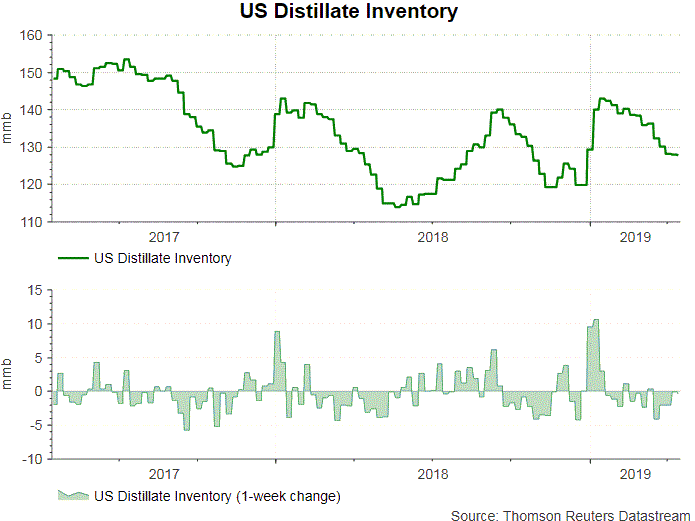
Concerning refined oil product inventories, gasoline inventory declined -1.17 mmb to 227.96 mmb although demand plunged -3.94% to 9.42M bpd. The market had anticipated a -2.13 mmb drop in stockpile. Production slipped -0.37% to 10.086 bpd while imports jumped +38.66% to 0.0.99M bpd during the week. Distillate inventory fell -0.36 mmb to 127.69 mmb. Demand lsumped -11.27% to 3.78M bpd. The market had anticipated a -0.85 mmb decline in inventory. Imports soared +40.82% to 0.14M bpd while production slid -4.27%to 4.82M bpd during the week.
 Released after market close on Wednesday, the industry- sponsored API estimated that crude oil inventory decreased -3.1 mmb during the week. For refined oil products, gasoline stockpile drew -3.56 mmb while distillate added +2.3mmb.
Healthcare Stocks Get Burn-ied
Healthcare stocks get burn-ied
Wall Street shrugged off much improved US trade figures, and a slight China GDP beat, as Presidential hopeful Bernie Sanders’ “Medicare for all” comments saw healthcare sector stocks take fright. This took the edge of generally upbeat earnings from heavyweights such as Morgan Stanley and PepsiCo, ensuring the leading indices ended with a whimper rather than a shout. The S&P 500 fell 0.25%, the Nasdaq was down 0.05%, and the Dow Jones finished flat.
With delegates scheduled to fly between Washington DC and Beijing twice in the next few weeks, further progress in the US-China trade talks was largely ignored. Despite this, as well as upbeat earnings, robust data from China and dovish central banks with their hands ready at the monetary policy taps, the stock markets and oil continue to bumble along in sideways ranges, unable to push on to new highs. This combined could suggest that a lot of good news – both present and future – is already baked into prices at these levels. Ahead of the extended Easter holidays and into the end of the month, the markets may be much more vulnerable to negative headlines then they have been in recent times.
Australia will take the spotlight in Asia Pacific this morning with the release of their employment change data. With the Reserve Bank of Australia vexed at stubbornly low inflation even as jobs hold up (much like its Kiwi neighbour), a low print today could see the noise for a rate cut reach deafening levels. This could also have an out-sized downward effect on the Australian dollar (AUD), which currently sits at 0.7160. The consensus is for a rise of 15,000 jobs, but frankly, the data set is notoriously volatile. Expect some fireworks at 0930 Singapore time.
The Easter egg hunt continues this evening in the States with the release of Retail Sales. The street is expecting a rebound higher from last months -0.2% to 0.9%. Again, with so much global recovery/soft landing hope backed into equity and energy prices, a miss could have an out-sized negative effect.
FX
Major currencies were becalmed overnight yet again as the volatility flatline continues. More action was seen in the emerging markets (EM) space with the US dollar weakening as traders repriced the better-than-expected China GDP print in EM currencies. That theme should continue in Asia where we expect regional currencies to continue their gradual move higher.
Australian data at 0930 Singapore could have an out-sized impact on the AUD today if the print is below expectations. The AUD is currently at 0.7160 against the greenback, with 0.7000 the crucial long-term support level. Traders can look to the New Zealand dollar (NZD) for precedent, where a slight miss on yesterday’s CPI data saw the NZD fall 1.50% at one stage.
The Indonesian Rupiah has rallied from 14,150 against the dollar to 14,085 as exit polls suggest the incumbent “Jokowi” has won yesterday’s presidential election. The official results aren’t released until early May, but polls suggest a handsome margin of victory for the candidate, who is seen as much more markets and investment friendly.
Equities
With much of the region heading into the Easter break tomorrow, trading will likely be muted on the region’s stock markets today. The rather sanguine response to the China GDP print by China’s various stock markets suggests there is more than a little buyers fatigue for now. Jakarta should respond positively to the unofficial election results, with Australian stocks in line for a potential boost if the street decides the RBA rate cut is closer post the employment data.
Oil
Oil eased overnight ostensibly on lower official inventory drawdown data from the US, with both Brent Crude and WTI struggling to make new topside in recent times. It’s likely the real reasons behind this are buyer’s fatigue, nervous longs and the still very overbought technical indicators.
Brent fell 0.15% to USD71.60 a barrel and WTI was down 0.50% to USD63.75 a barrel. Asia will likely be cautious about putting on new longs today ahead of the Easter break and the sideways price action of late.
Gold
With the US dollar stubbornly firm, improving economic data and the trade talks making tangible progress, the reasons for holding gold continue to diminish as investors rotate from defensive positioning. After gold’s meltdown on Tuesday – it fell below the crucial USD1,280.00 an ounce support level – it dropped again overnight to close at USD1,273.50 an ounce, below secondary support at USD1,275.00.
Interest has clearly waned in the yellow metal for now, with the charts now wide open until USD1,245.00 an ounce. From a technical perspective, gold must recapture the USD1,275.00/1,280.00 region quickly, or the run for the exit door may become a stampede.
USDCHF Moves Towards Major Resistance
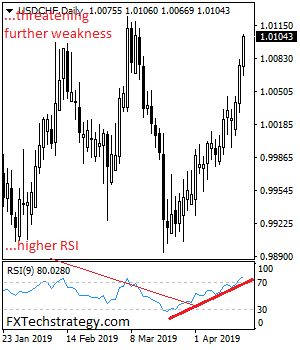
USDCHF moves towards major resistance residing at 1.0127 area. Resistance stands at the 1.0127 level. A break of there will clear the way for a run at the 1.0150 level. Above here, resistance lies at the 1.0200 level and then the 1.0250 level. On the downside, support is seen at the 1.0000 level. A turn below here will set the stage for more decline towards the 0.9950 level. And then the 0.9900 level. Further down, support resides at the 0.9850 level. All in all, USDCHF moves towards major resistance on further bull pressure.
Eco Data 4/18/19
[php_everywhere instance="1"]
EU announced tariff lists countering unfair US subsides on Boeing
EU formally announced the list of US imports to be targeted for tariffs as countermeasures on US subsidies to Boeing. The list covers a range of items, from aircrafts to chemicals and agri-food products (including everything from frozen fish and citrus fruits to ketchup), that overall represent around USD20B of US exports into EU. The final list will take into account results of public consultation and WTO arbitrator's decision.
EU Trade Commissioner Cecilia Malmström said: "European companies must be able to compete on fair and equal terms. The recent WTO ruling on U.S. subsidies for Boeing is important in this respect. We must continue to defend a level-playing field for our industry. But let me be clear, we do not want a tit-for-tat. While we need to be ready with countermeasures in case there is no other way out, I still believe that dialogue is what should prevail between important partners such as the EU and the U.S., including in bringing an end to this long-standing dispute. The EU remains open for discussions with the U.S., provided these are without preconditions and aim at a fair outcome."
US Retail Sales Expected to Bounce Back in March after Patchy Few Months
Less than a month after the last retail sales report, the US Census Bureau will publish its March release as it plays catchup following the delays caused by the government shutdown. The March retail sales numbers are scheduled for release on Thursday at 1230 GMT. After plunging unexpectedly in December and struggling since then, consumer spending is anticipated to have rebounded substantially in March.
Weaker household spending has been evident in most barometers of consumption since November/December, raising alarm bells about the US growth outlook. Softening consumption was one of the reasons that prompted the Federal Reserve to hit the pause button on further rate increases earlier this year. The March retail sales report could offer the first indication that consumption is recovering more sustainably after a failed rebound in January.
Retail sales are expected to have surged by 0.9% over the month in March after a surprise 0.2% drop in February. If the forecasts are met, this would make it the strongest gain since October 2018 before consumers began reining in their spending. Excluding auto and gasoline sales, retail sales are forecast to have increased by 0.7% month-on-month, more than undoing the prior month’s 0.4% fall. While the closely watched core measure, ‘the retail control group’, which excludes autos, gasoline, building materials and food services, is also expected to have returned to growth, rising by 0.4% m/m.
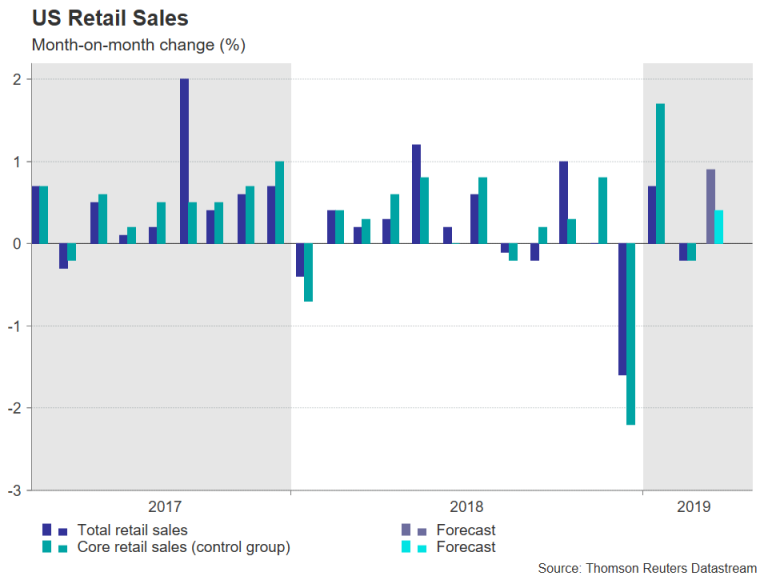
The retail control group sales are used in GDP calculations so a strong bounce back in March could see first quarter growth estimates being revised higher. The Atlanta Fed’s GDPNow estimate for Q1 has been steadily edging higher and currently stands at 2.3% annualized rate, slightly above Q4’s 2.2% figure. That suggests US growth has merely slowed to nearer trend levels rather than is heading towards a recession.
However, although the chances of a recession may be receding and probably were not that high to begin with, there are still significant downside risks that pose a danger to both US and world growth. Global trade remains fragile despite the positive headlines regarding the US-China trade talks. An agreement between the two trading partners is not a done deal, at least not yet, and the US is now extending its fight to Japan and the European Union. Other worries include Brexit and sluggish growth in the Eurozone.
On the bright side, even if the global uncertainties continue to weigh on exporters and business spending, the Fed’s recently adopted ‘patient’ stance should help avoid another slump in consumer spending like that seen in December. A tightening labour market, and in turn, faster wage growth, should support future spending. Personal consumption makes up about 70% of US economic output, so as long as households continue to spend, GDP growth should remain positive.
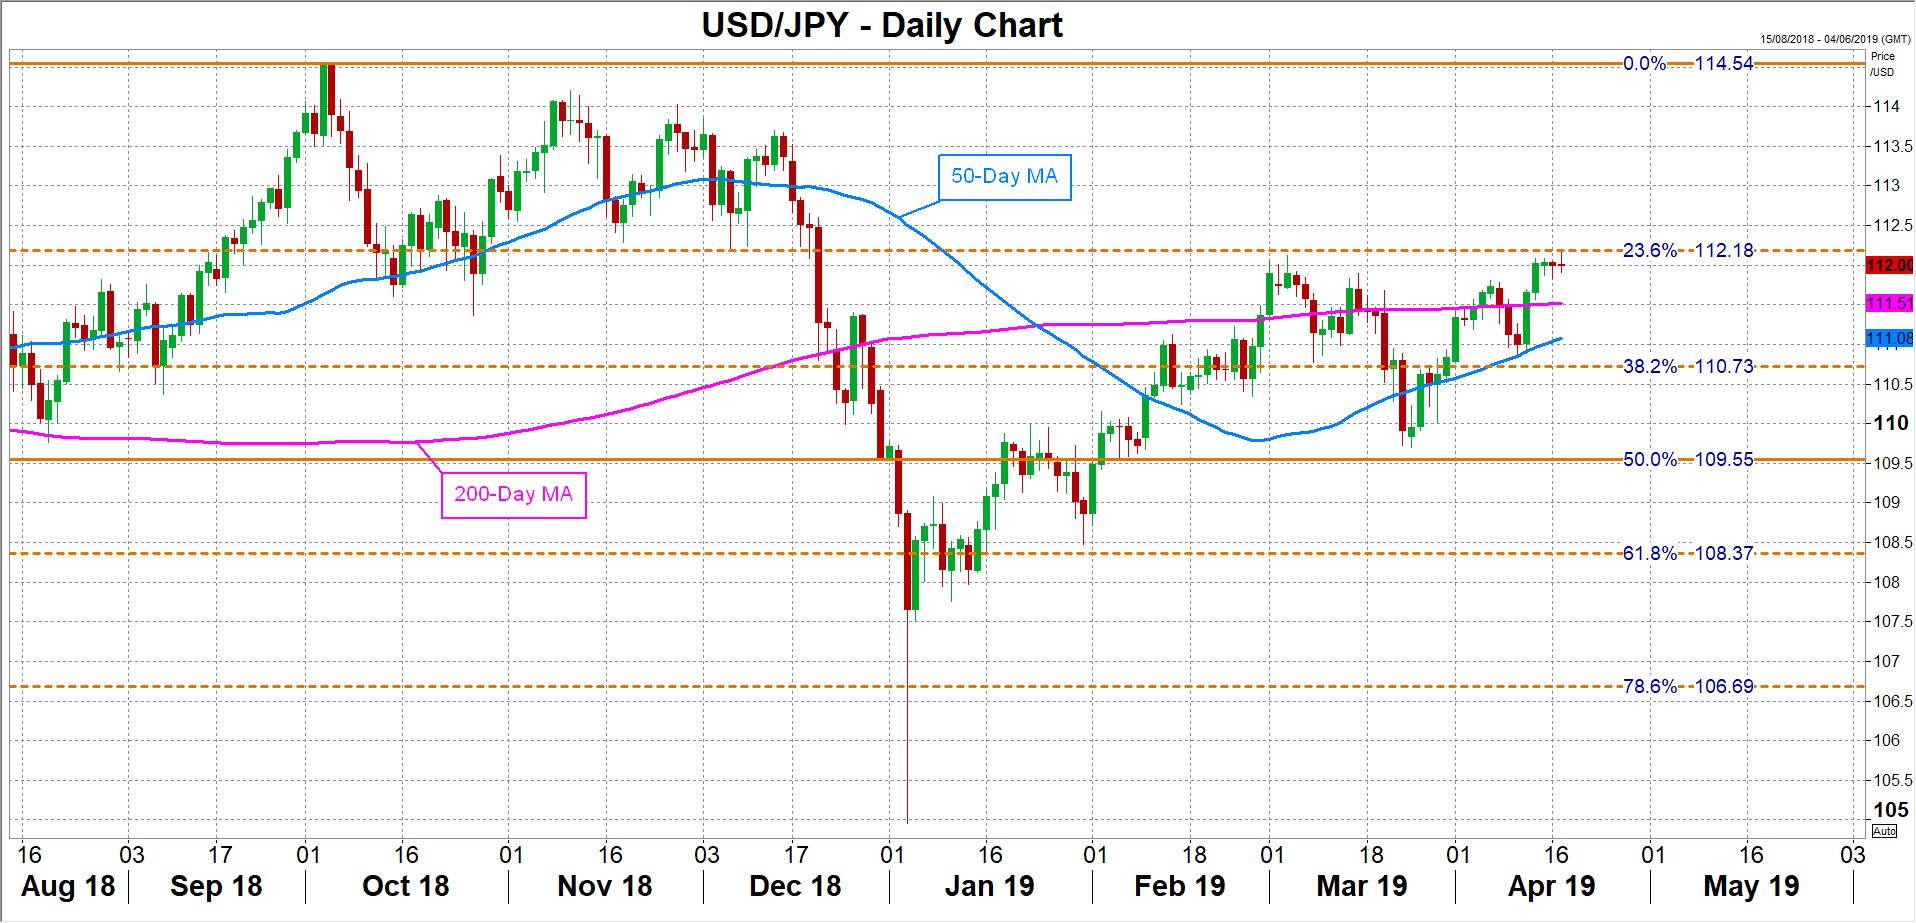
Looking at the possible reaction in forex markets, a positive surprise in the retail sales numbers could be the boost needed for dollar/yen to break above immediate resistance just above the 112 handle. There is strong resistance around 112.18, which is the 23.6% Fibonacci retracement of the 104.55 to 114.54 upleg. To the downside, unexpected weakness in the data could see the pair falling towards the 50-day moving average, which lies slightly above the 111 level.
Euro Area PMIs: Too Early for a Substantial Rebound?
The Eurozone’s preliminary PMIs for April are due on Thursday at 08:00 GMT and forecasts point to a rebound, albeit only a modest one. Make no mistake, these are the most important figures for the euro right now, and any substantial surprise will likely dictate the currency’s near-term direction. Alas, a major upside surprise seems somewhat unlikely for now.
After a long period of being largely ignored by the market, the Eurozone’s PMIs have returned with a vengeance in recent quarters, repeatedly triggering major reactions in the euro as traders started to focus on the growth outlook once again. The euro area economy has slowed drastically, and since the PMIs are released ahead of the ‘official’ data and are a reliable growth indicator, investors pay very close attention nowadays.
Not least because the European Central Bank (ECB) seems prepared to add even more stimulus if the economy deteriorates any further. At the latest policy meeting last week, ECB President Mario Draghi repeatedly emphasized that the central bank stands ready to “use all instruments” to support the economy, echoing his famous ‘whatever it takes’ speech from 2012.
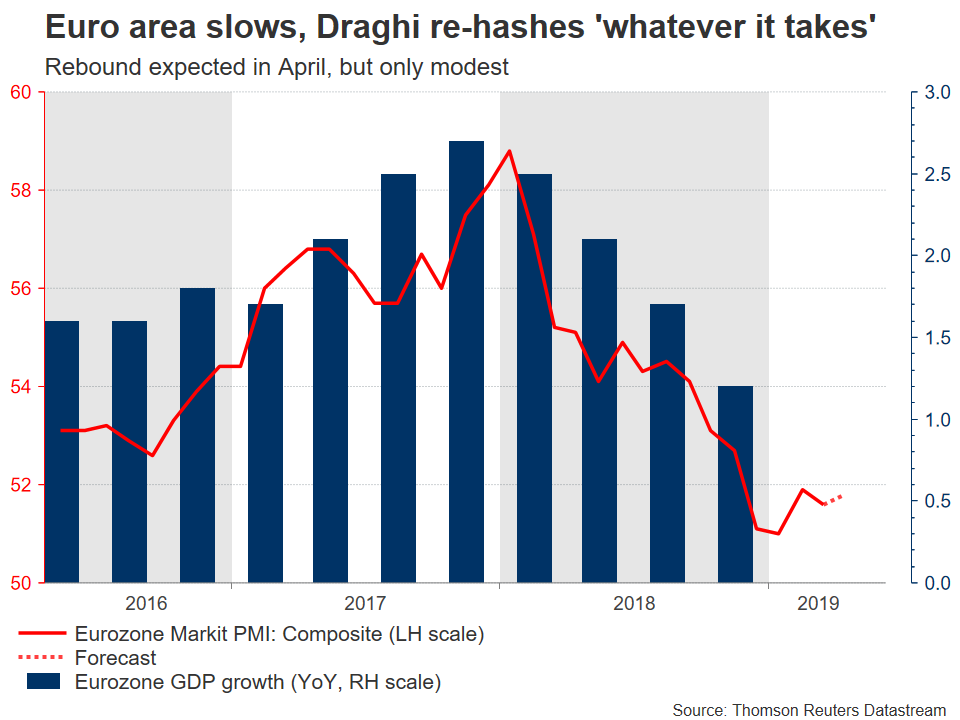
Yet, the bloc’s PMIs are expected to show some improvement in April. The manufacturing print is forecast to rise to 47.9, still below the 50 mark separating expansion from contraction, but notably better than the 47.5 in March. However, the services index is seen ticking down to 53.2 in April from 53.3 previously – perhaps in a signal that the manufacturing malaise has started to ‘infect’ the otherwise healthy service sector. As such, the composite figure that blends these two measures is projected to climb to 51.8, from 51.6 earlier.
Factors arguing for a positive surprise in the PMIs include the bigger-than-expected rise in the forward-looking component of the German ZEW survey for April, which highlighted that pessimism among investors is abating thanks to progress in the US-China trade talks and Brexit risks receding.
Arguing in the opposite direction are recent headlines that the US could slap tariffs on a list of EU products soon. While no decision will be made until the summer, the risk of an EU-US trade standoff is mounting. Separately, as Markit’s chief business economist noted in the March survey: “forward-looking indicators from the manufacturing sector suggest goods production will fall further in the coming months”. He was referring to a plunge in new orders, which implies that even if we do see a rebound in overall activity in April, it’s likely to be only modest – limiting the prospect of a major upside surprise.
The French and German PMIs will be released ahead of the euro area-wide data, at 07:00 GMT and 07:30 GMT respectively, and any market reaction could begin with them.
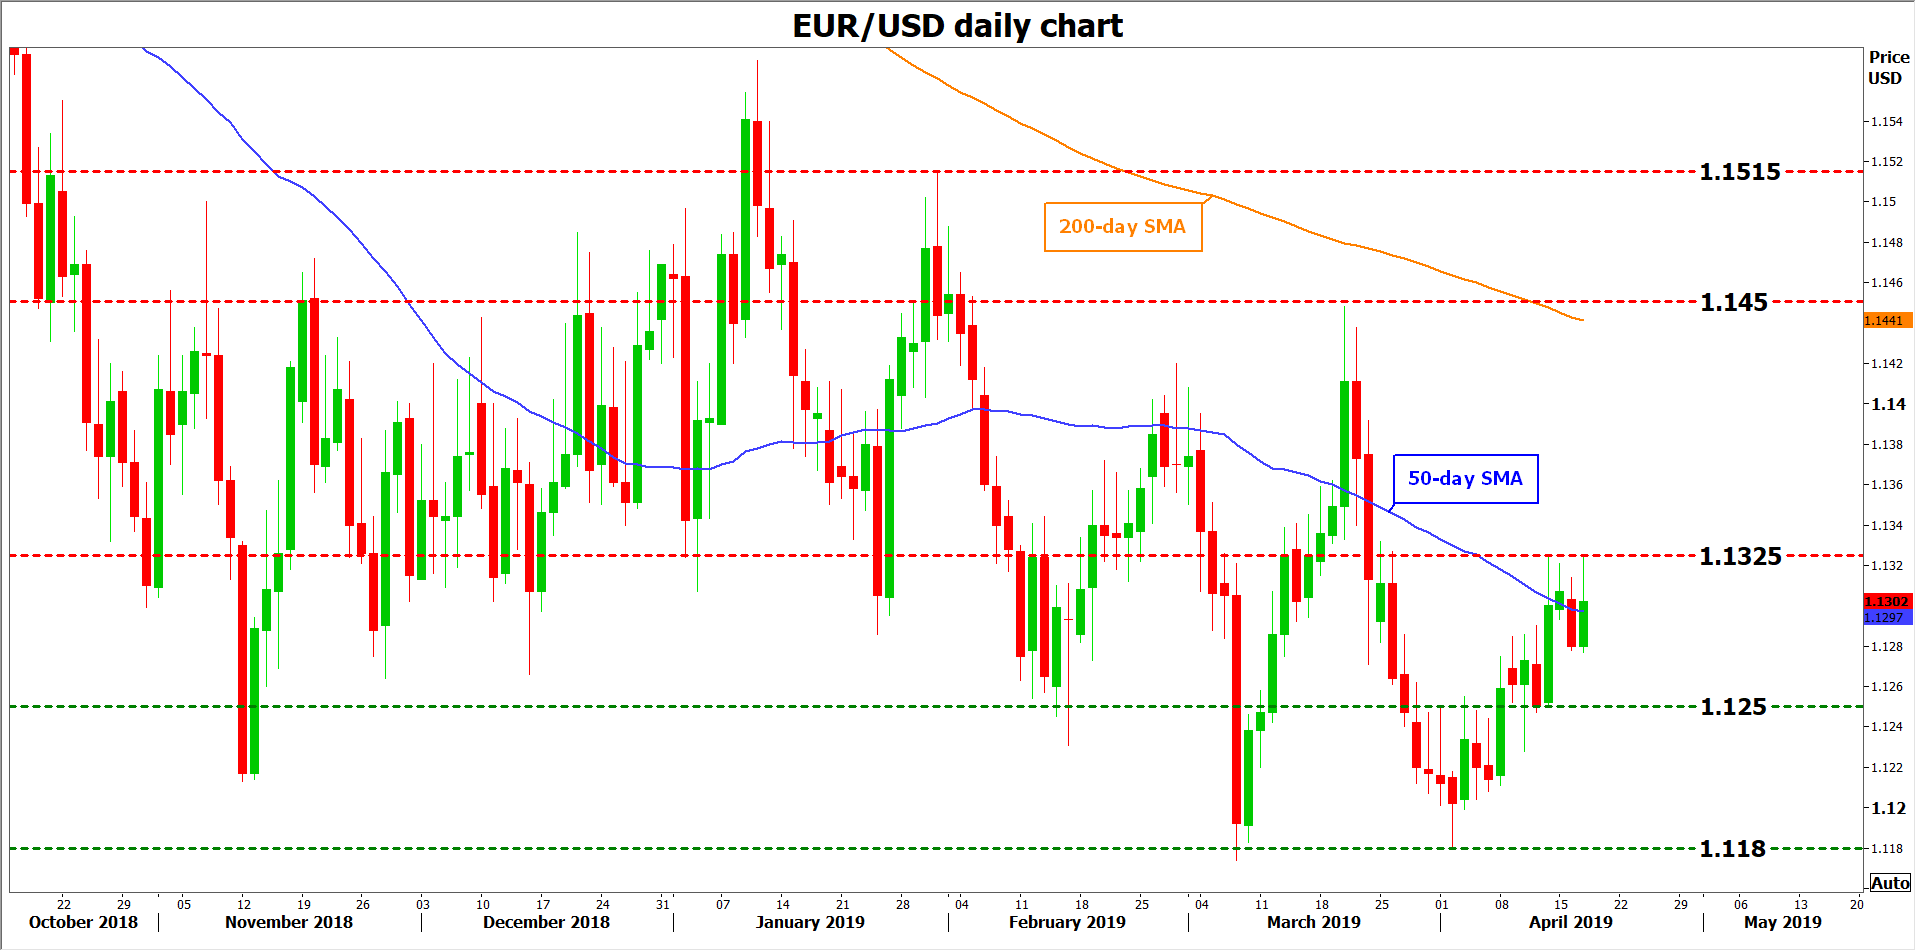
Technically, advances in euro/dollar may encounter immediate resistance near 1.1325, the April 12 high, with a bullish break opening the way for 1.1450.
On the downside, declines could stall around 1.1250, an area marked by the inside swings high in early April. A downside violation would turn the focus to the 1.1180 zone.