

Sample Category Title
XAU/USD Likely To Decline
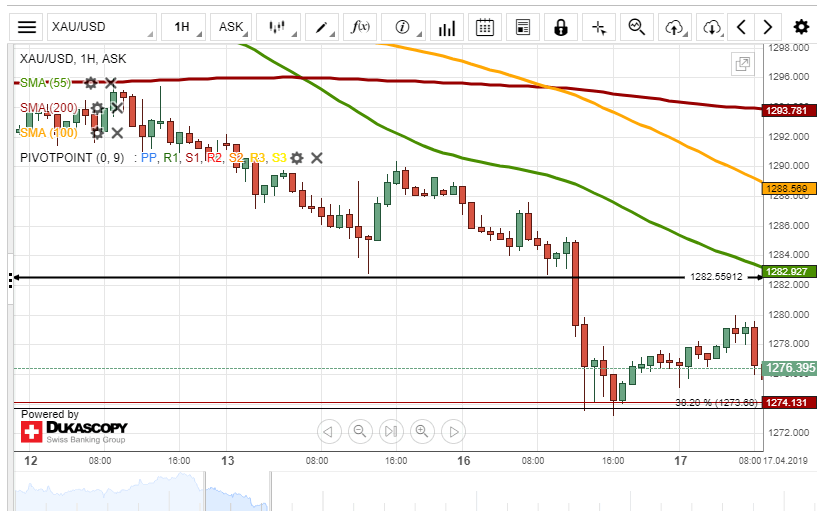
During Tuesday's trading session, the XAU/USD exchange rate breached the descending triangle pattern south and reached the support level formed by a combination of the monthly S1 and the Fibo 38.20% at 1,274.13.
If the given support level holds, it is likely that the price for the gold reverses north and tries to surpass the resistance cluster formed by the 55-, 100– and 200-hour SMAs in the 1,283.16/1,293.85 range.
Otherwise, it is expected, that the rate continues to trade down. In this case, the price for gold could reach the psychological level at 1,270.00.
The Analytical Overview Of The Main Currency Pairs
The EUR/USD currency pair
Technical indicators of the currency pair:
Prev Open: 1.13031
Open: 1.12812
% chg. over the last day: -0.21
Day's range: 1.12792 – 1.13138
52 wk range: 1.1214 – 1.2557
EUR/USD keeps consolidating. Yesterday the EUR was under pressure due to the comments by the ECB representatives. Some officials think that the current economic forecasts are too positive. Right now EUR has recovered the losses and found the new key trading range at 1.12800-1.13200. The financial market participants are waiting for important releases. You should open positions from the key levels.
The Economic News Feed for 17.04.2019:
Consumer Price Index (EU) – 12:00 (GMT+3:00);
Trading Balance (US) – 15:30 (GMT+3:00);
Federal Reserve's Beige Book (USD) – 21:00 (GMT+3:00);
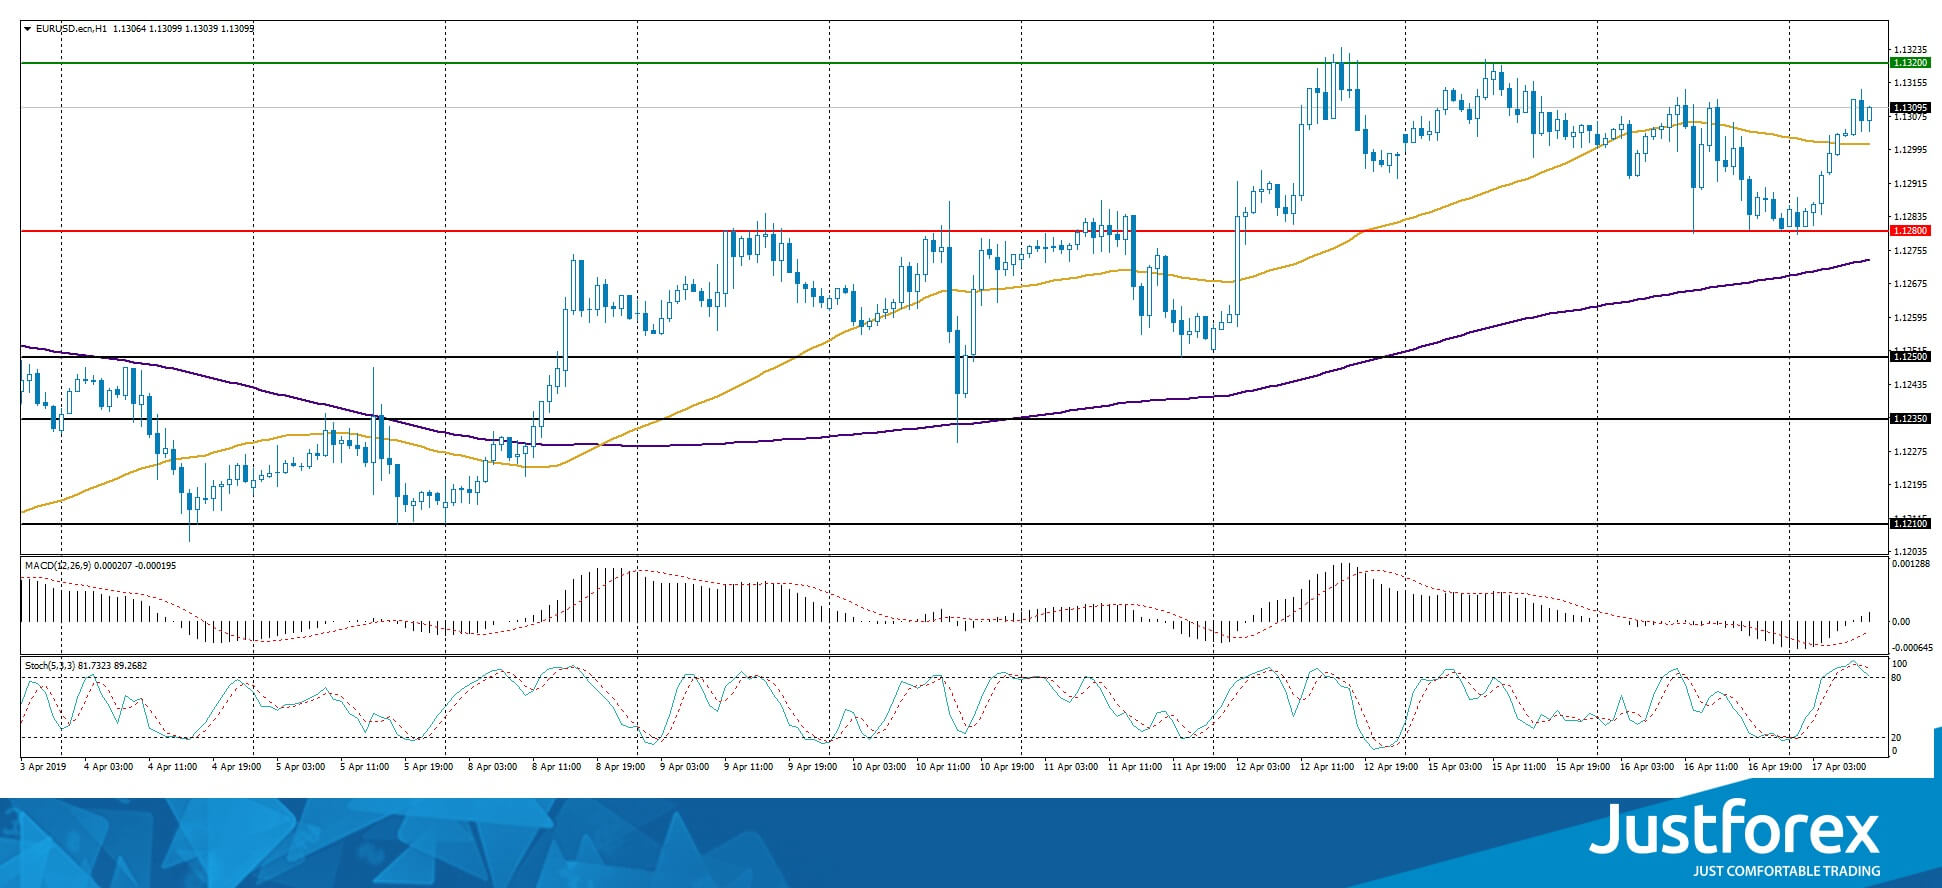
The price fixed above 50 MA and 200 MA which points to the power of the buyers.
The MACD histogram is in the positive zone, which gives a signal to buy EUR/USD.
The Stochastic Oscillator is near the overbought zone, the %K line is crossing the %D line. There are no signals at the moment.
Trading recommendations
Support levels: 1.12800, 1.12500, 1.12350
Resistance levels: 1.13200, 1.13500, 1.14000
If the price fixes above 1.13200, expect the quotes to grow toward 1.13500-1.13800.
Alternatively, the EUR/USD can fall toward 1.12600-1.12400.
The GBP/USD currency pair
Technical indicators of the currency pair:
Prev Open: 1.30883
Open: 1.30883
% chg. over the last day: -0.42
Day's range: 1.30324 – 1.30674
52 wk range: 1.2438 – 1.4378
GBP/USD ignored an optimistic Labour Market report and closed in the red. GBP is under pressure due to The Guardian's report on Theresa May's and Labour Party negotiations that had supposedly hit a dead end. Right now the quotes are at 1.30350-1.30700 range. The investors are waiting for the inflation report. You should open positions from the key levels.
At 11:30 (GMT+3:00) the UK will publish a consumer price index.
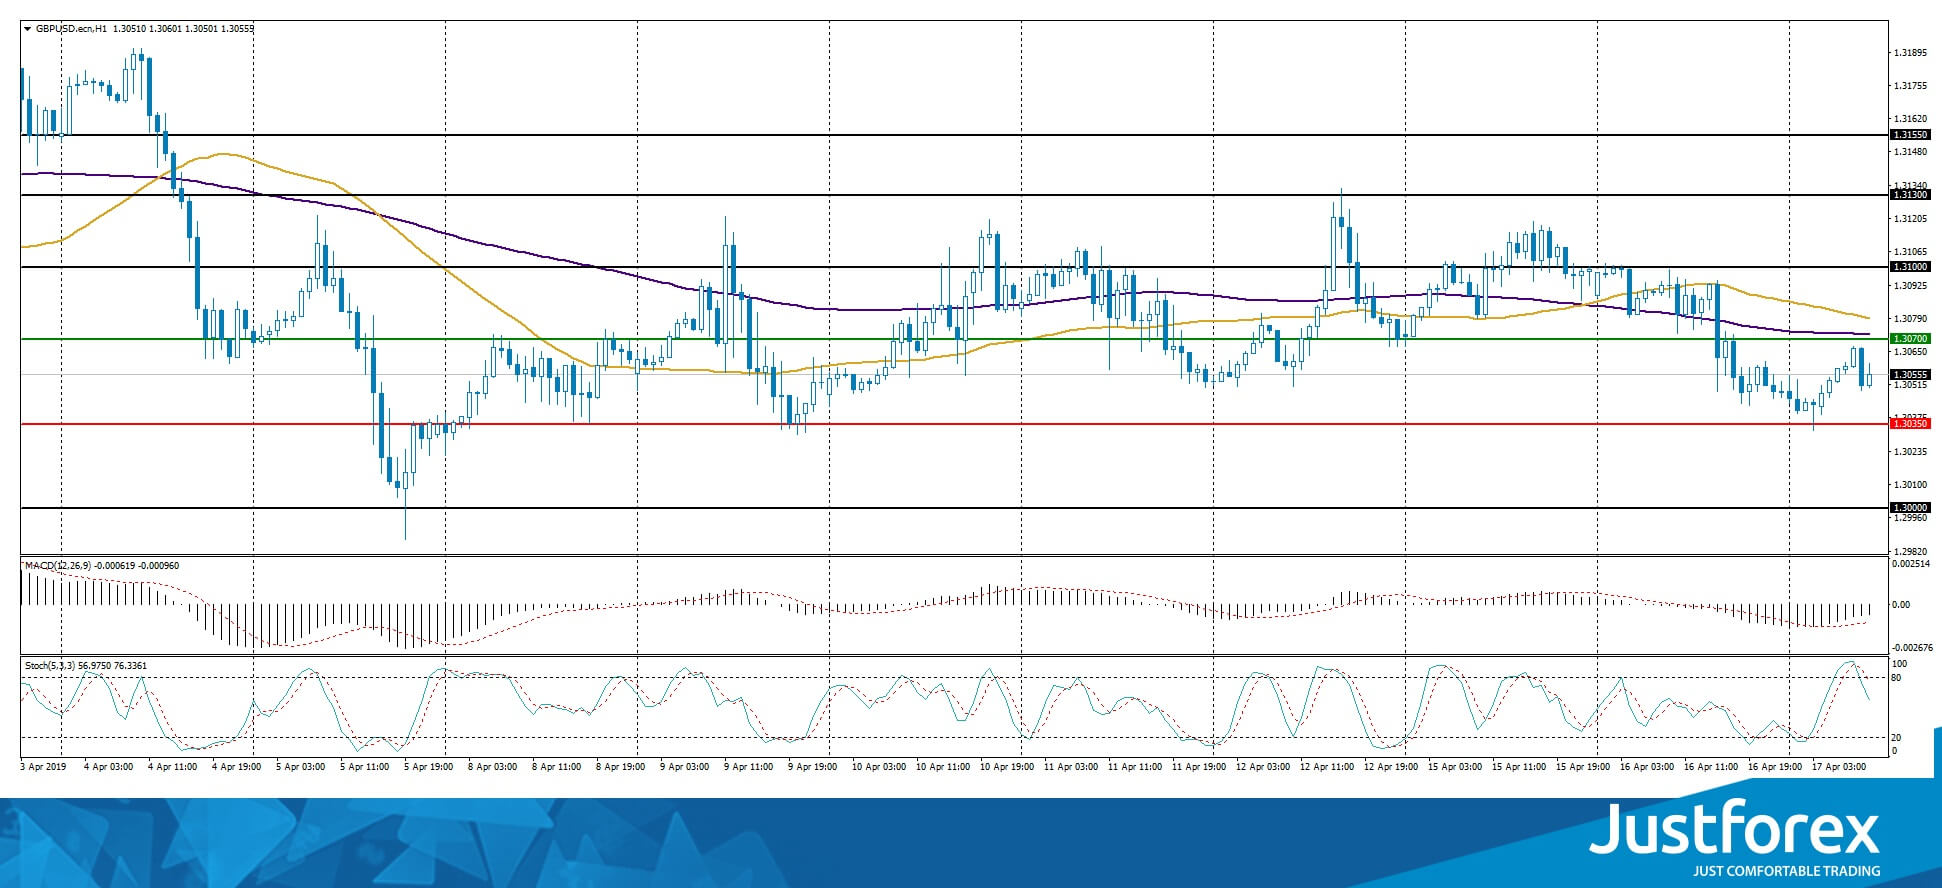
The indicators do not provide precise signals, 50 MA started to cross 200 MA.
The MACD histogram is in the negative zone but above the signal line which gives a weak signal to buy GBP/USD.
The Stochastic Oscillator started to leave the overbought zone, the %K line is below the %D line which points to the bearish mood.
Trading recommendations
Support levels: 1.30350, 1.30000
Resistance levels: 1.30700, 1.31000, 1.31300
If the price fixes below 1.30350, expect further descend towards 1.30000.
Alternatively, the quotes can recover toward 1.31000-1.31200.
The USD/CAD currency pair
Technical indicators of the currency pair:
Prev Open: 1.33662
Open: 1.33492
% chg. over the last day: -0.05
Day's range: 1.33189 – 1.33725
52 wk range: 1.2248 – 1.3664
USD/CAD started to descend again and updated the local minimums. The prices on oil keep showing a positive trend, which supports CAD. Right now quotes are at the 1.33150 support level with 1.33500 acting as a mirror resistance. The investors expect important economic reports today. You should open positions from the key levels.
The Economic News Feed for 17.04.2019:
Basis Consumer Price Index (CAD) – 15:30 (GMT+3:00);
Trading Balance (CAD) – 15:30 (GMT+3:00);
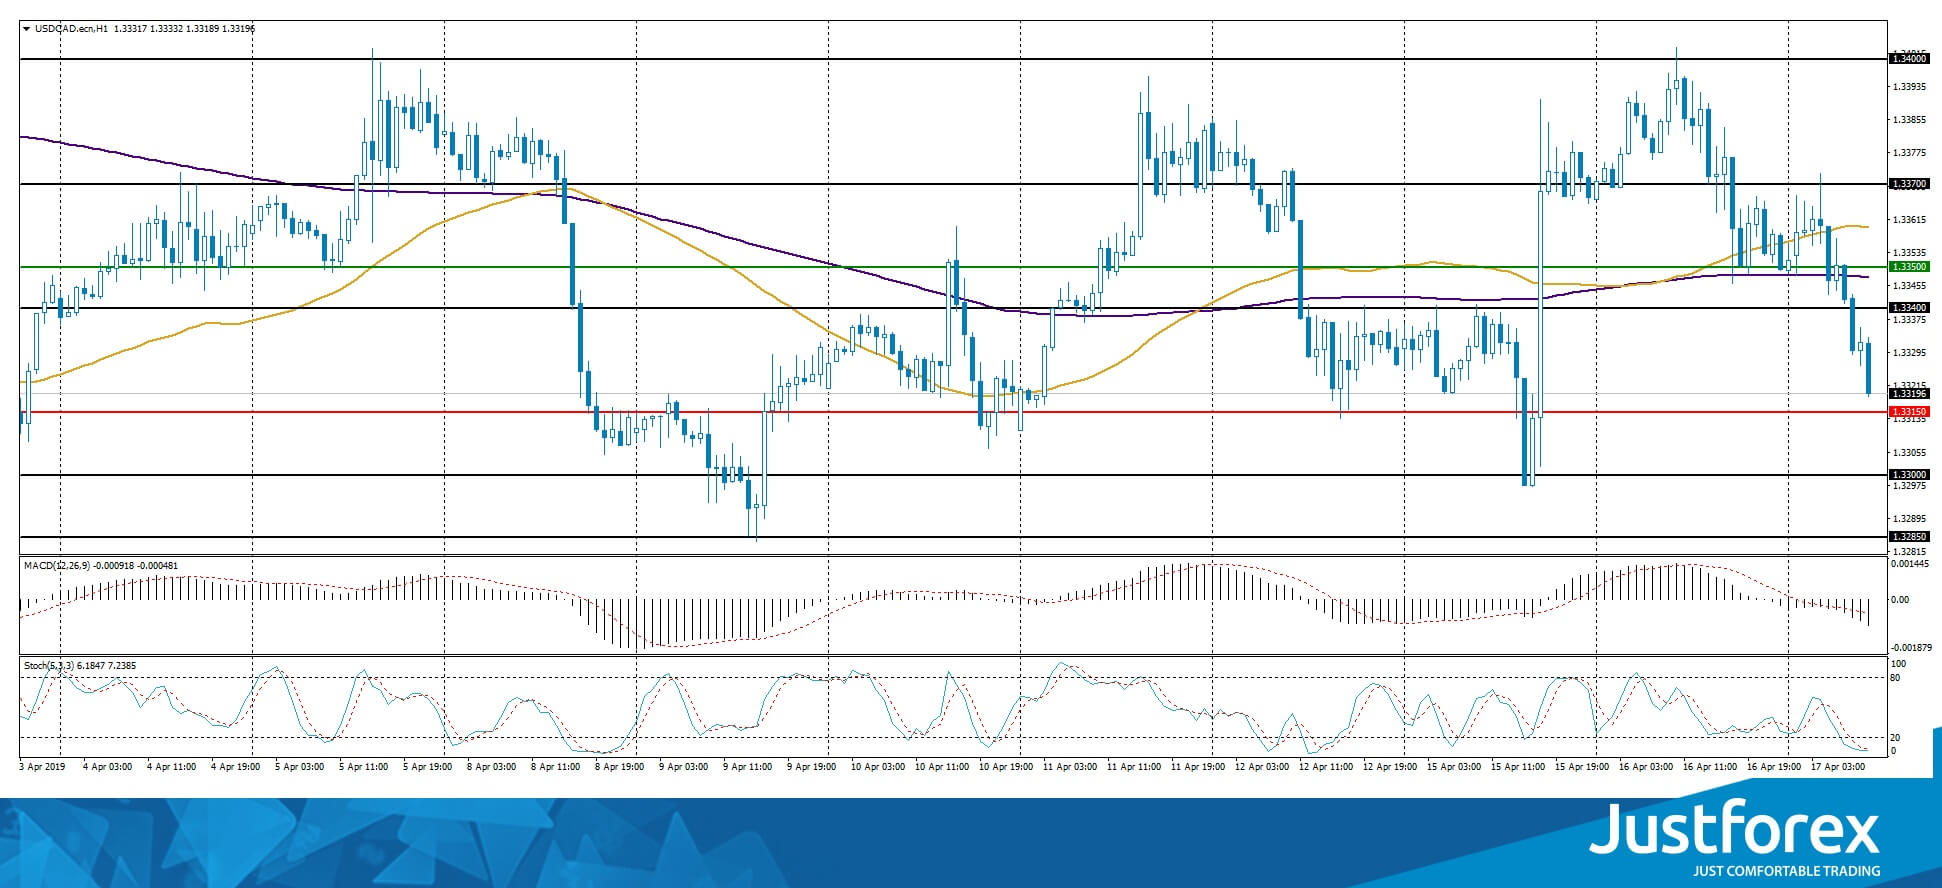
The price fixed below 50 MA and 200 MA which points to the power of the buyers.
The MACD histogram is in the negatie zone and keeps falling which points to a bearish mood.
The Stochastic Oscillator is in the oversold zone, the %K line is crossing the %D line. There are no signals at the moment.
Trading recommendations
Support levels: 1.33150, 1.33000, 1.32850
Resistance levels: 1.33500, 1.33700
If the price fixes below 1.33150, expect further descend toward 1.32850-1.32700.
Alternatively, the quotes can grow toward 1.33600-1.33800.
The USD/JPY currency pair
Technical indicators of the currency pair:
Prev Open: 112.019
Open: 111.995
% chg. over the last day: -0.03
Day's range: 111.922 – 112.165
52 wk range: 104.56 – 114.56
USD/JPY keeps trading in a flat. There is no defined trend. The investors are waiting for important reports. Right now the key support and resistance levels are 111.800 and 112.150. You should keep an eye on the US Tresury bonds yield's dynamic and open positions from the key levels.
During the Asian trading session, Japan published a positive trading balance report.
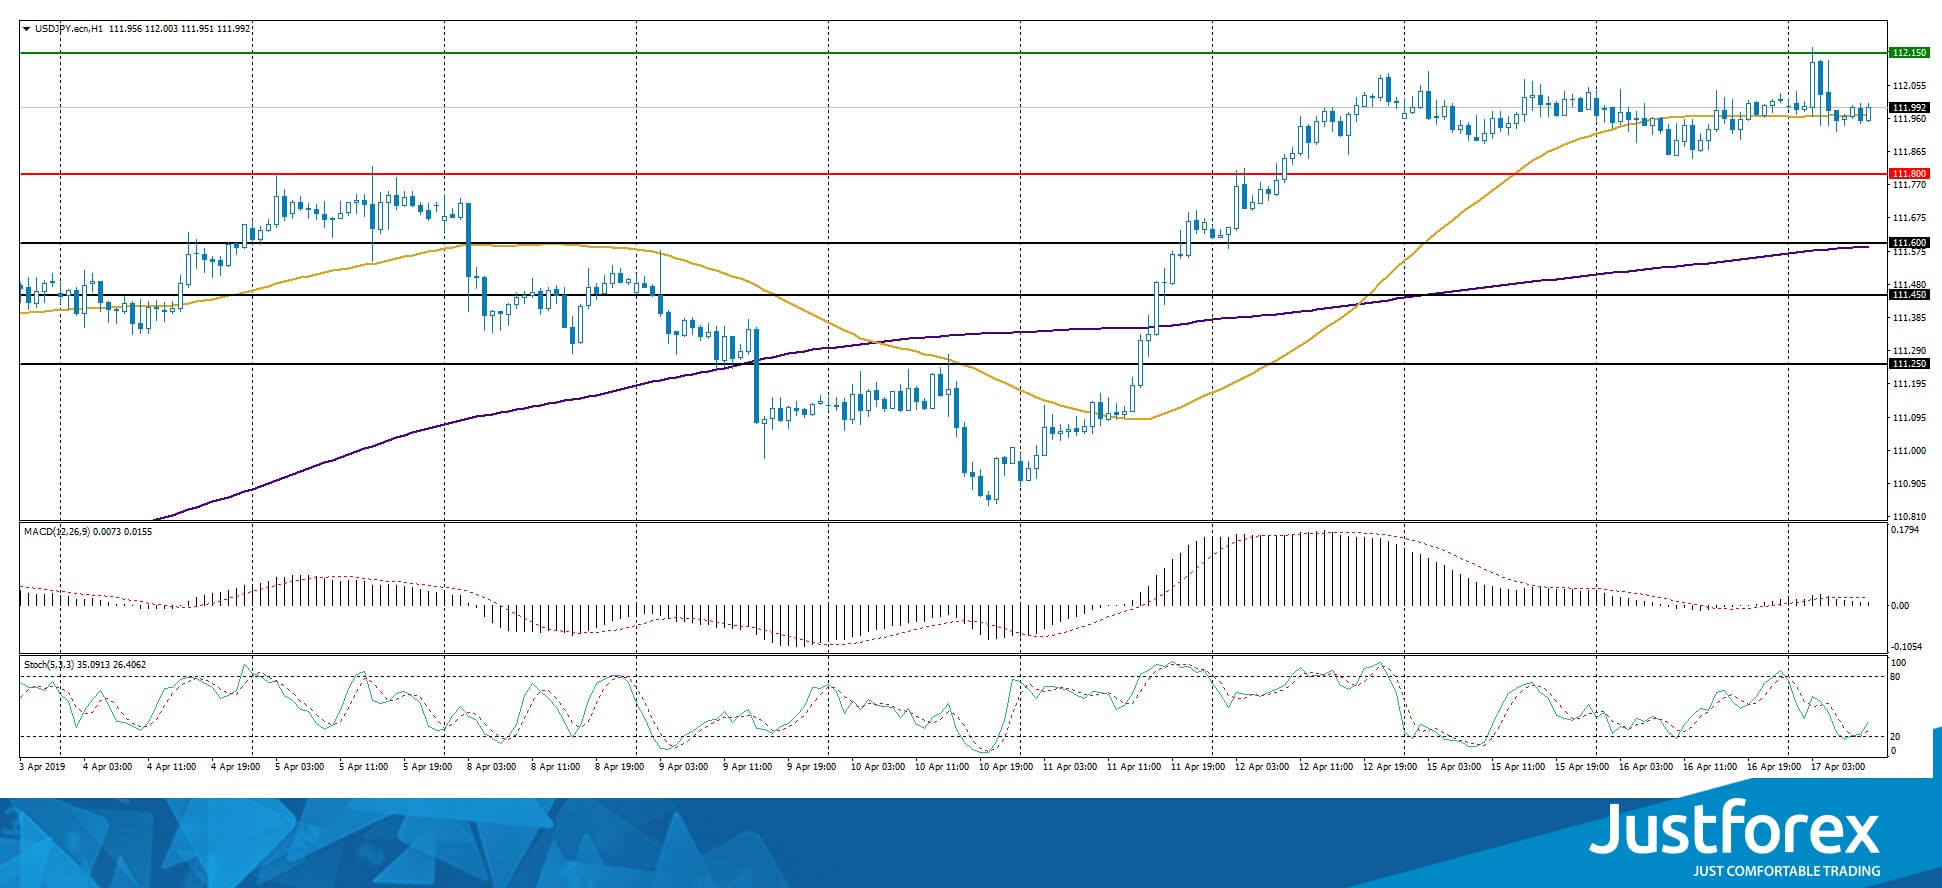
The indicators do not provide precise signals, the price has crossed 50 MA.
The MACD histogram is close to 0.
The Stochastic Oscillator is close to the oversold zone, the %K line is above the %D line which points towards buying USD/JPY.
Trading recommendations
Support levels: 111.800, 111.600, 111.450
Resistance levels: 112.150, 112.500, 112.750
If the price fixes above 112.150, expect further growth toward 112.500-112.700.
Alternatively, the quotes can correct toward 111.600-111.450.
Greenback Is Stable Against The Basket Of World Currencies. Investors Expect Important Economic Statistics
Yesterday, the US dollar slightly strengthened against a basket of major currencies. The dollar index (#DX) closed the trading session in the positive zone (+0.17%). The euro was under pressure after statements by the ECB representatives. Some politicians believe that the current economic forecasts of the Central Bank are too optimistic. At the moment, financial market participants have taken a wait-and-see attitude before the publication of important economic releases. The Fed's Beige Book, which will help investors to assess the state of the economic situation in each of the 12 federal districts of the United States, will be published today. We also expect data on the US trade balance.
The British pound ignored fairly positive statistics on the UK labor market. Thus, average earnings including bonuses increased by 3.5% in February, as experts expected. The unemployment rate remained unchanged at 3.9%. The number of new jobs increased by 179.0K, which is higher than the forecasted value of 173.0K. At the same time, jobless claims counted to 28.3K in March instead of the expected value of 20.0K. The British pound was under pressure after the Guardian reported that negotiations between Theresa May and the opposition Labour Party regarding Brexit came to the deadlock. The Labour Party denied this information.
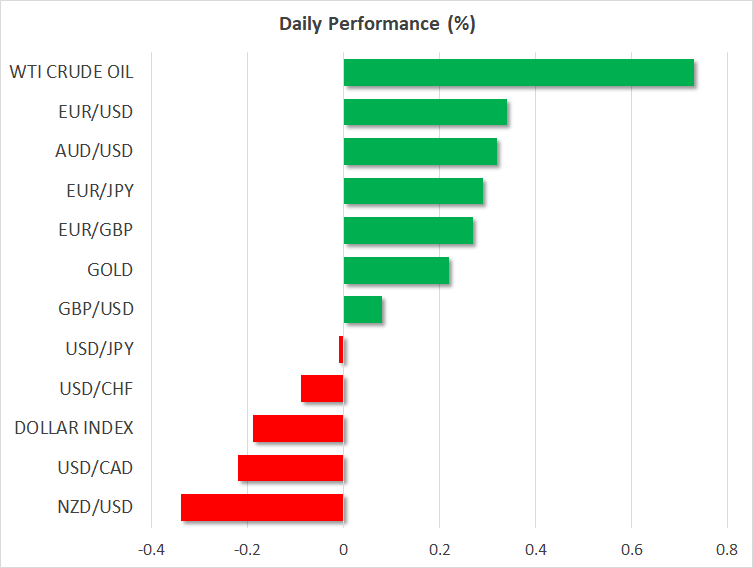
Today, during the Asian trading session, weak economic data from New Zealand have been published. Thus, the consumer price index (q/q) rose by only 0.1% in the first quarter, while experts expected growth by 0.3%. Optimistic data were also published in China. GDP (y/y) grew by 6.4% in the first quarter instead of 6.3%. Industrial production also increased by 8.5% in March, although experts forecasted growth by 5.6%. Today, we expect important economic statistics from the UK, the Eurozone and Canada.
The "black gold" prices have been growing again and reached annual highs. At the moment, futures for the WTI crude oil are testing the mark of $64.50 per barrel. At 17:30 (GMT+3:00), a report on crude oil inventories will be published in the US.
Market Indicators
- Yesterday, the bullish sentiment was observed in the US stock market: #SPY (+0.07%), #DIA (+0.27%), #QQQ (+0.34%).
- The 10-year US government bonds yield has been growing. Currently, the figure is at the level of 2.59-2.61%.
The news feed for 2019.04.17:
- Consumer price index in the UK at 11:30 (GMT+3:00);
- Data on inflation in the Eurozone at 12:00 (GMT+3:00);
- Data on inflation in Canada at 15:30 (GMT+3:00);
- Fed's "Beige Book" at 21:00 (GMT+3:00).
AUD Strengthens On Improved Chinese Data
The AUD strengthened during today’s Asian session as a number of Chinese data came out better than expected. Starting with the GDP growth rate for Q1 which seems to be stabilising at +6.4% yoy, while it was projected to slowdown and the industrial output which accelerated substantially reaching +8.5% yoy, could be interpreted as signals of stabilization for the Chinese economy. China’s National Bureau of statistics commented that consumption is the main driving force behind the improvement, however at the same time noted that many external uncertainties exist as global growth slows down. Please note that the NZD marked a similar reaction as the AUD, despite the bearish hit after the release of a slowing CPI rate for Q1. Overall, the picture of the Chinese economy seems to be bottoming out and should the US-Sino negotiations bear fruit any time soon, we may see it picking up pace once again. Also it should be mentioned that tomorrow’s release of the Australian employment data for March are expected to affect the Aussies direction as the RBA is placing substantial weight on unemployment recently. AUD/USD rose during today’s Asian session, temporarily breaking the 0.7190 (R1) resistance line. We could see the pair having some bullish tendencies during today’s session, yet we expect the release of the Australian employment data, tomorrow during the Asian session, to affect the pair’s direction. Should the pair find fresh buying orders along its path, we could see it breaking the 0.7190 (R1) resistance line and aim for the 0.7245 (R2) resistance hurdle. On the flip side, should the pair come under the selling interest of the market, we could see it breaking the 0.7120 (S1) support line and aim for the 0.7065 (S2) support barrier.
EUR weakens on dovish comments by ECB members
The common currency weakened against the USD during the European session yesterday however recovered some of its losses later. The drop seems to have been caused by dovish comments made by a number of ECB’s policymakers characterized as a “significant minority” in a Reuters report. The report stated that ECB policy makers consider the bank’s economic forecasts as too optimistic and that the possibility of a growth recovery for the area in the second half of 2019 is doubtful. We could consider the EUR’s reaction as another sign of sensitivity for the common currency and definitely a dovish take, despite the EUR later rebounding. We expect the release of the April preliminary PMI’s of the area on Thursday, to be closely watched as it could provide further signals about growth. EUR/USD weakened during the European session yesterday breaking the 1.1300 (S1) support line, however corrected during today’s Asian session regaining most of its losses and breaking just above the prementioned support line. Should the bulls dictate the pair’s direction, we could see it breaking the 1.1340 (R1) resistance line. On the other hand should the bears take over once again, we could see it breaking the 1.1300 (S1) support line and aim if not break the 1.1260 (S2) support level.
Other economic highlights, today and early tomorrow
In today’s European session, we get UK’s inflation rates for March and Eurozone’s final reading of the CPI rate for March. In the American session, we get Canada’s inflation rates for March and from the US the EIA weekly crude oil inventories figure. As for speakers, please note that BoE’s Governor Mar Carney, ECB’s Sabine Lautenschlager, Philadelphia Fed President Patrick Harker and St. Louis Fed President James Bullard. Also please note that the Fed’s Beige Book is to be released later during the American session.
EUR/USD H4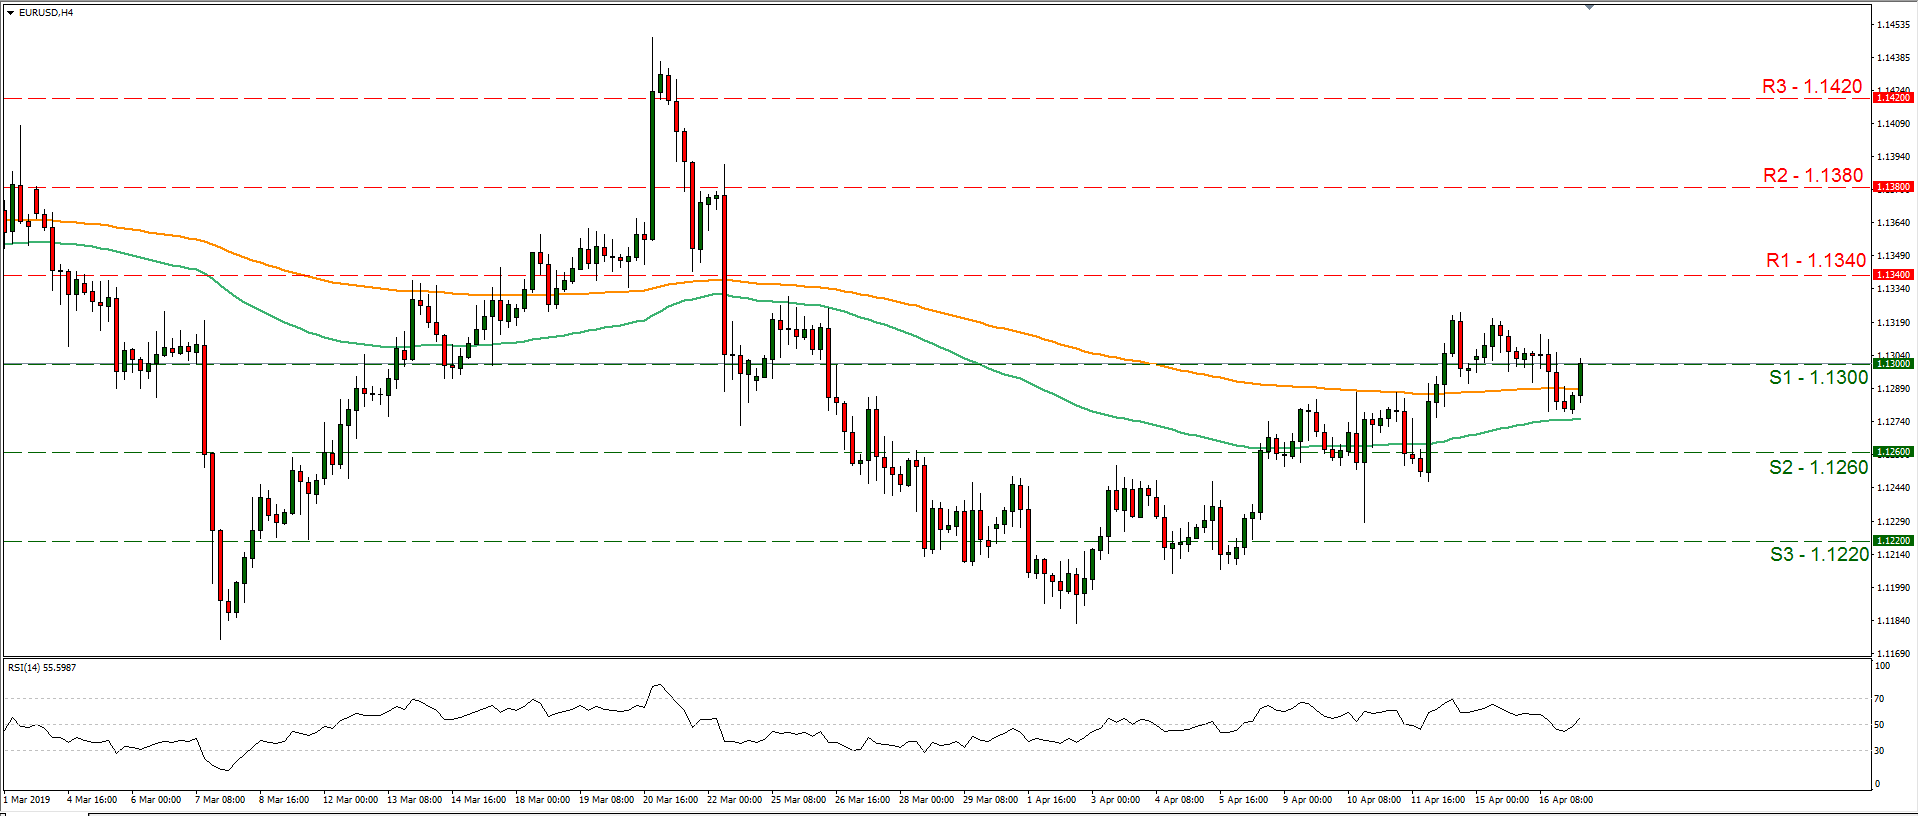
Support: 1.1300 (S1), 1.1260 (S2), 1.1220 (S3)
Resistance: 1.1340 (R1), 1.1380 (R2), 1.1420 (R3)
AUD/USD H4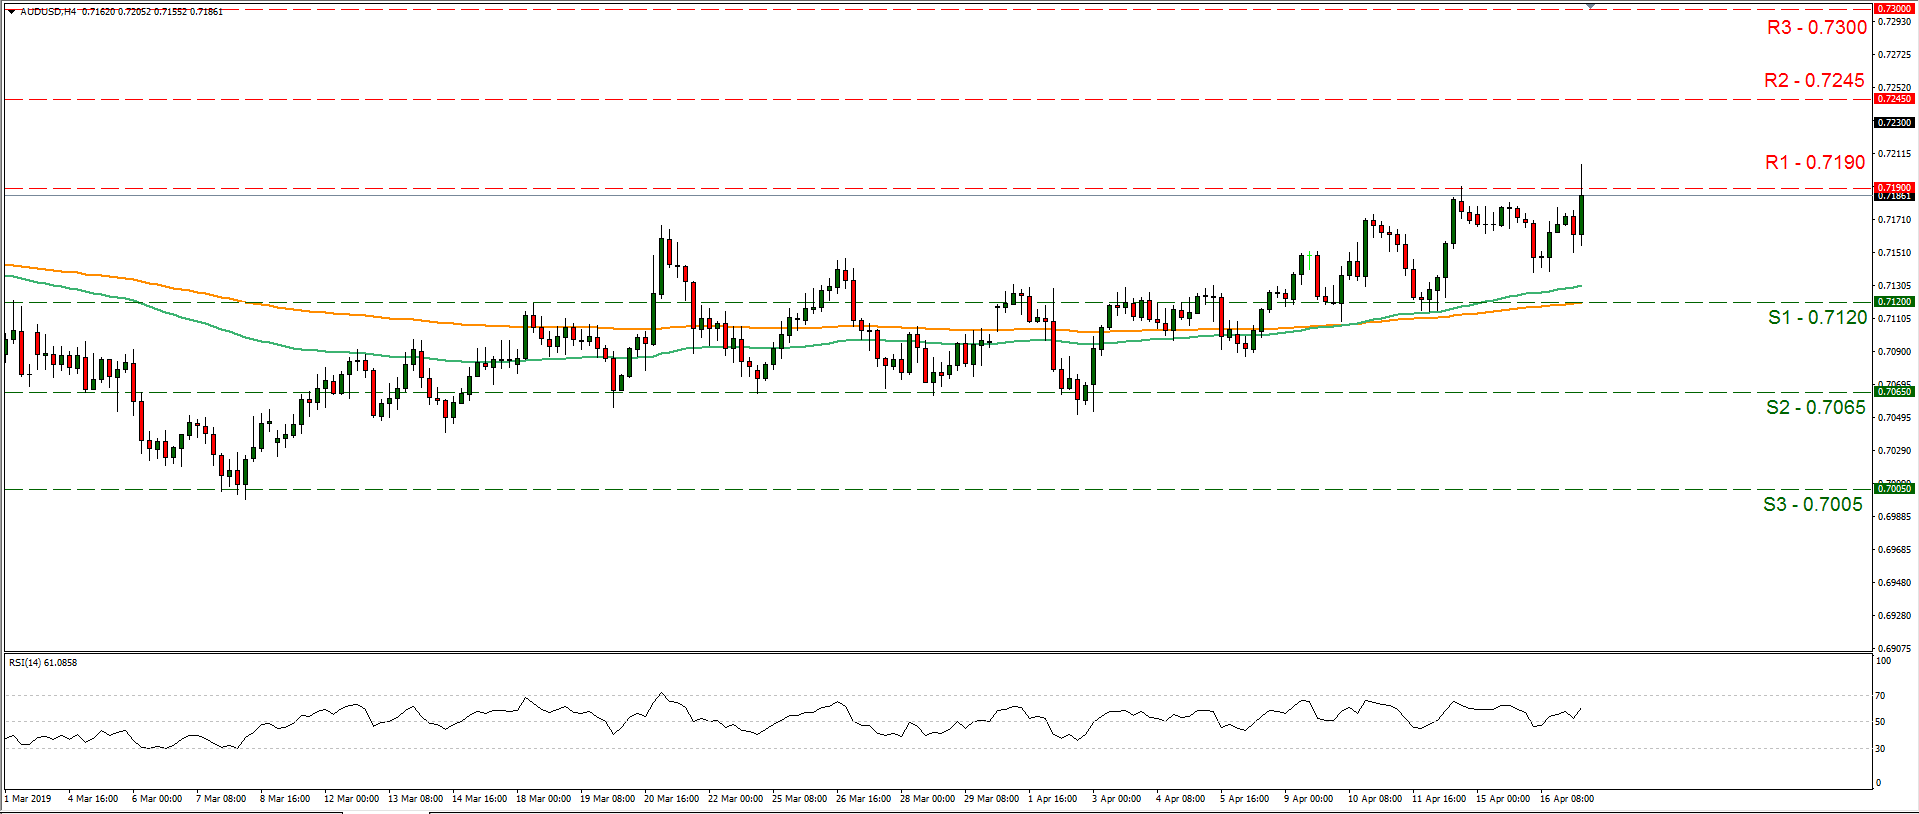
Support: 0.7120 (S1), 0.7065 (S2), 0.7005 (S3)
Resistance: 0.7190 (R1), 0.7245 (R2), 0.7300 (R3)
EURJPY Soars Near 1-Month Peak, More Gains Expected
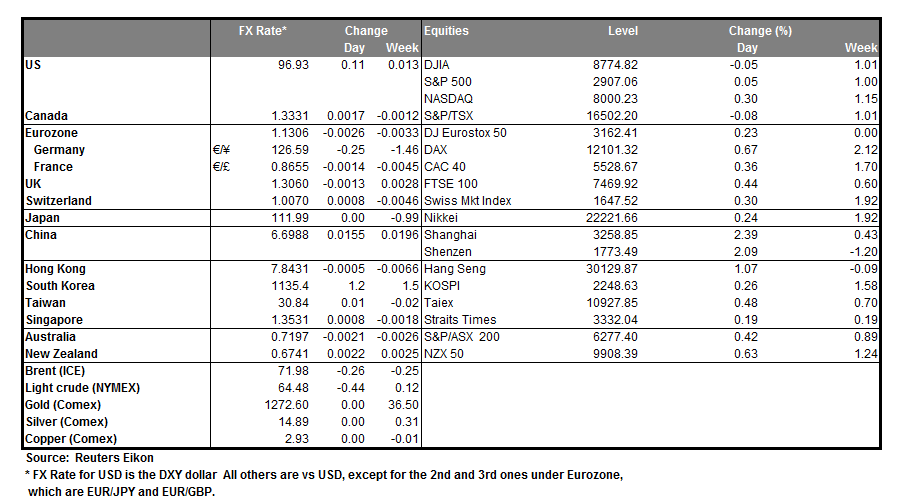
EURJPY is heading sharply higher over the last 4-hour session, approaching the one-month high of 126.80, first reached on April 15. The successful climb above the 20-simple moving average (SMA) and the red Tenkan-sen line give the opportunity to traders to think about potential bullish actions in the near term. The RSI is ready to touch the overbought level, while the MACD is on the way to surpass its trigger line.
A close above 126.80 would boost bullish sentiment, shifting attention straight up to two-and half-month high of 127.50, identified on March 1. An aggressive rally above the latter could increase buying orders significantly, with resistance coming next from the 128.40 barrier, registered on December 2018.
In the alternative scenario, a fall below 126.15 and the 23.6% Fibonacci retracement level of the upward move from 123.65 to 126.80 could add more pressure to the market, while a decline below the 38.2% Fibonacci of 125.60 would put the uptrend off 123.65 into question. Traders may also increase their selling positions under 125.00.
In the medium-term timeframe, a strong run above the 127.50 hurdle would put the market back into the bullish mode, while a drop below 123.65 would confirm the start of a bearish phase.
Aussie Jumps On China GDP Boost But Limited Gains For Stocks
- Fears of a global slowdown ease substantially after China posts stronger-than-expected GDP data for the first quarter
- The data lifts risk-assets with the Australian dollar being the main beneficiary
- But broader gains are limited amid caution about the outlook
China GDP beats expectations, industrial output surges
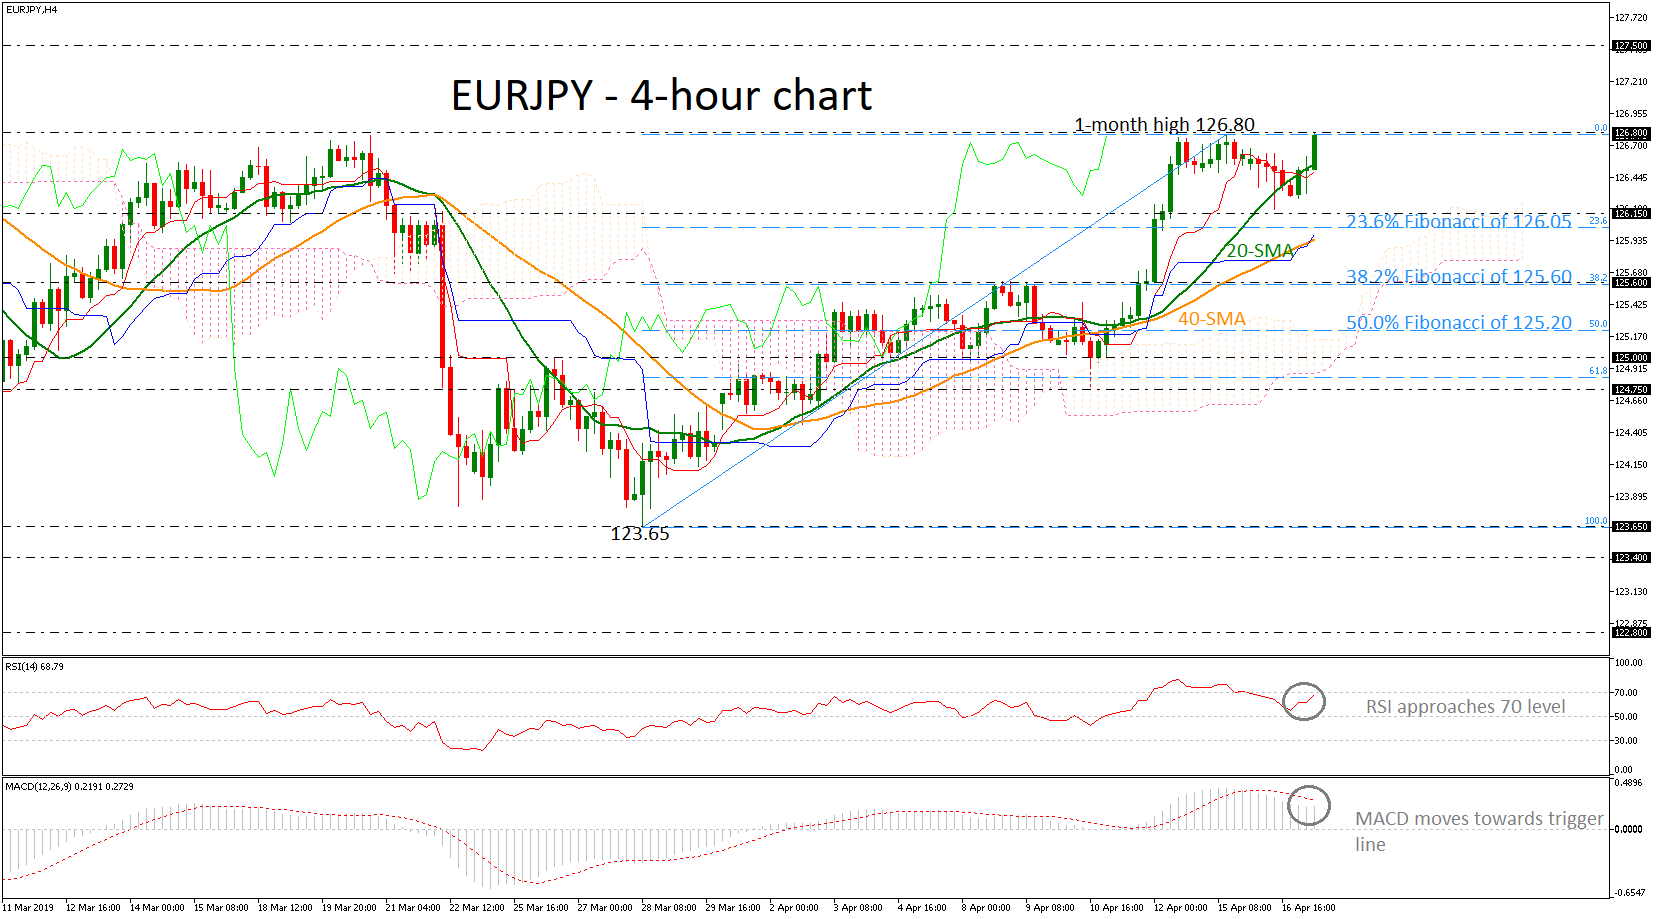
Markets cheered upbeat economic figures out of China on Wednesday, continuing the series of positive numbers out of the country over the past couple of weeks. China’s economy expanded by 6.4% year-on-year in the first three months of the year, defying forecasts of a slowdown to 6.3%. But more encouragingly, March data for industrial output and retail sales beat expectations with a wide margin, pointing to a possible rebound in growth. Industrial output rose at the fastest annual pace in four and a half years, growing by 8.5% in March.
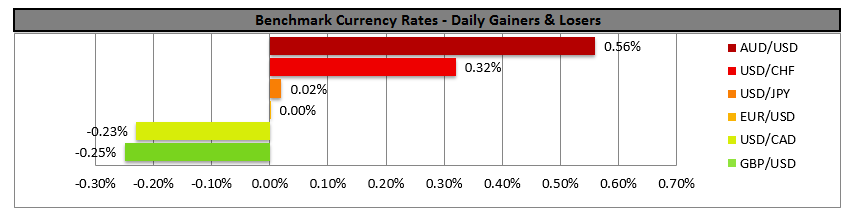
The data lifted the Australian dollar, which hit a 2-month high of $0.7205, while the yen slipped to a 4-month low of 112.16 versus the US dollar. Only yesterday the aussie had fallen sharply from the minutes of the RBA’s April policy meeting, which hinted at rate cuts. An improving economic picture in Australia’s major trading partner could see market expectations of an RBA rate cut diminish, suggesting more upside for the aussie.
The Australian currency will likely remain in focus over the next 24 hours as Australia will publish its employment report for March. The RBA has signalled rate cuts are dependent on a worsening labour market so a strong report would further dash expectations of an easing in policy.
Muted gains for equities
The positive sentiment also supported equities, though shares in Asia pared earlier gains as some investors were cautious about upgrading their views on the global growth outlook just yet. China’s blue-chip CSI 300 index was last trading flat on the day, but Japan’s Nikkei 225 index managed to rise to 4-month highs.
Equity futures for European and US indices were pointing to a mixed start for Wednesday. But the general market mood has been on the up in April and the Chinese data, together with a mostly positive earnings season so far in the US are leading investors to abandon some of their worst-case scenarios for the world economy.
Kiwi slumps on weak inflation readings
The New Zealand dollar bucked the trend on Wednesday, falling sharply against its peers following weaker-than-expected inflation numbers out of New Zealand. The annual rate of CPI increased by 1.5% in the first quarter against expectations of a 1.7% rise. The decline in the inflation rate towards the lower end of the Reserve Bank of New Zealand’s 1-3% target band increases the likelihood of a rate cut by the central bank in the coming months.
The kiwi hit a 3½-month low of $0.6667 before rebounding to around $0.6740 on the back of the Chinese numbers.
Euro and pound edge up ahead of key releases
The euro was also boosted from the China data, recovering back above the $1.13 level, only to hit resistance around $1.1325. The single currency came under pressure yesterday on reports that some ECB policymakers think the bank’s latest economic projections are too optimistic. However, apart from a potential turnaround in China, some recent Eurozone data has also been surprising on the upside. The next major clue on the Eurozone economy will come from the April flash PMIs on Thursday.
The pound was marginally higher at $1.3053, finding support from yesterday’s solid jobs figures. March inflation numbers, due later today, will be viewed next in the UK. However, any gains from more positive data will likely be modest amid doubts about the prospect of a deal between the Conservatives and the Labour party to reach a consensus on the current Brexit impasse.
Canada will also publish its inflation report for March later today. The Canadian dollar is up for a second day against its US counterpart with the help of a rebound in oil prices. But the loonie has been struggling to make significant advances against the greenback as the Bank of Canada has turned more dovish.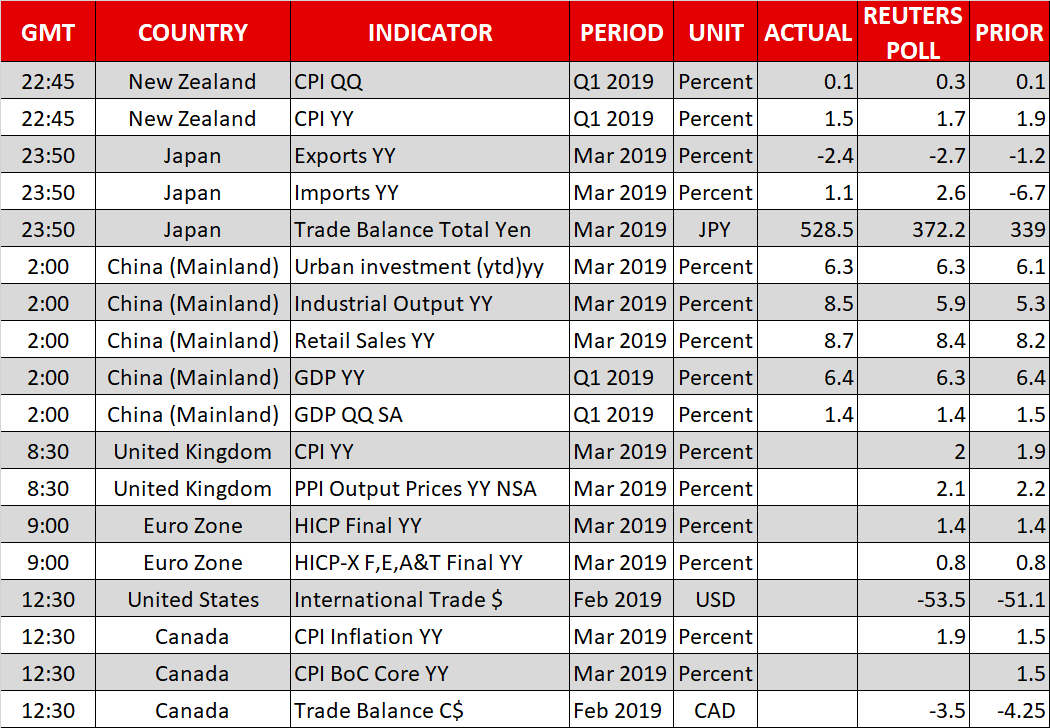
AUD/JPY Buying Into Dip Continues
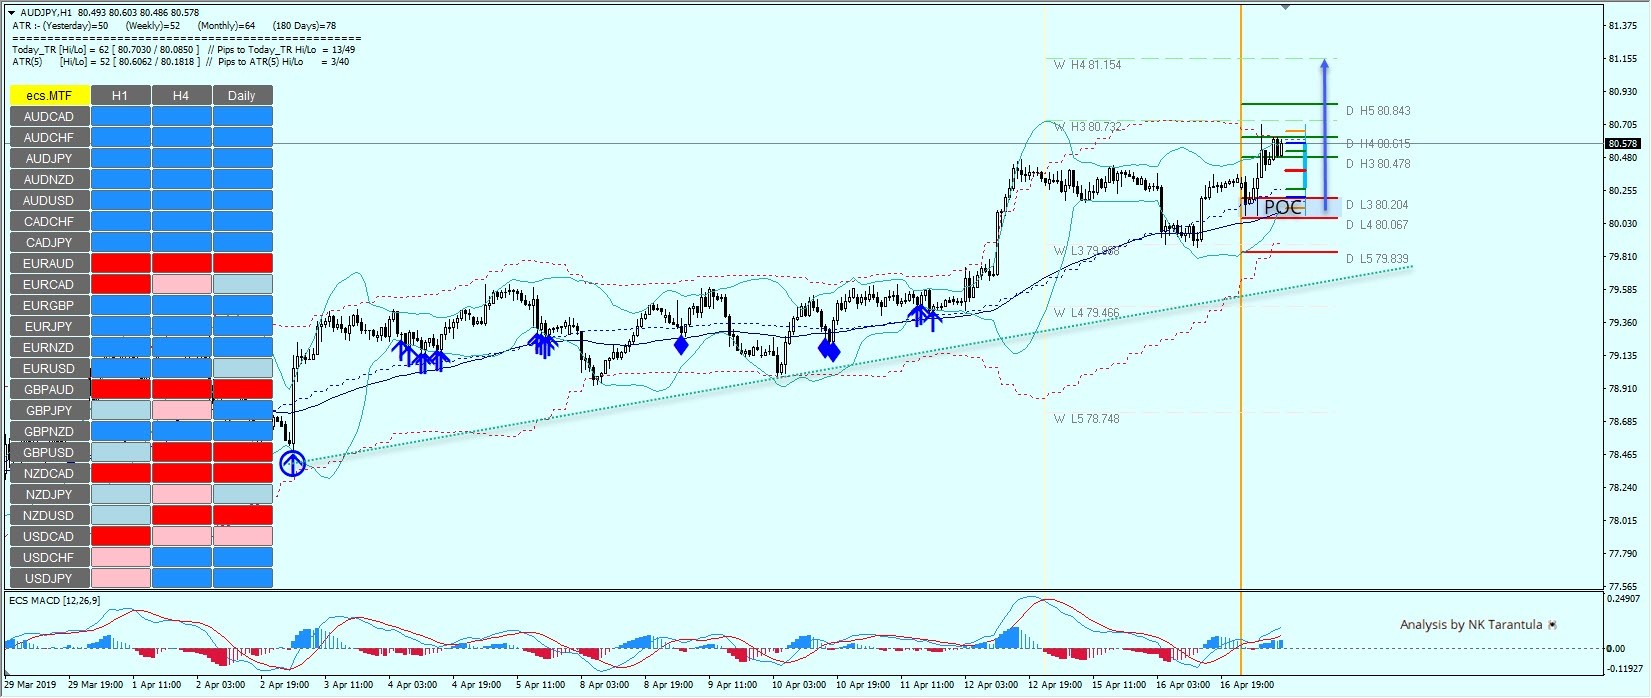
The AUD currency basket acts exactly as planned. Today we have a possible upmove continuation in the AUD/JPY.
Due to a higher demand in iron ore (Australia exports to China) the AUD currency is getting stronger. The AUD/JPY POC zone is 80.05-20 and a pullback within the zone could show up fresh buyers. Coupled with historical buying from the zone, we could see a bounce towards 80.73. If the price makes a close above 80.75, watch for 81.15 – weekly H4 camarilla pivot. The ATR of the AUD/JPY has already been overshot, so it indicates we might see a retracement, but also indicates that the trend is still strong.
Chinese Economy Accelerates
Chinese economy accelerates
The publication of the last batch of Chinese hard data painted a better-than-expected picture of the country’s economic situation. Investors have increasingly worried that slowing growth in the world second largest economy would have a significant global impact. In addition, the trade war unleashed by Donald Trump more than a year was expected to worsen the situation. However, after a rough start into the year, data seems to suggest that the worse over. Retail sales accelerated to 8.7%y/y in March versus forecast of 8.4% and 8.2% in December (no data in January and February due to New Year holidays). Industrial production surprised the most as it jumped 8.5%y/y last month, while market participants expected an increase of 5.9%. Globally, the economic activity stabilised somewhat in the first quarter as GDP growth printed at 6.4%y/y, beating estimates of 6.3%.
Overall, we do not believe that those impressive figures indicate that the Chinese economy is out of the wood. At best, it suggests a slower pace of deceleration. The lack of reaction in both the FX and the equity market indicate that it is not much to celebrate: the yuan barely appreciated against the greenback woth USD/CNY sliding 0.30% to 6.69, while the CSI 300 edged up by 0.04%. On the other hand, it can be seen as a hard blow to the US administration that has been calming for months that the trade war hurting China badly. We do not believe those data are game changer but it could definitely put US negotiators in a weaker position.
The calm after the storm ?
It’s been a very intense period for the GBP. Yet now that a no deal risk is back to minimum and that the European Council appears willing to provide the UK all the time it needs in order to reach an agreement, the wording should rather be that it turns out to become a “permanent extension” and that the 31 October 2019 deadline is thus not written in stone. The UK is expected to take participation in 23 May 2019 EU parliamentary elections in order to ratify the current departure date.
Still, although GBP risk is back to normal, it is becoming clearer that the risk to the real economy is still vivid. The Bank of England adopted a wait-and-see approach in the past 8 months while despite a strong labor market, the economy has been facing major disruptions on the front of fixed asset investment, external trade or inflation. March CPI figures are pointing towards a slowdown to 1.90% (prior: 2%) year-to-year and remains flat m/m (0.20%) while producer prices stay on track (2.40% y/y).
Following recent releases, GBP is likely to drop in current session. Currently trading at 0.86745, EUR/GBP is heading along 0.87040.
Forex Technical Analysis: EUR/USD, USD/JPY, GBP/USD
EUR/USD
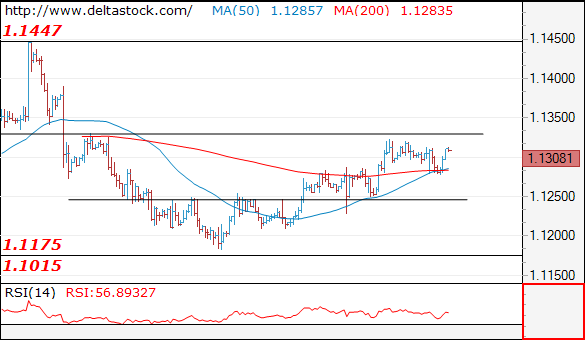
Current level - 1.1308
The slide to 112.80 was corrective and my outlook is positive, for a short-lived break through 1.1330, towards 1.1390 area.
| Resistance | Support | ||
| intraday | intraweek | intraday | intraweek |
| 1.1330 | 1.1450 | 1.1280 | 1.1175 |
| 1.1390 | 1.1570 | 1.1240 | 1.0860 |
USD/JPY
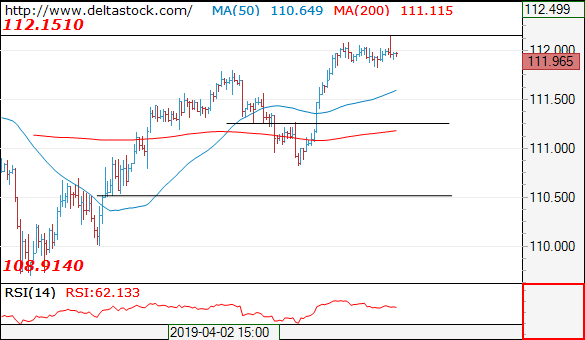
Current level - 111.96
While 112.15 resistance remains intact, there will be a chance of a dip to 111.50 support zone. Next major resistance lies at 113.20
| Resistance | Support | ||
| intraday | intraweek | intraday | intraweek |
| 112.15 | 113.20 | 111.50 | 108.90 |
| 113.20 | 114.50 | 110.50 | 107.40 |
GBP/USD
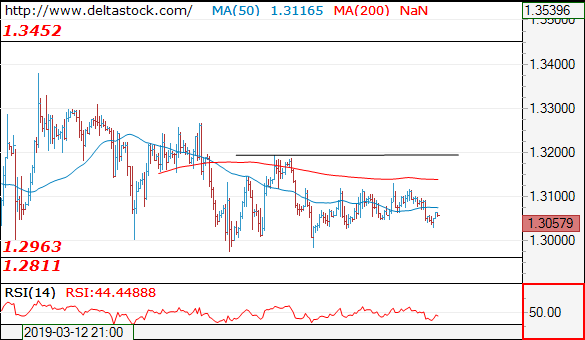
Current level - 1.3057
Trading remains caught in a tight range between 1.3030 and 1.3120 and my outlook is absolutely neutral.
| Resistance | Support | ||
| intraday | intraweek | intraday | intraweek |
| 1.3120 | 1.3450 | 1.2960 | 1.2820 |
| 1.3200 | 1.3450 | 1.2960 | 1.2610 |
Europe Markets Down | Oil Price Gets Its Support
Good news isn't good anymore, especially today. European markets have decided not to celebrate the strong economic data out of China. The Chinese GDP number was healthy (Actual 6.4%, Est 6.3%), even the industrial production numbers were rock-hard: actual 8.5 percent while the forecast was 5.6 percent. This is as good as it can get.
Nonetheless, investors have a different view on this. The concern is that the People Bank of China may change its stance towards its monetary policy- we may not see that much support from the PBOC. The truth is that the handoff from feeble economic numbers to strong economic numbers is here and this is good news. Let's not forget, improving economic conditions over in China means better economic health of the global economy.
In terms of Year to Date market performance, the Shanghai Composite's performance is notable, we are up over 30%. None of the major benchmark indices over in Europe and in the United States have similar performance. This is despite the fact that throughout this year, we had serious alarms ringing about the economic slow down in China.
I am not saying that the performance of the US and European indices aren't applaudable, the Nasdaq index is up 20% year to date- the leading index over in the US. The CAC 40 index is up 16.87 percent YTD and the Dax index is up 14.61 percent.
In terms of commodities, the black gold, WTI is back in the positive territory due to a surprise drop in the crude inventory data released yesterday. This was the first drop in nearly 4 weeks. This surprise drop has supported the price momentum. WTI is trading at 64.46 and the current momentum shows that it is likely that the price may go above the previous resistance of 64.70 formed on the 10th of April. Looking at the daily chart, the next resistance is at 66.42 while the support is at 62.99.