Sample Category Title
Market Malaise
Even Tiger Woods Augusta win could not help the malaise settling over equity markets. The DJIA fell 0.1% to 26,385, the S&P 500 Index was down 0.1% to 2,906. The financial sector led the modest decline as Goldman Sachs and Citigroup presented mixed quarterly results. Even stronger Chinese export data and US regional manufacturing activity provided little excitement. Goldman Sachs reported Q1 EPS of $5.71, above the $4.89 consensus, as revenues declined 13.0% y/y to $8.8 billion, below the projected $8.9 billion. GS stated that it is satisfied with its performance in 1Q, considering the weak trading start to 2019. VIX index moves lower to 12.20 and FX volatility faded further with only fringe EM providing excitement. With news flow limited and volatility, nonexistent USD continues to dominate Euro and CHF as negative yields weigh on directional trades. Chatter about EU elections or EU centric threats (Spanish & elections etc.) is now being faded with markets focused on ECB policy decisions. But this is now the global theme driving asset prices. With the fear of normalization gone (markets are now pricing in rate cuts by the Fed and the ECB), loose monetary policy will prop-up risk-taking. Traders should avoid cyclical repricing due to short-term headlines and focus on structural central bank actions. Case in point 1Q PBoC monetary policy meeting less dovish press statement. Given this thinking, we would reload on risk on pullbacks.
Aussie under pressure as RBA turns dovish
Things have changed rapidly in the past few months. Initially considering a rate hike for 2019, the Reserve Bank of Australia (RBA) has finally changed its rhetoric, gradually turning from a hawkish to neutral and finally reversing towards a dovish bias. The Australian economy continues to face heavy contradictions, with a solid labor market on one hand and a slackening property market on the other, putting the government under pressure ahead of 18 May 2019 general elections.
According to recent national poll survey, 2019 elections are expected to be tight, with a slight advantage provided to PM Scott Morrison Coalition’s (Liberal and National parties’ coalition) opponents from Australian Labor Party. Yet challenges remain as inflation is expected to have declined in 1Q 2019 while weak wage growth and high household debt remain major drawbacks for the RBA. The policy minutes are therefore pointing towards a more dovish policy stance for the year while a first rate cut could occur as early as June 2019. Following the publication of the minutes, the Aussie is the largest loser among G10 currencies. AUD/USD trades at 0.7145, approaching 0.7130 short-term.
Gold & Oil Lost Momentum
Gold
The precious metal is out of luck once again, it is trading below the critical level of $1,300. The reason we are not seeing any rally in the gold price is mainly due to the strength in the US economic data. This has two impacts: firstly, traders are more interested in pouring money in riskier assets. Finally, they do not believe that the Fed is going to maintain the same monetary policy stance which they currently hold.
Moreover, it seems that the trade tensions between China and the US are also going to be resolved fairly soon. Nonetheless, from a hedging perspective, the gold price at its current level is very attractive.
Looking at the daily chart, the price needs to hold above the critical level of 1276. This was the lowest level the price formed back on January 21st. If we break this support zone, it is likely that the price may continue its move towards the $1,250 mark.
We do not expect any major move in the gold price today, I think traders are going to look at the Chinese GDP and industrial production numbers (which are due tomorrow). If we see any improvement in these numbers, it will only strengthen the demand for the riskier assets. Remember, China is the second biggest economy in the world, and an improving economic picture In China means improving the world economy.
Oil
The WTI price is trading in the negative territory, building on the losses which we witnessed yesterday. Year to date, we are still up whopping 36%, a performance which cannot be neglected. Naturally, traders do want to take some profit off the table, especially given the gains we have seen YTD.
US crude oil inventory data is under focus and we have already seen these inventories going higher in the last week's print. The rising inventory data has raised many questions for investors, no one wants to see the oil glut again.
Looking at the oil supply equation, Russia has clearly reduced its oil output to 11.25 million barrels a day, a number seen at the beginning of April. OPEC alone cannot control the oil supply, it needs corporation from non-OPEC countries. Another reason for the current pullback in the oil price is also down to the fact that there are rumors in the market about Russian oil supply cut. The country may back out of the current oil supply cut deal. If this rumor becomes a reality, we can see a serious pullback in the oil price.
In terms of technical analysis, we see the current support at a level of $61, and a break of that will open the door towards the next level which sits at $58. The upside is capped by the resistance level of $64.79, the highest level the price touched on April 9th
Forex Technical Analysis: EUR/USD, USD/JPY, GBP/USD
EUR/USD
Current level - 1.1309
The consolidation pattern below 1.1330 signals a positive bias and with the static support at 1.1280 my outlook is bullish, for a rise towards 1.1390. The mentioned rise should be a short-lived one, followed by a drowning towards 1.1175 lows.
| Resistance | Support | ||
| intraday | intraweek | intraday | intraweek |
| 1.1330 | 1.1450 | 1.1280 | 1.1175 |
| 1.1390 | 1.1570 | 1.1240 | 1.0860 |

USD/JPY
Current level - 111.85
The intraday outlook is bearish, for a slide towards 111.50 minor support. Key resistance lies at 112.15.
| Resistance | Support | ||
| intraday | intraweek | intraday | intraweek |
| 112.15 | 113.00 | 111.50 | 108.90 |
| 112.15 | 114.50 | 110.50 | 107.40 |

GBP/USD
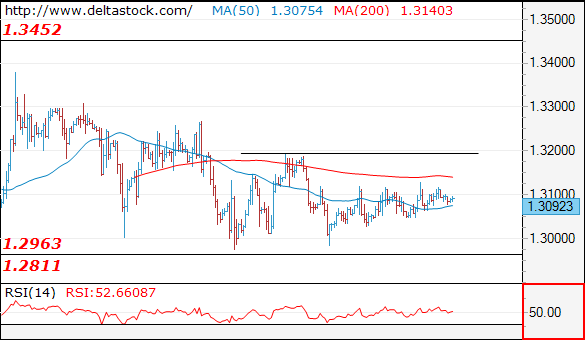
Current level - 1.3092
Trading remains caught in a tight range between 1.3030 and 1.3120 and my outlook is absolutely neutral.
| Resistance | Support | ||
| intraday | intraweek | intraday | intraweek |
| 1.3120 | 1.3450 | 1.2960 | 1.2820 |
| 1.3200 | 1.3450 | 1.2960 | 1.2610 |
AUD/USD Outlook: Aussie Falls After Soft RBA Minutes
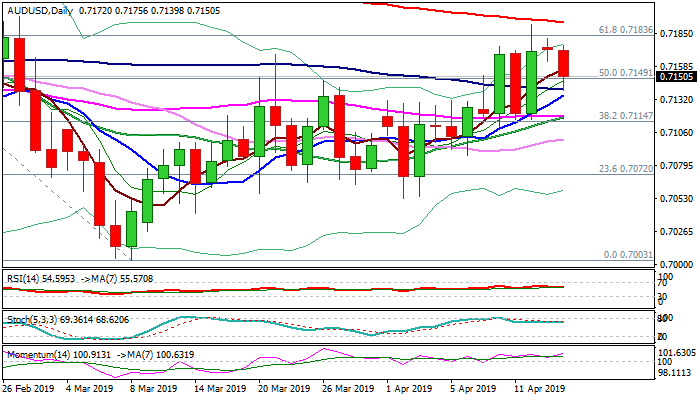
The Aussie dollar fell 0.38% in Asian session on Tuesday, following release of minutes of RBA's April meeting. Dovish tone from the central bank, which left the door open for rate cut if inflation remains low and slowdown in GDP offsets positive impact from improve in the labor market. Fresh weakness emerges after bulls stalled on approach to 200SMA (0.7194) and failed to clearly break above 0.7183 (Fibo 61.8% of 0.7295/0.7003), with Monday's Doji adding to negative signal. Dip found footstep at 0.7140 (100SMA), but could extend towards pivotal support at 0.7118 (converged 20/55SMA's). Daily cloud is thinning and will twist next week that could also attract bears, however, bullish momentum remains strong and may limit bears. Ability to hold above 100SMA would keep in play immediate hopes for renewed attack at 200SMA, while further easing and violation of key 0.7120 support zone (Fibo 38.2% 0.7003/0.7192/converged 20/55SMA's would weaken the structure and risk deeper pullback.
Res: 0.7175, 0.7194, 0.7207, 0.7226
Sup: 0.7140, 0.7120, 0.7097, 0.7075
EUR/USD Outlook: Euro Remains Bid But Faces Strong Headwinds From Thick Daily Cloud
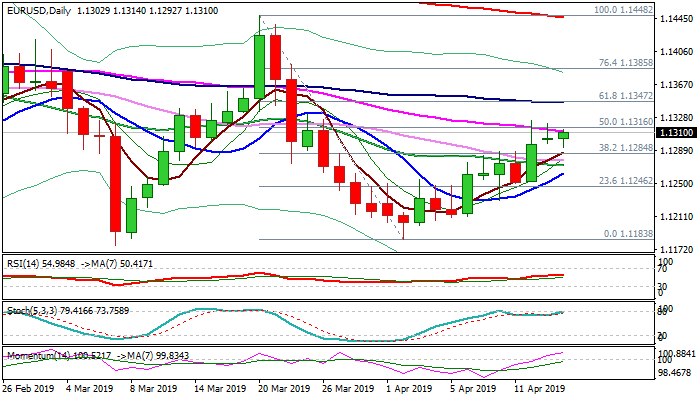
The Euro remains bid and probes again through daily cloud base (currently at 1.1308) following repeated failure to penetrate cloud in past two days, with action being capped by falling 55SMA. Rising bullish momentum supports the action but may conflict with overbought stochastic on daily chart. Sustained break above pivots at 1.1312/16 (55SMA/50% of 1.1448/1.1183) would generate fresh bullish signal for recovery extension towards 1.1347 (Fibo 61.8%) and possible acceleration towards 1.1372 (daily cloud top). Broken 30SMA (1.1277) needs to hold and maintain bullish bias.
Res: 1.1323, 1.1347, 1.1372, 1.1385
Sup: 1.1292, 1.1277, 1.1262, 1.1230
WTI Marginally Lower On News Around Production Cut Deal
Crude oil fell on Monday despite Libya's production remaining under threat and regardless of tightening supplies. Russia's minister, Anton Siluanov, hinted at a market share fight between Russia and OPEC, against the United States. The Russian finance minister's comments indicated that the production cut deal may be abandoned in order to allow prices to fall. That would "shrink" American output.
Oil Could Correct, But No one Knows Where To
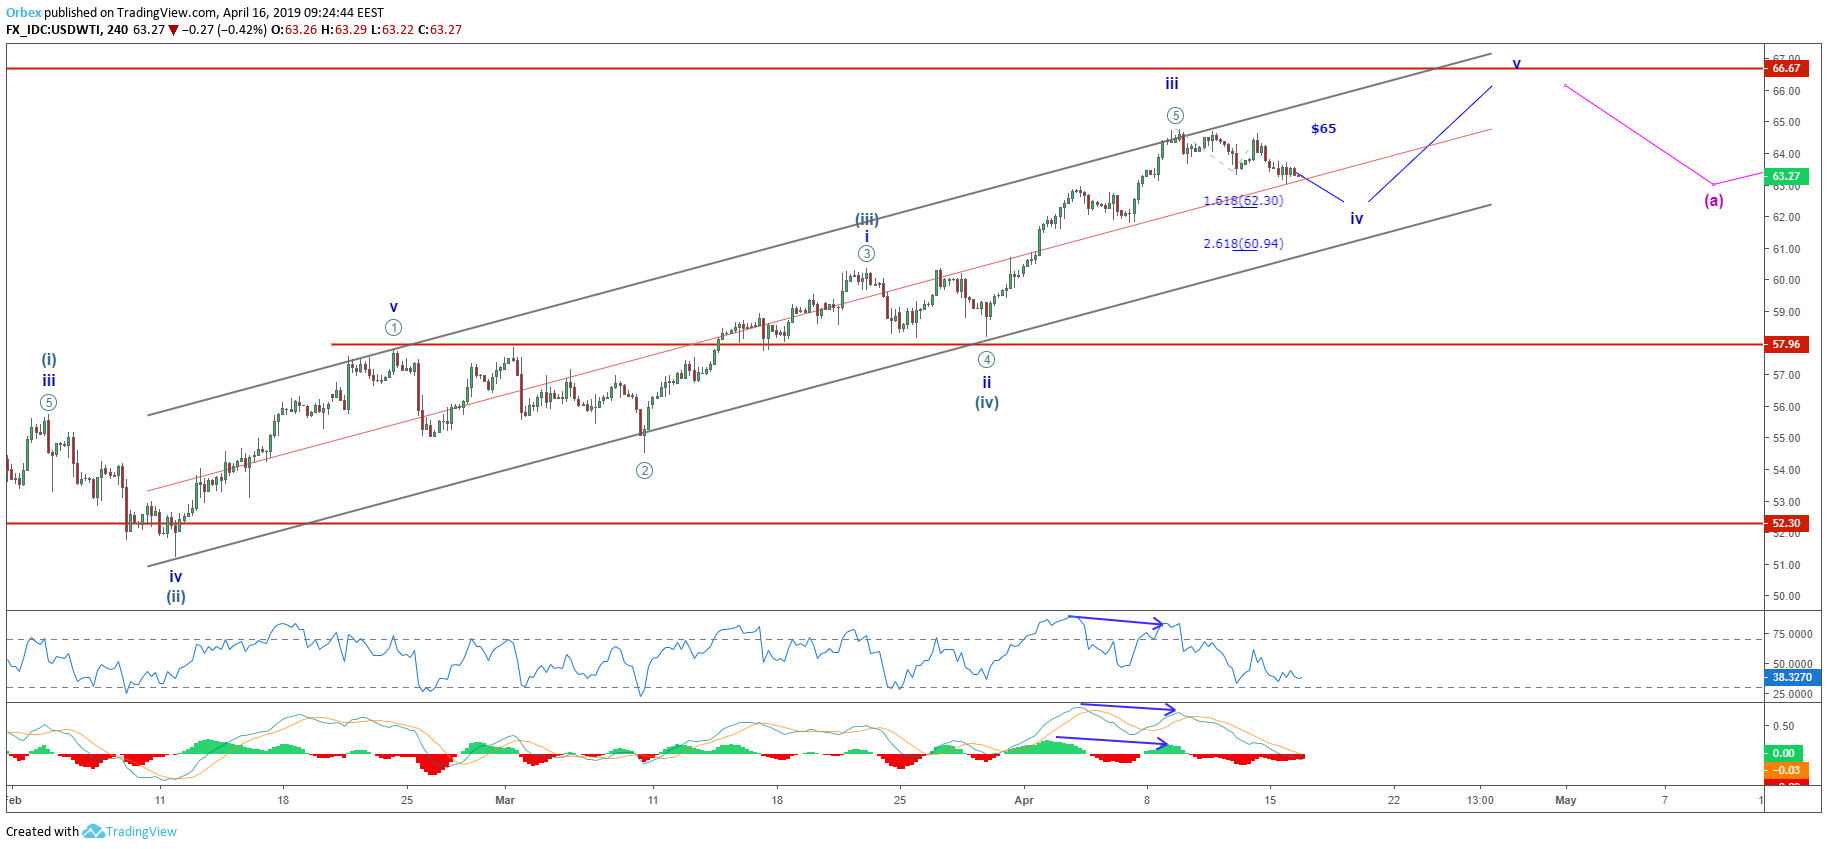
The prices of crude oil also saw a rejection near a psychological level. Bears stepped in just before the $65 per barrel barrier and caused a short-term correction that could lead prices further down. In the unlikely scenario that the middle trendline (red) holds, WTI would most likely move higher either for a double top of continuation of the bullish trend. However, a slide down to the lower trendline of the ascending channel (grey) is also possible in the short-term.
Aussie Slips Lower On Dovish Comments From RBA Minutes
AUDUSD started the week on a similar note to EURUSD but overnight trading amid RBA's minutes pushed the currency pair 0.4 percent down. Tuesday's flows started coming through after the central bank said that since inflation remained stubbornly neutral and unemployment rose a "decrease in the cash rate would likely be appropriate"
Bearish Push Now Supported From Fundamentals Too
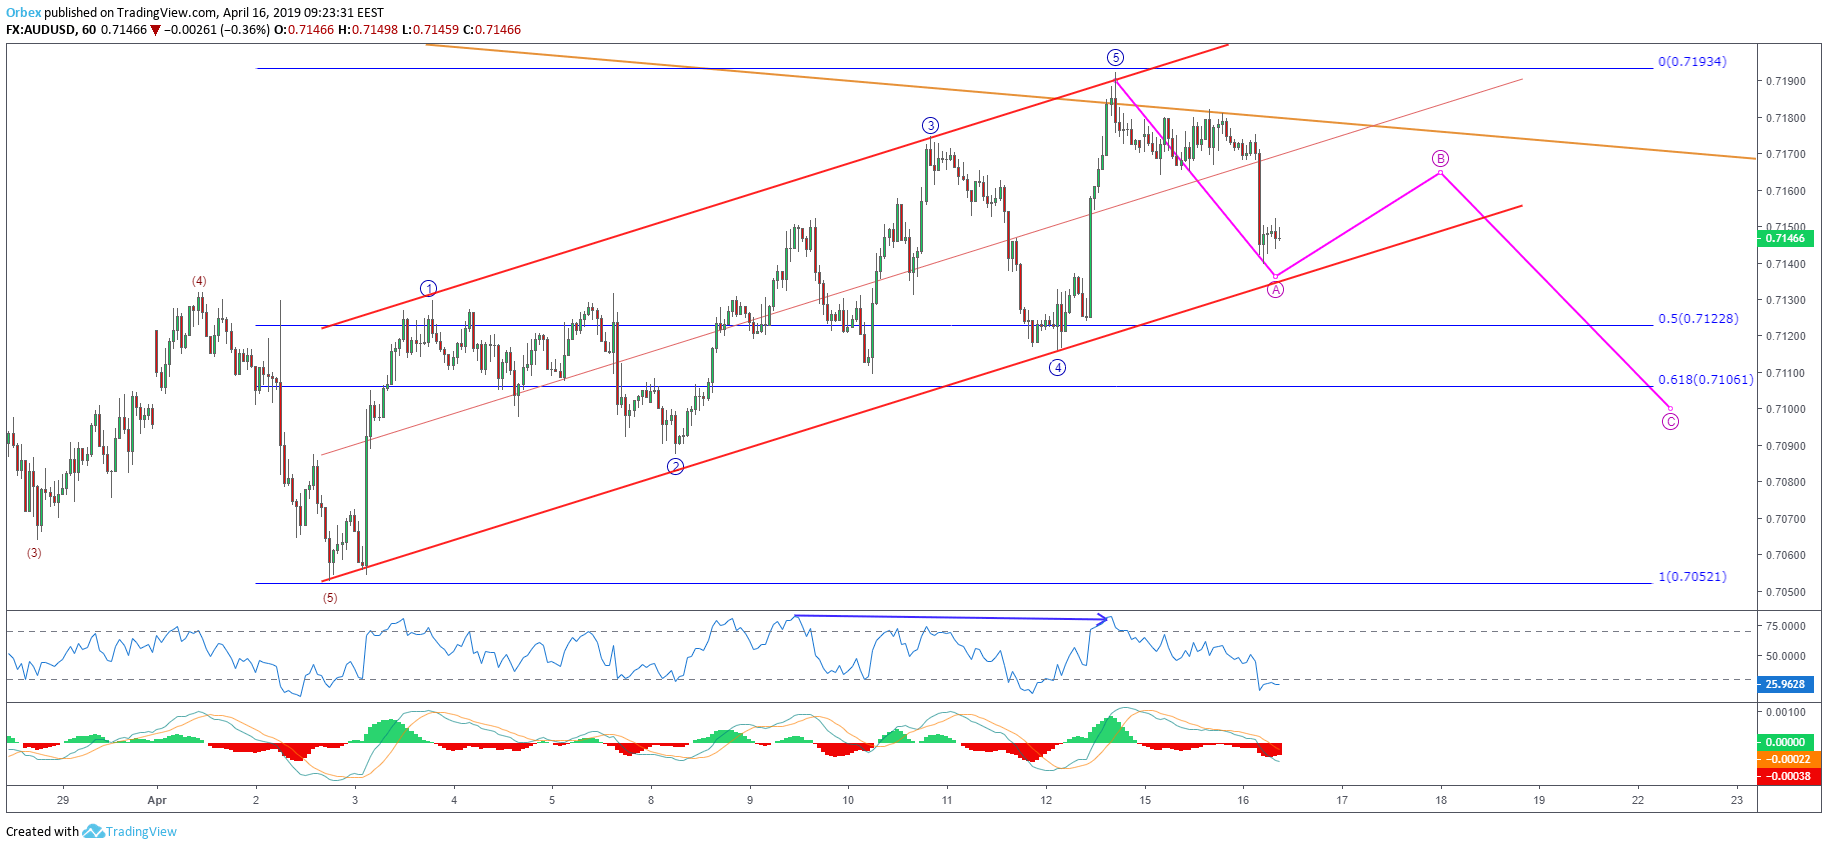
Aussie bulls had a go at the last upside move near $0.72 last week and failed. Monday's attempt was even more piteous. With a confluence between the long-term descending trendline (yellow) and the short-term ascending trendline (red) weighing in on prices, the currency pair could head lower towards the golden ratio near 71c. barrier. However, a downside break outside the short-term ascending channel must take place first.
Euro Bulls Fail As All Eyes Shift To German ZEW
EURUSD bulls attempted to break to fresh highs on Monday but failed as they stumbled upon a big psychological resistance at $1.13. With a muted dollar, a light calendar and a relatively slow start to the week, euro traders decided to trade small. Right now, they are patiently waiting for the critical ZEW economic data due to be released. Analysts expect German and euro area sentiment to leave recessionary levels after a depressing period of over one year.
Rejected At $1.13, A Deeper Correction Is Now Possible
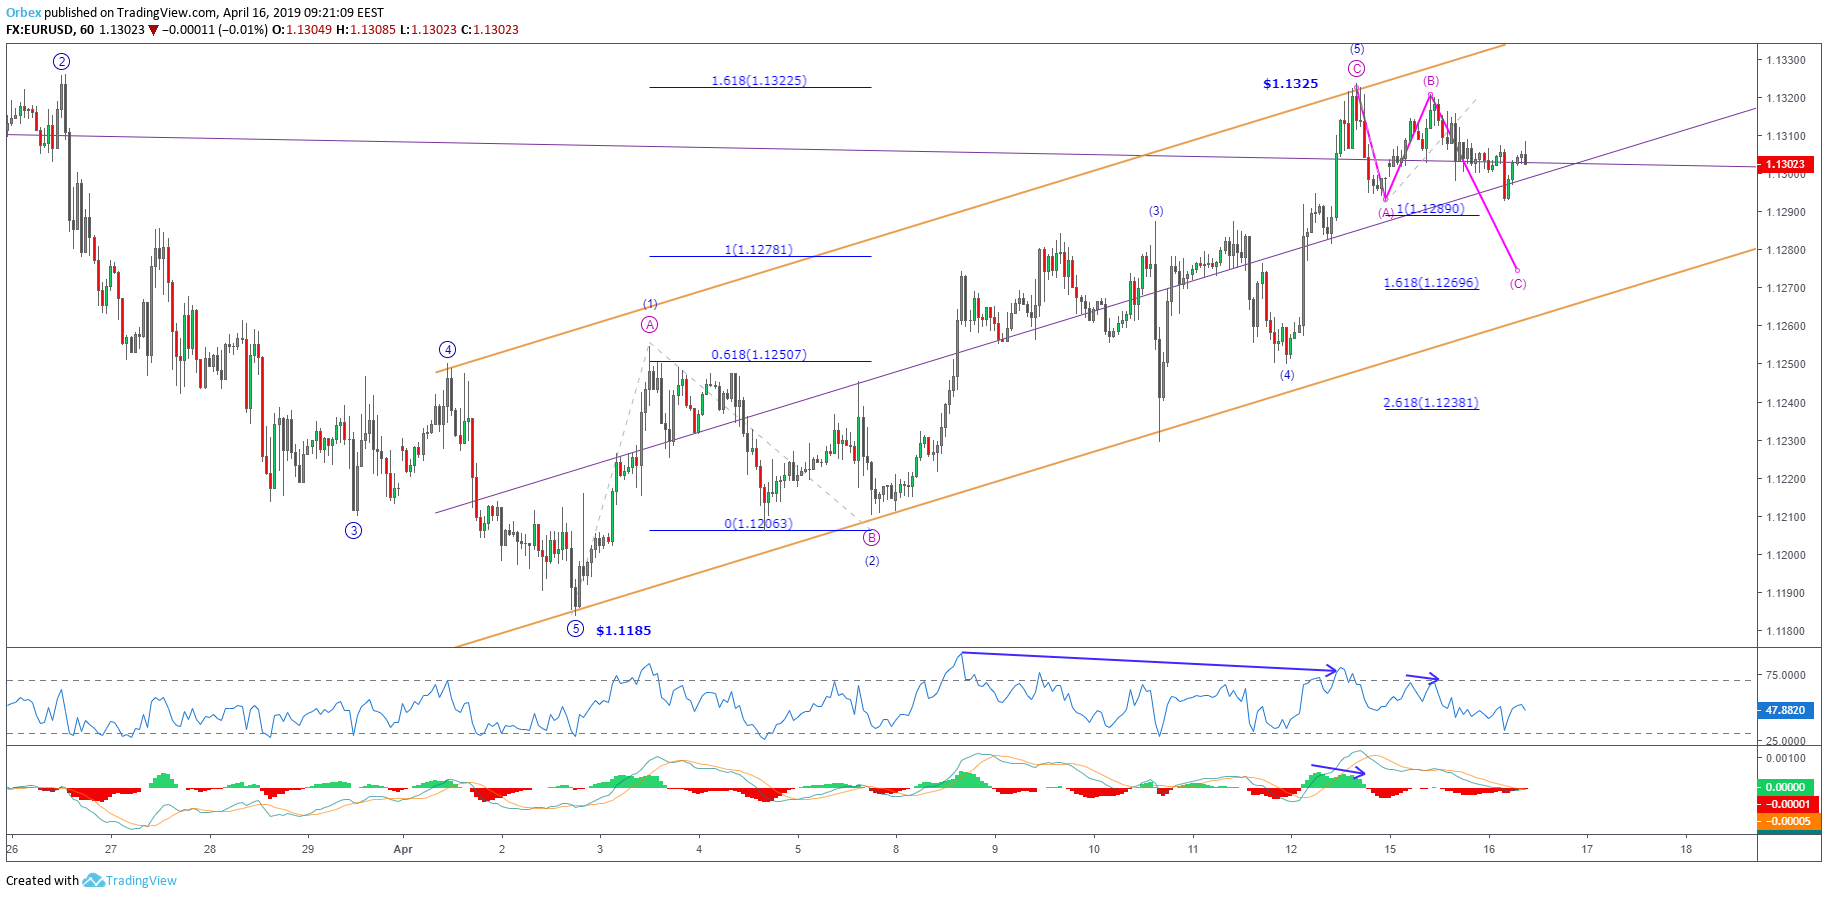
It has been a good run for the EURUSD since the double bottom down at $1.1180. Euro rode 140 pips in an impulse move to the upside and received a rejection as the 1.618 Fibo extension at $1.1322 and the upper channel trendline rejection weighed prices down. Since then, the popular pair started correcting down to $1.1289 with the first leg (A to B) suggesting a deeper correction towards $1.1269, or lower.
Stock Market Rally Takes Breather, Gold Edges Lower
Stocks in Asia eked out gains during early trading even as the S&P500 eased off its six-month high, after disappointing results from Goldman Sachs and Citigroup weighed on risk appetite. Market expectations over this quarterly reporting season being the weakest in three years has left investors wondering how much upside remains for stocks.
For proper context, the S&P500 is still just less than 1 percent away from its record high, while the MSCI Asia Pacific Index has already climbed by some 11 percent so far in 2019.Even asthe catalyst to drive risk sentiment over the near-term revolves around the current US earnings season, equity bulls may have to turn their attention elsewhere to find reasons to send stocks higher. With lingering concerns over slowing global growth, US-China trade developments and Brexit among the many other geopolitical risk factors straining sentiment, the options for equity bulls look limited.
PBoCto ease on stimulus?
The People's Bank of China is singing a different tune compared to the dovish tones coming from major central banks around the world.The PBoC released a statement from its April 12 meeting, saying the Chinese economy “has shown healthy development and economic growth is resilient”.
Such rhetoric frames the expectations surrounding Wednesday's release of China's Q1 GDP, industrial output, and retail sales data, as the Yuan remains steady against the US Dollar around the 6.71 handle at the time of writing.
However, markets are also interpreting this confident outlook as reason for the PBoCto withhold more stimulus; the PBoC has previously said it would not “flood” the economy with excessive liquidity. With market sentiment perhaps over-reliant on the potential for more stimulus measures, equity markets have indulged in some profit-taking, with the Shanghai Composite Index some 100 points off its highest level since March 2018.
Gold to test $1,280 support level … again
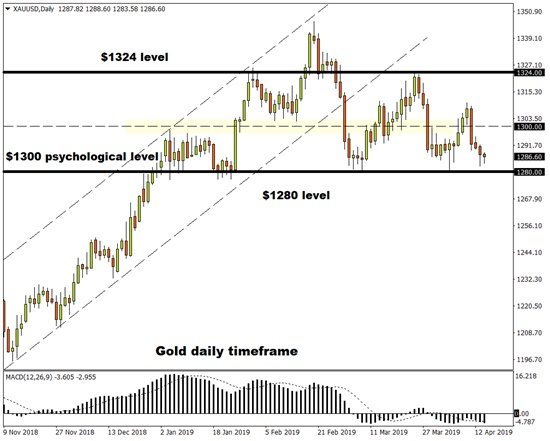
Gold is on course for testing the $1,280 support level yet again, as the resilient US Dollar makes it harder for the precious metal to hang on to gains.
Broadly, global risk sentiment has been supported by China showing signs of stabilizing and hopes that the US-China trade saga will conclude with a breakthrough deal. However, with the ECB and the IMF warning that risksremain tilted to the downside, markets do not yet have the all-clear for charging into a risk-on side. This alone should provide support for Gold prices at the $1280 floor.
Focusing on the medium to longer-term outlook, Gold remains protected by concerns over slowing global growth, Brexit, geopolitical risks and a dovish Federal Reserve. As long as these themes remain present, the metal still has ample upside potential.
WTI Futures Slow Down But Still Above Rising Trend Line
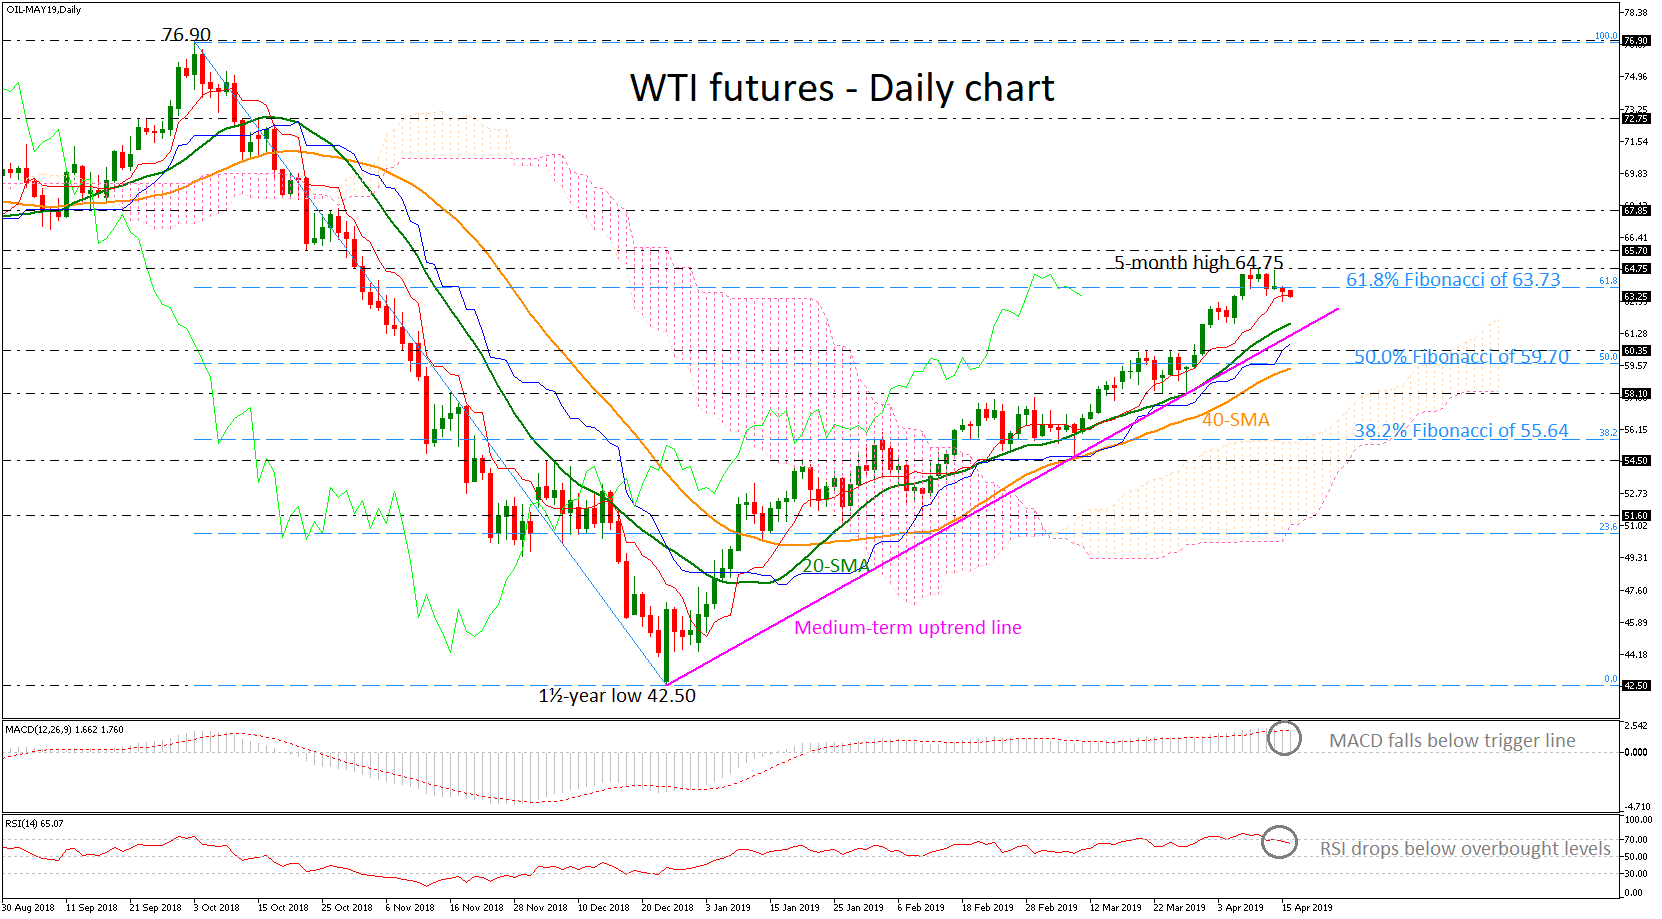
WTI futures recorded a stunning rally in the previous weeks towards a fresh five-month high of 64.75, marking a run above the 61.8% Fibonacci retracement level of the downleg from 76.90 to 42.50, around 63.73. This week, though, the price is on the backfoot and the technical indicators suggest that the market could ease in the short-term.
The RSI is currently moving with increasing negative momentum towards its neutral threshold of 50 after an exit from overbought levels, while the MACD is slowing down in positive territory, both hinting that the next move in prices could be on the downside rather than on the upside. However, the blue Kijun-sen line and the Ichimoku cloud still confirm the upside tendency in the near term.
If the price continues to turn lower, immediate support is coming from the 20-day simple moving average (SMA) currently at 61.87 and the medium-term ascending trend line around 61.60. Even lower the oil price could rest at the 60.35 support and the 50.0% Fibonacci of 59.70, switching the bullish outlook to neutral. Also, near these levels the 40-day SMA is providing support before the 58.10 barrier.
On the other side, a jump above the five-month high 64.75 could endorse the medium-term uptrend move, driving the price until 65.70 and then towards the 67.85 resistance, taken from the peak on October 2018.
In the medium-term, the outlook remains positive since prices hold above the rising trend line and the bullish cross between the 20- and 40-day SMAs.