

Sample Category Title
EUR/USD Could Reach 1.1330
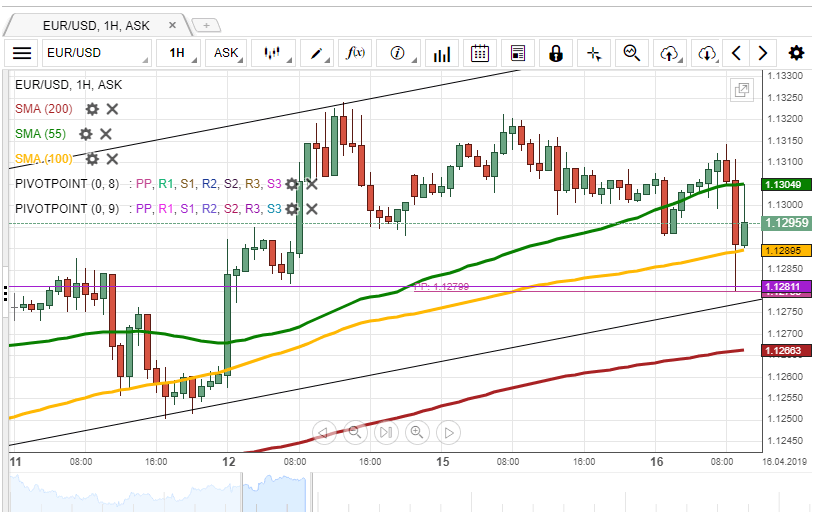
Yesterday, the EUR/USD currency pair traded sideways between the psychological levels at 1.1300 and 1.1320 respectively.
Given that the pair is supported by the 55-hour SMA, currently located at 1.1305, it is likely, that some upside potential prevails in the market. A possible upside target is the 1.1330 level.
Otherwise, it is expected, that the exchange rate continues to trade sideways between the given psychological levels.
It is unlikely, that the rate could decline lower than 1.1280 due to the support level formed by the weekly and monthly PPs.
GBP/USD Supported By 55-, 100– And 200-Hour SMAs
During Monday's session, the GBP/USD exchange rate re-tested the upper boundary of the falling wedge pattern at 1.3115.
From a technical perspective, it is unlikely, that the rate could trade down in the short run, as it is supported by the 55-, 100– and 200-hour SMAs, as well the weekly PP in the 1.3081/1.3091 range.
It is likely, that the currency pair trades sideways, trying to surpass the given support cluster.
However, if the given support does not hold, the pair might target the psychological level at 1.3060.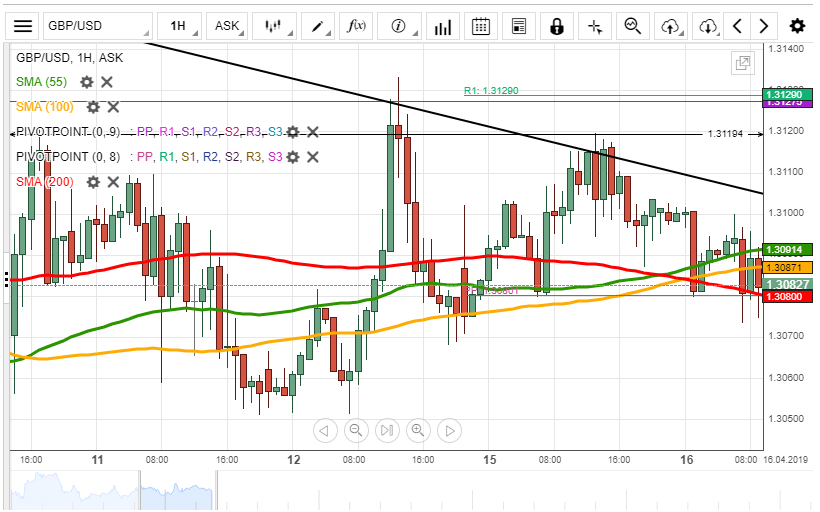
USD/JPY Likely To Trade Sideways
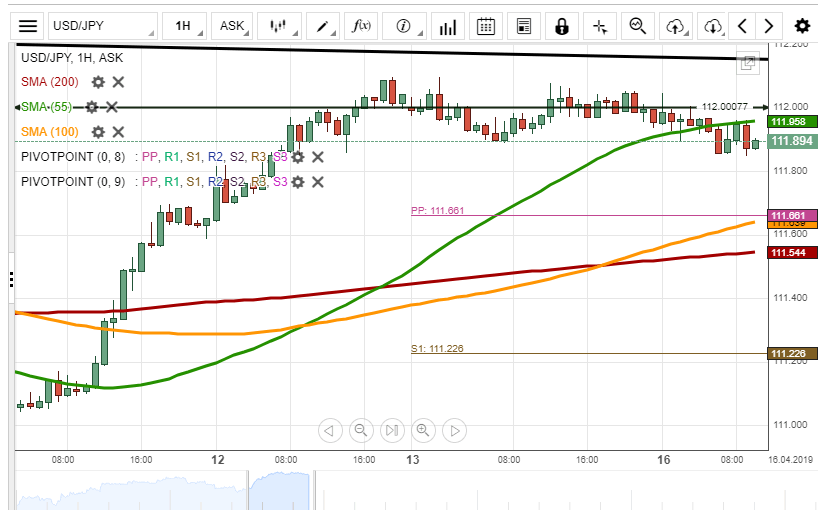
On Monday, the USD/JPY currency pair traded sideways around the psychological level at 112.00.
It is unlikely, that the pair could add to gains, as it is pressured by the resistance level—the monthly R1 at the 112.11 mark. Given, that the exchange rate is supported by the 55-hour SMA at 111.96, it is expected, that it continues to trade sideways.
If the given resistance does not hold, it is likely, that some upside potential prevails in the market, and the rate targets the psychological level at 112.20.
XAU/USD: Descending Triangle In Sight
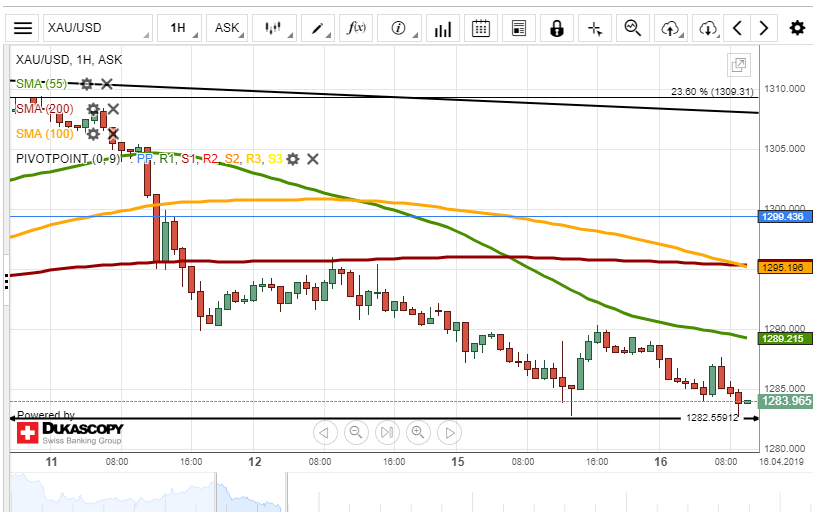
During the previous trading session, the price for gold reached the lower boundary of the descending triangle pattern at 1,282.56.
From a theoretical point of view, the XAU/USD exchange rate should reverse north and continue going up. However, the rate has to surpass the resistance formed by the 55-hour SMA, currently located at 1,289,40.
If the given pattern does not hold, it is likely, that a breakout south occurs in the nearest future, and the price for gold surpasses the psychological level at 1,280.00.
GBP/USD Outlook: Mild Reaction On UK Jobs/Earnings Data Keeps Pound At Familiar Levels
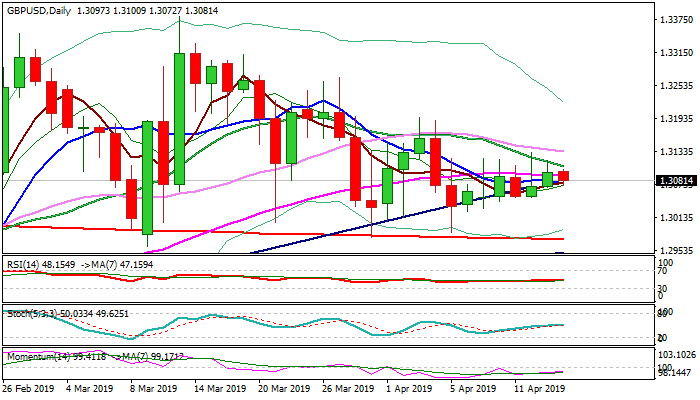
Cable remains under daily cloud top (currently at 1.3108) following mild reaction on UK jobs data.
Unemployment remains unchanged in Feb (3.9%), employment in three months to Feb came slightly above expectations (179K vs 173K f/c) but stronger than expected jobless claims (Mar 28.3K vs 20K f/c) offset positive impact.
The most significant average earnings remained unchanged and in line with forecast (3.5%).
The pair remains within multi-day congestion that stays capped by daily cloud top, with scenario supported by flat daily indicators and absence of Brexit news in holiday-shortened and lower-volumes week, maintaining sideways mode.
Daily cloud top / Fibo 38.2% of 1.3381/1.2977 (1.3108/16) mark pivotal barriers, break of which is needed to generate initial bullish signal.
Conversely, dip below near-term congestion floor at 1.3040 zone would generate initial negative signal and expose key support at 1.2972 (200SMA).
Res: 1.3108, 1.3116, 1.3134, 1.3179
Sup: 1.3072, 1.3042, 1.3030, 1.2972
The Analytical Overview Of The Main Currency Pairs
The EUR/USD currency pair
Technical indicators of the currency pair:
Prev Open: 1.13032
Open: 1.13031
% chg. over the last day: -0.02
Day's range: 1.12927 – 1.13119
52 wk range: 1.1214 – 1.2557
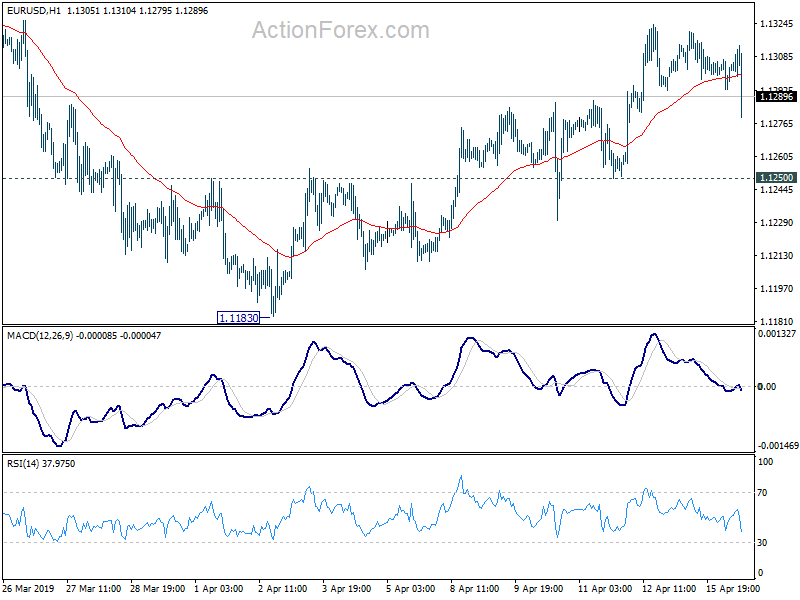
At the moment, the euro has become stable after the rally last week. A unidirectional trend is not observed. Investors have taken a wait-and-see attitude before important economic releases coming later this week. Local support and resistance levels are still 1.12900 and 1.13200, respectively. The EUR/USD quotes have the potential for further growth. Donald Trump сriticized the Fed again, which puts additional pressure on the US currency. We recommend opening positions from the key levels.
The News Feed on 16.04.2019:
German ZEW economic sentiment index at 12:00 (GMT+3:00);
Industrial production in the US at 16:15 (GMT+3:00).
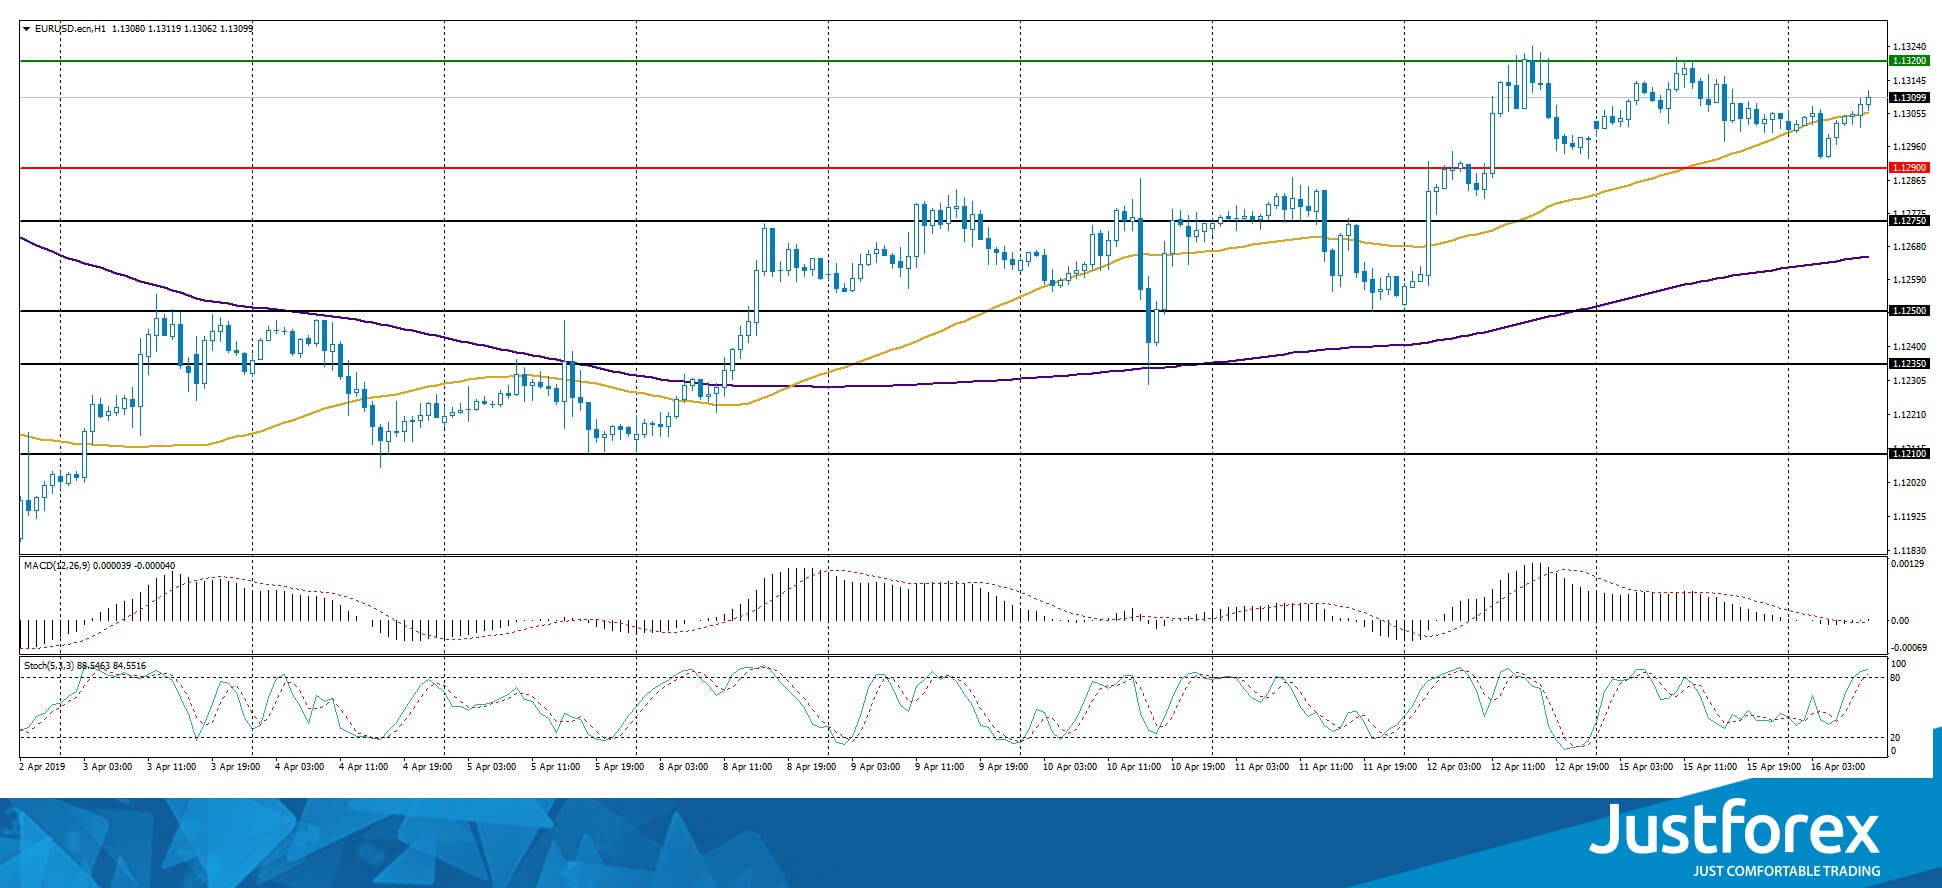
Indicators do not send accurate signals: the price has crossed 50 MA.
The MACD histogram is near the 0 mark.
Stochastic Oscillator is in the overbought zone, the %K line is above the %D line, which gives a weak signal to buy EUR/USD.
Trading recommendations
Support levels: 1.12900, 1.12750, 1.12500
Resistance levels: 1.13200, 1.13500, 1.14000
If the price fixes above the level of 1.13200, further growth of the EUR/USD quotes is expected. The movement is tending to 1.13500-1.13800.
An alternative may be the decrease of the EUR/USD currency pair to 1.12700-1.12500.
The GBP/USD currency pair
Technical indicators of the currency pair:
Prev Open: 1.30722
Open: 1.30883
% chg. over the last day: +0.13
Day's range: 1.30753 – 1.31015
52 wk range: 1.2438 – 1.4378
The British pound is being traded in a protracted flat. The technical pattern is ambiguous. Investors expect up-to-date information on the Brexit issue. On Monday British Foreign Secretary Jeremy Hunt said that negotiations between the government and the opposition Labour Party were proceeding progressively and constructively. Local support and resistance levels are still 1.30650 and 1.31000, respectively. Positions should be opened from these marks.
At 11:30 (GMT+3:00) a report on the labor market will be published in the UK.
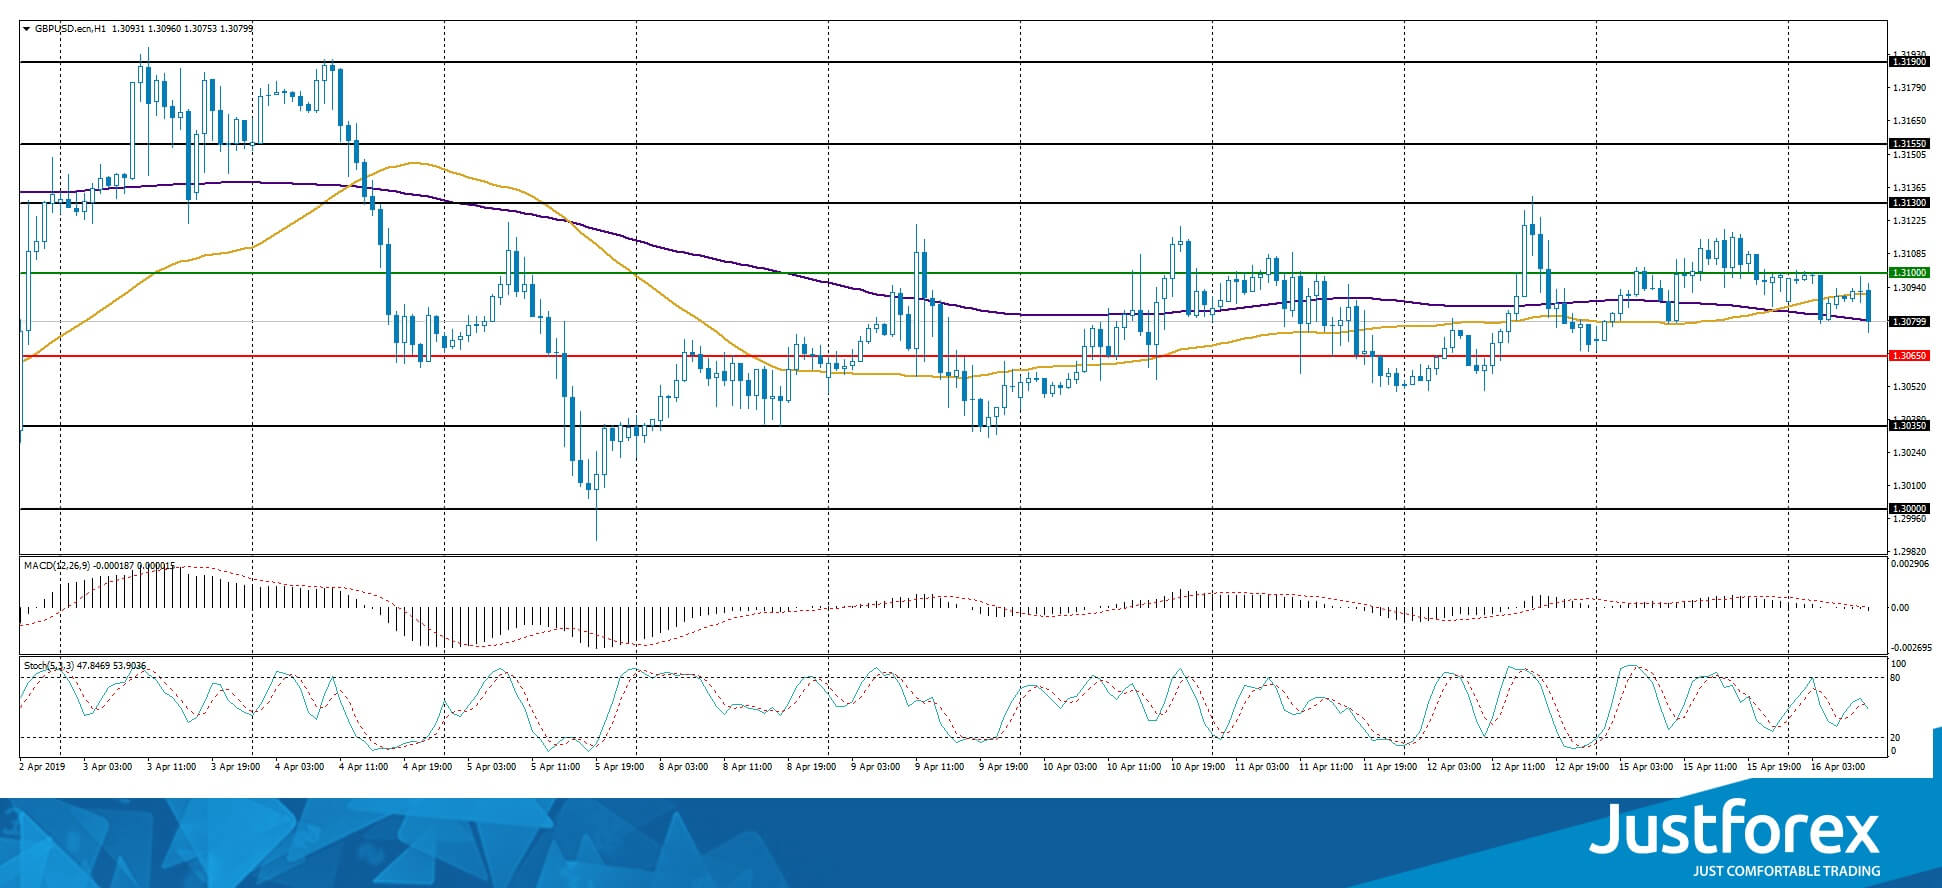
Indicators do not send accurate signals: the price has crossed 50 MA and 200 MA.
The MACD histogram is located near the 0 mark. There are no signals at the moment.
Stochastic Oscillator is in the neutral zone, the %K line has crossed the %D line. There are no signals at the moment.
Trading recommendations
Support levels: 1.30650, 1.30350, 1.30000
Resistance levels: 1.31000, 1.31300, 1.31550
If the price fixes above the round level of 1.31000, the GBP/USD currency pair is expected to grow. The movement is tending to 1.31300-1.31500.
An alternative may be a drop in the GBP/USD quotes to 1.30400-1.30200.
The USD/CAD currency pair
Technical indicators of the currency pair:
Prev Open: 1.33304
Open: 1.33662
% chg. over the last day: +0.22
Day's range: 1.33662 – 1.34029
52 wk range: 1.2248 – 1.3664
Yesterday's trading on the USD/CAD currency pair was very active. Aggressive purchases were observed in the trading instrument. The USD/CAD quotes have reached monthly highs. At the moment, Loonie is consolidating near the round level of 1.34000. The 1.33750 mark is the nearest support. We recommend paying attention to the dynamics of oil prices. Positions should be opened from the key levels.
Today, the news feed on the economy of Canada is rather calm.
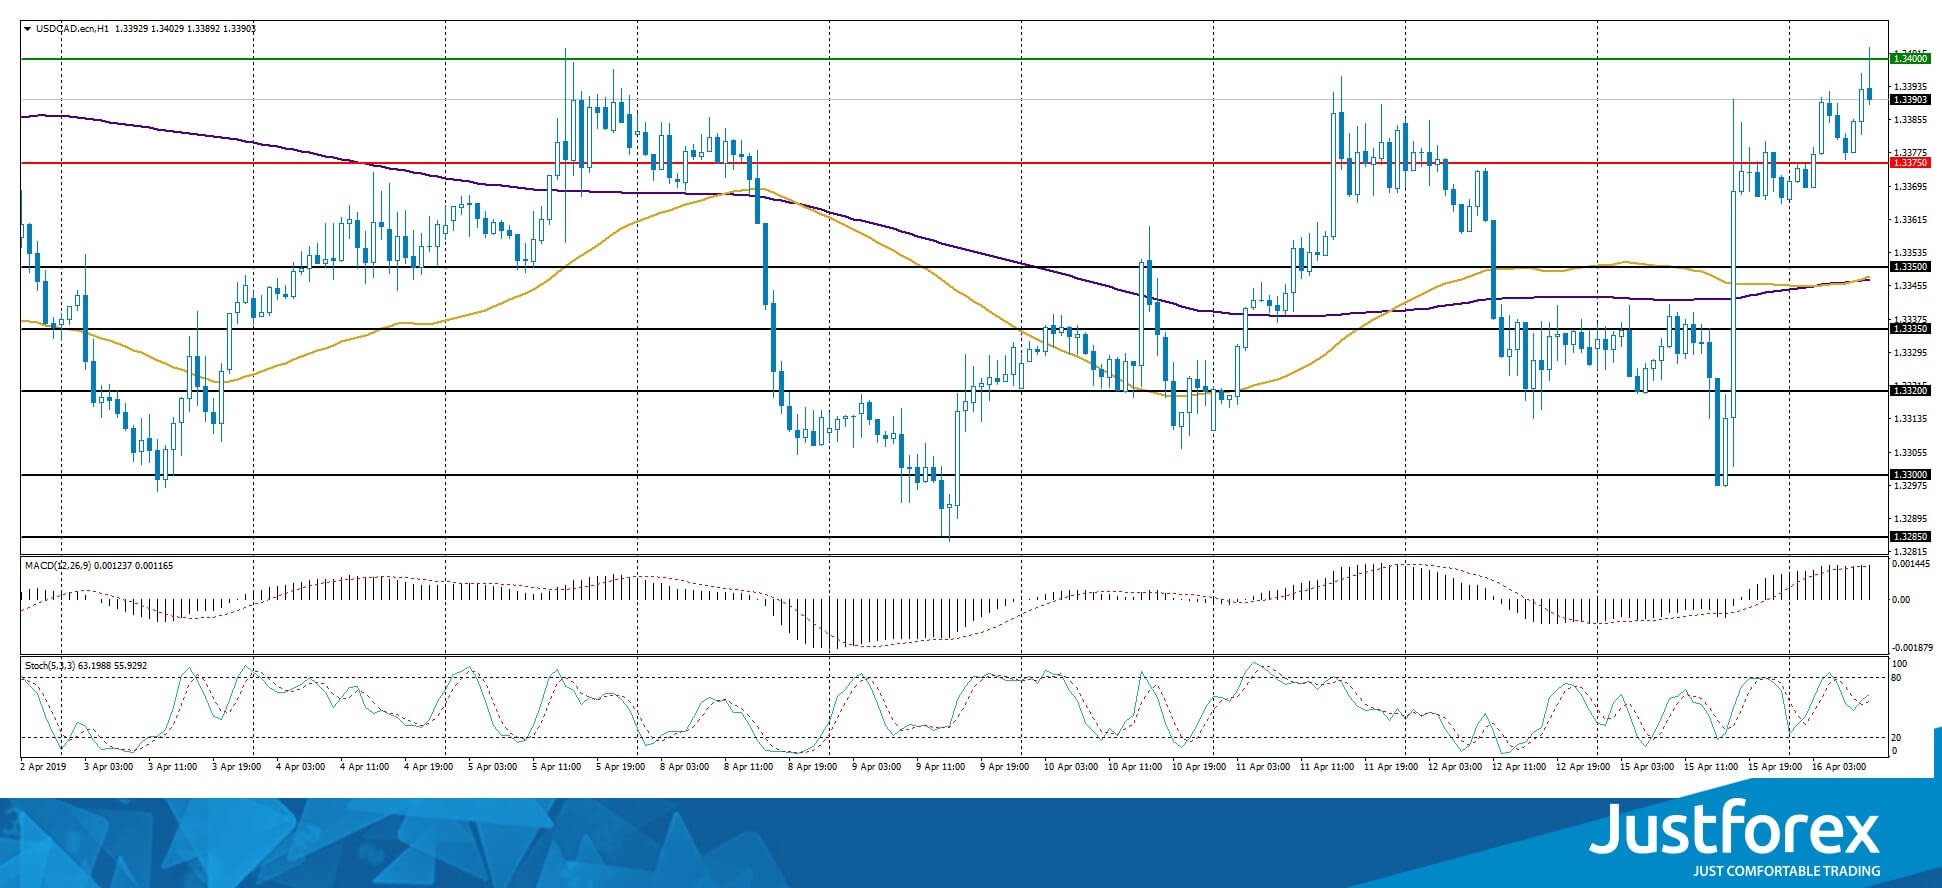
Indicators indicate the power of buyers: the price has fixed above 200 MA.
The MACD histogram is in the positive zone and continues to rise, which indicates the bullish sentiment.
Stochastic Oscillator is in the neutral zone, the %K line has crossed the %D line. There are no signals at the moment.
Trading recommendations
Support levels: 1.33750, 1.33500, 1.33350
Resistance levels: 1.34000, 1.34500
If the price fixes above the round level of 1.34000, further growth of the USD/CAD quotes is expected. The movement is tending to 1.34400-1.34600.
An alternative may be the correction of the USD/CAD currency pair to 1.33600-1.33450.
The USD/JPY currency pair
Technical indicators of the currency pair:
Prev Open: 111.961
Open: 112.019
% chg. over the last day: +0.07
Day's range: 111.853 – 112.045
52 wk range: 104.56 – 114.56
The USD/JPY currency pair has become stable near annual highs. At the moment, quotes are consolidating. Local support and resistance levels are 111.800 and 112.000, respectively. In the near future technical correction is not excluded. US President Donald Trump criticized the Fed's policy again, which puts additional pressure on the US currency. We recommend opening positions from the key levels.
During the Asian trading session, weak data on economic activity in the services sector have been published in Japan.
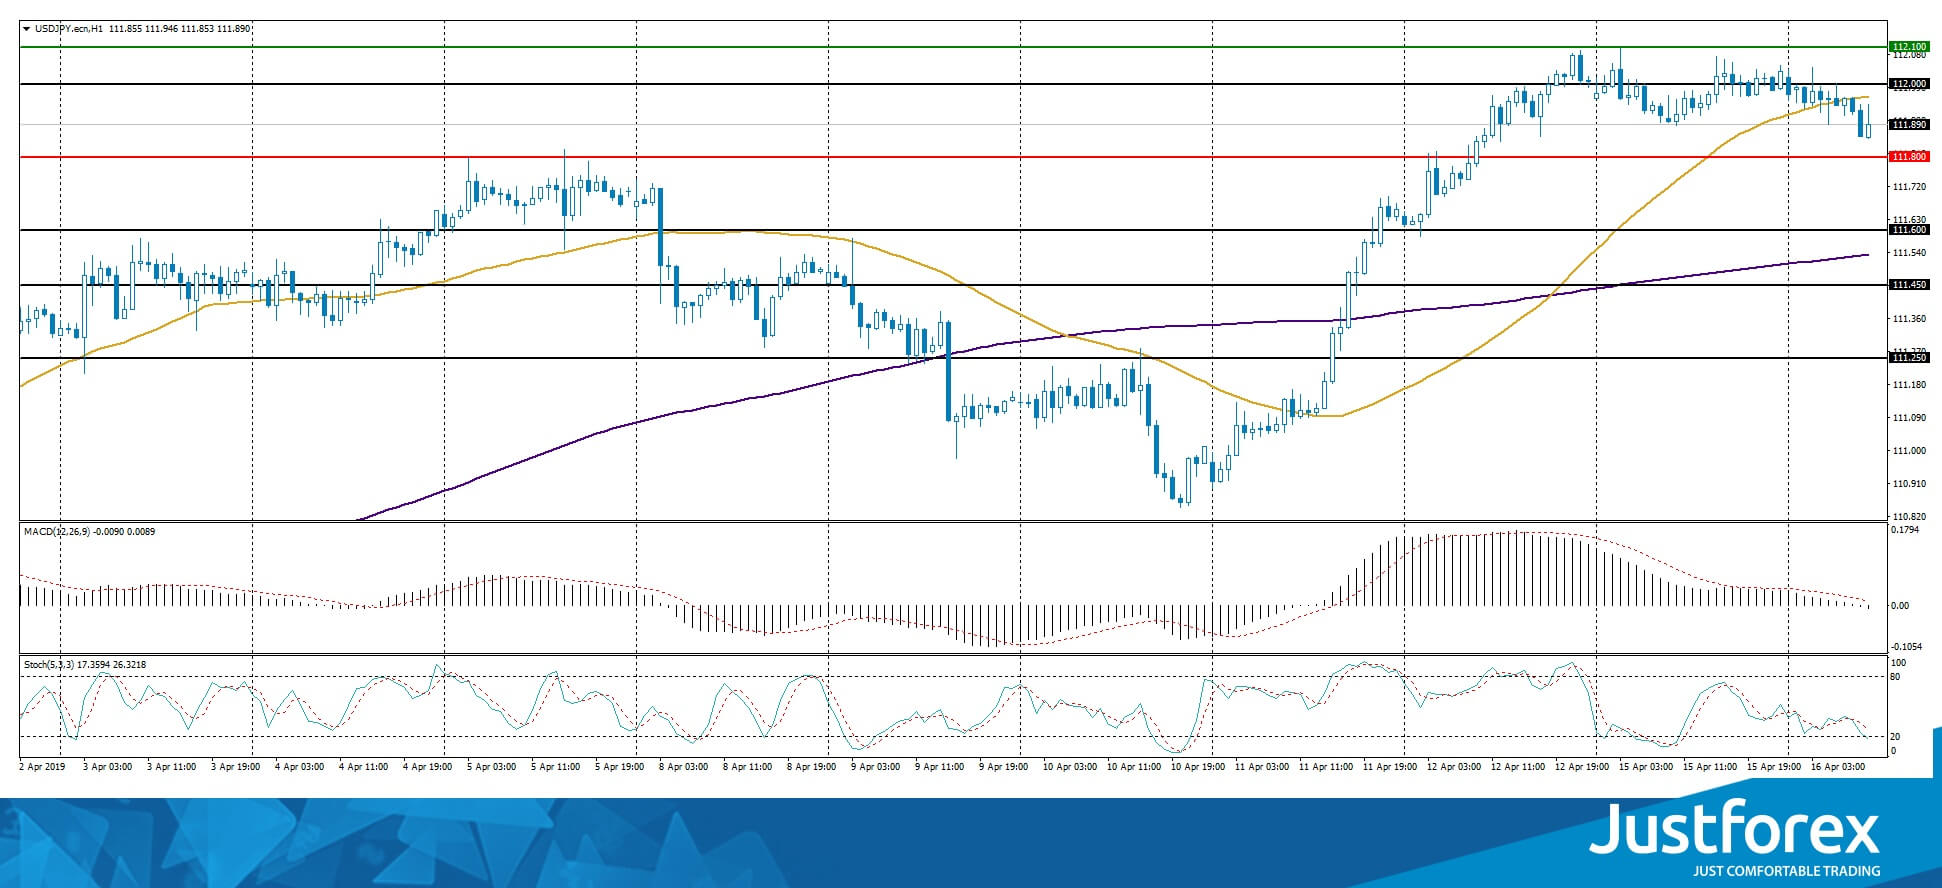
Indicators do not send accurate signals: the price has fixed between 50 MA and 200 MA.
The MACD histogram is near the 0 mark.
Stochastic Oscillator is located near the oversold zone, the %K line is below the %D line, which gives a weak signal to sell USD/JPY.
Trading recommendations
Support levels: 111.800, 111.600, 111.450
Resistance levels: 112.000, 112.400, 112.600
If the price fixes above 112.100, further growth of the USD/JPY quotes is expected. The movement is tending to 112.500-112.700.
An alternative may be the correction of the USD/JPY currency pair to 111.600-111.450.
USD Edges Up As Stabilization Signs Are Awaited
The USD edged higher against a number of its counterparts in expectance of more signs for a stabilization of the global economy. Markets seem to be focusing on European and Chinese data for more evidence that the worst is over. Chinese trade data last week showed some stabilization and the GDP growth rate is expected to weigh on investor’s sentiment tomorrow. Trade issues were also in focus as the US-Japanese talks began, with Japanese minister Toshimitsu Motegi and US trade representative Lighthizer. On other news, US officials once again have expressed their optimism for a possible trade deal between the US and China. We tend to focus on the financial releases today and during tomorrows Asian session for more clues about market sentiment. EUR/USD dropped during today’s Asian session continuously testing the 1.1300 (S1) support line. We could see the pair rise somewhat today, should today’s financial releases strengthen the EUR side of the pair. Should the pair’s long positions be favored by the market, we could see the pair aiming if not breaking the 1.1340 (R1) resistance line. Should on the other hand the pair come under the selling interest of the market, we could see the pair breaking the 1.1300 (S1) support line and aim for the 1.1260 (S2) support level.
RBA’s dovish outlook weighs on the Aussie.
RBA’s meeting minutes were released during today’s Asian session and showed a dovish outlook which weighed on the AUD. The bank seems to believe that a rate cut would be appropriate should inflation remain low and unemployment trend higher. Analysts seem convinced that the bank is setting out the conditions for a rate cut, practically paving the way for a possible rate cut in August. Also the Aussie may have been weakened by RBA’s explanation of how cutting interest rates could help economy, especially the reference for a weak Aussie. We see the case for the Aussie to be data dependent, especially given the release of Australia’s employment data on Thursday. AUD/USD dropped during today’s Asian session as the Aussie weakened from the release of RBA’s meeting minutes, aiming for the 0.7120 (S1) support line. Should the bears continue to have the upper hand over the pair’s direction we could see it breaking the 0.7120 (S1) support line and aim for the 0.7065 (S2) support level. Should on the flip side the bulls take over, we could see the pair reversing direction, breaking the 0.7150 (R1) resistance line and aim for the 0.7245 (R2) resistance hurdle.
Other economic highlights, today and early tomorrow
In today’s European session, we get UK’s employment data for February and Germany’s ZEW economic Sentiment indicator for April. In the American session, from Canada we get the manufacturing sales growth rate for February. From the US we get the Industrial output growth rate and the API weekly crude oil inventories figure. During tomorrow’s Asian session New Zealand’s CPI rate for Q1, Japan’s trade data for March and China’s GDP growth rate for Q1, as well as the industrial output growth rate for March.
EUR/USD H4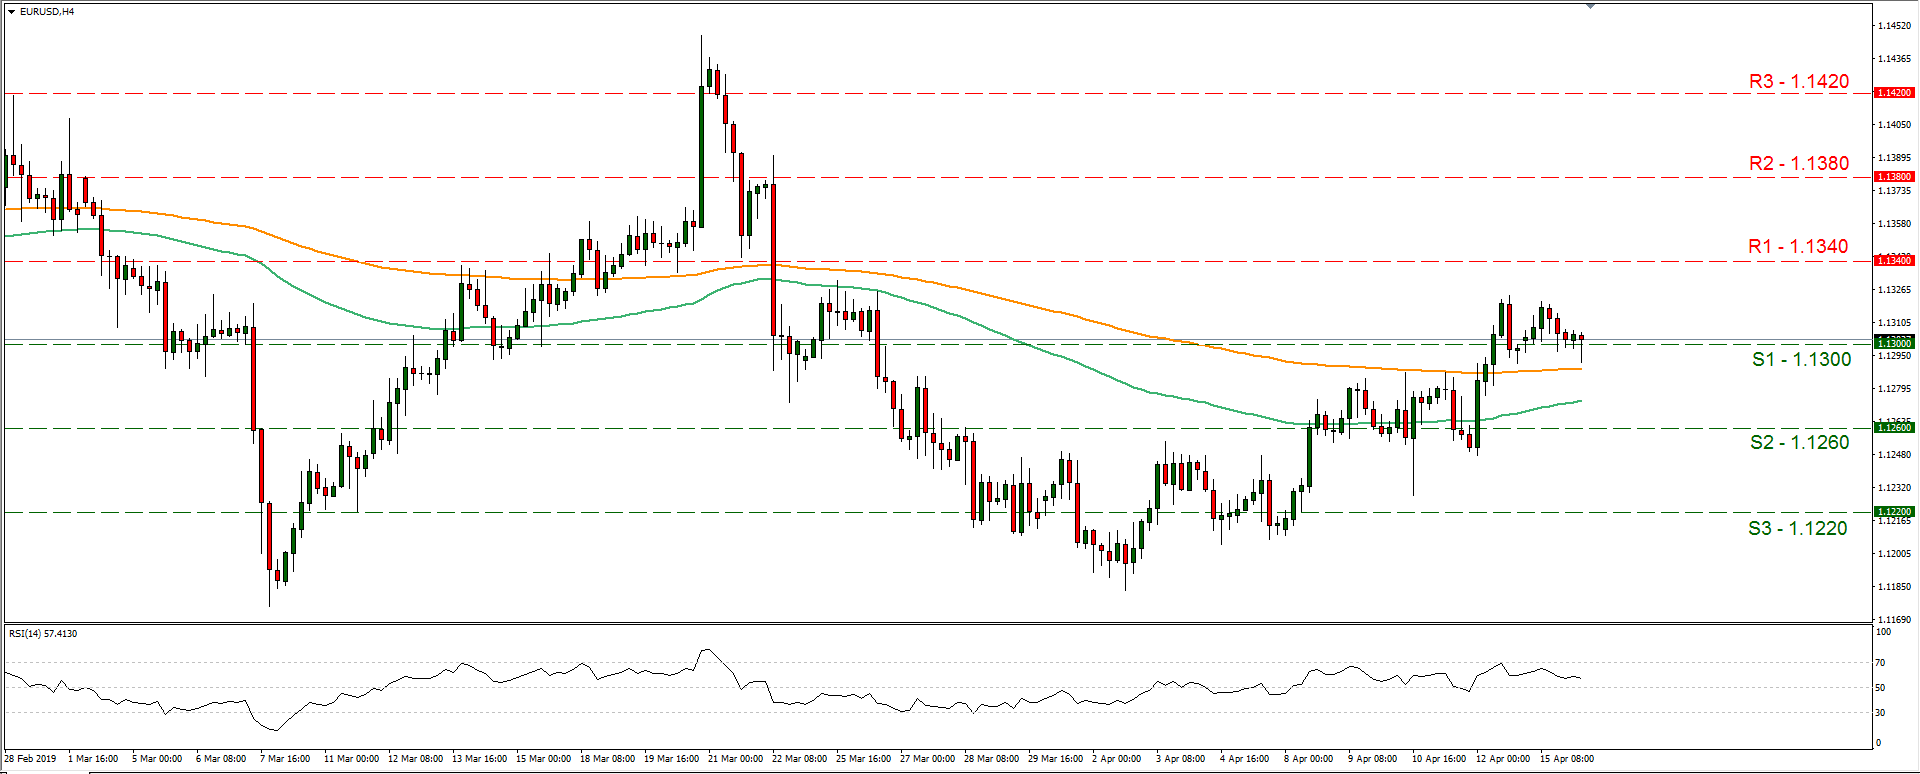
Support: 1.1300 (S1), 1.1260 (S2), 1.1220 (S3)
Resistance: 1.1340 (R1), 1.1380 (R2), 1.1420 (R3)
AUD/USD H4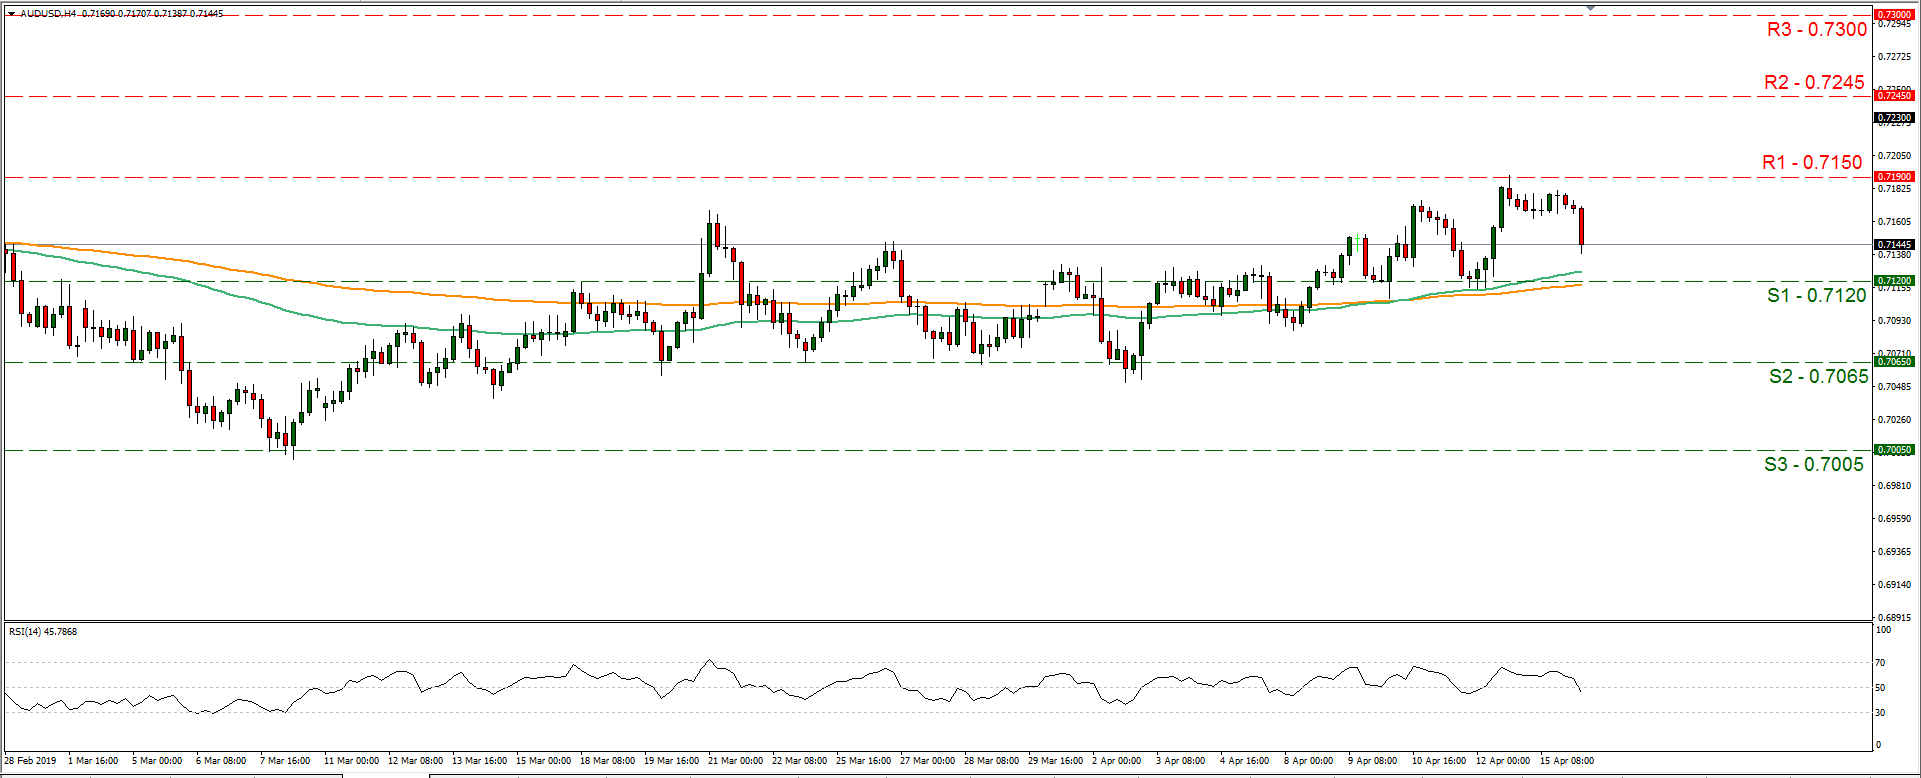
Support: 0.7120 (S1), 0.7065 (S2), 0.7005 (S3)
Resistance: 0.7150 (R1), 0.7245 (R2), 0.7300 (R3)
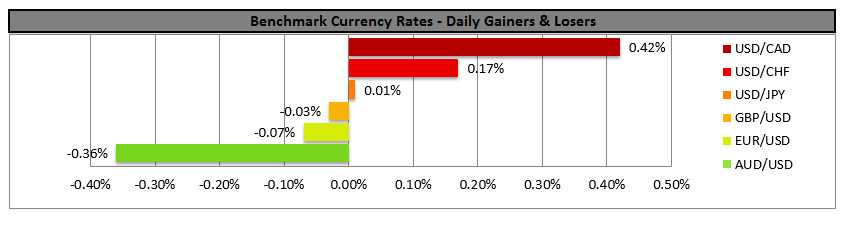
The US Dollar Is Still Under Pressure
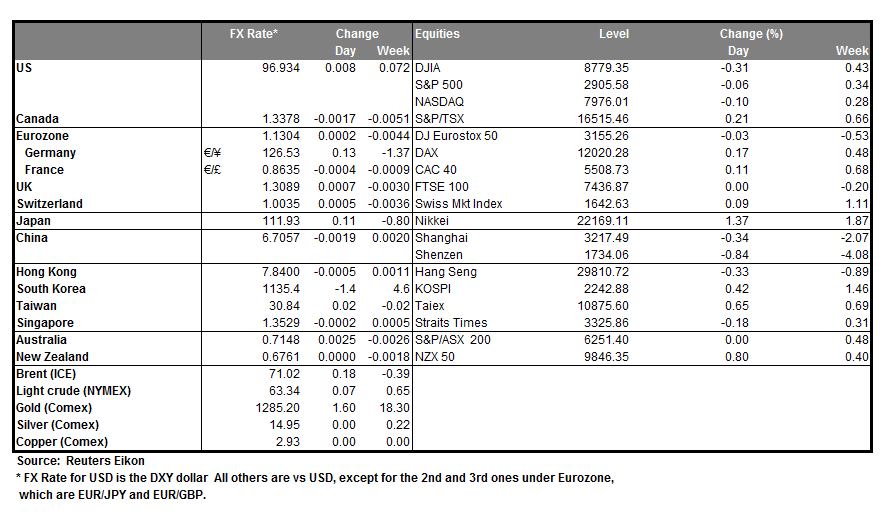
The US dollar shows multidirectional dynamics relative to the basket of major currencies. The pressure on the American currency is put by the statements of the US President regarding the Fed policy. So, Donald Trump believes that the US central bank slows down the economic growth of the country. He wrote in his Twitter: "If the Fed had done its job properly, which it has not, the Stock Market would have been up 5000 to 10,000 additional points, and GDP would have been well over 4% instead of 3%...with almost no inflation." The dollar index (#DX) closed the trading session with a slight decrease (-0.04%).
The Australian dollar weakened after the publication of the minutes of the RBA's monetary policy meeting. The regulator believes that lower interest rates would be "appropriate" if inflation remains low and the unemployment rate continues to rise. The British pound holds the mark of $1.31. British Prime Minister, Theresa May, announced that the country will prepare for a "tough" Brexit in October. However, the President of the European Council, Donald Tusk, urges not to hurry with hasty decisions, despite the fact that everyone is already exhausted because of the uncertainty around Brexit.
The "black gold" prices continue to fall. At the moment, the WTI crude oil futures are testing the mark of $63.20 per barrel. At 23:30 (GMT+3:00) a report on crude oil inventories according to the American Petroleum Institute will be published.
Market Indicators
- Yesterday, multidirectional dynamics was observed on the US stock market: #SPY (-0.07%), #DIA (-0.10%), #QQQ (+ 0.02%).
- The yield of 10-year US government bonds is at the level of 2.55-2.56%.
The news feed for 2019.04.16:
- Data on the labor market in the UK at 11:30 (GMT+3:00);
- The ZEW economic sentiment index in Germany at 12:00 (GMT+3:00);
- The industrial production volume in the United States at 16:15 (GMT+3:00).
German ZEW: Sentiments improved but current situation deteriorated considerably
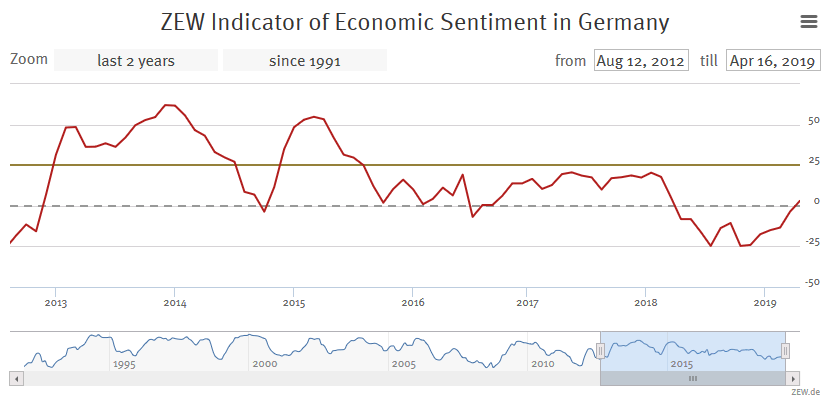
German ZEW Economic Sentiment improved to 3.1 in April, up from -3.6 and beat expectation of 0.5. Current Situation index, however, dropped to 5.5, down from 11.1 and missed expectation of 8.5. Eurozone ZEW Economic Sentiment Rose to 4.5, up from -2.5. Eurozone Current Situation index dropped -6.6 pts to 13.2.
ZEW President Professor Achim Wambach: "The slight improvement recorded by the ZEW Indicator of Economic Sentiment is largely based on the hope that the global economic environment will develop less poorly than previously assumed. The postponement of the Brexit deadline may also have contributed to buoy the economic outlook. By contrast, the latest figures regarding incoming orders and industrial production in the German industry point to a rather weak economic development."
EUR/USD weakens after the release.
New Zealand Q1 CPI Ahead For The Kiwi
The New Zealand dollar was knocked down in late March when the country’s central bank surprised markets by saying that the next move in interest rates will likely be down rather than neutral. The disappointment following the policy meeting and the lack of clarity about the future of the global economy allowed sellers to take control since then, with the spotlight turning now to NZD inflation to be delivered on Tuesday at 2245 GMT for any new rate signals.
According to forecasts, the headline Consumer Price Index (CPI) for the first quarter of 2019 is expected to have ticked up by 0.2 percentage points to 0.3% on a quarterly basis. Year-on-year however, the gauge is said to have eased to 1.7% after holding steady at 1.9% in the second half of 2018. Such an outcome could boost thoughts that a rate cut might be indeed seriously considered as soon as next month when policymakers gather again to decide on monetary strategy as only a CPI above the RBNZ’s 2.0% midpoint inflation goal would fairly justify higher borrowing costs.
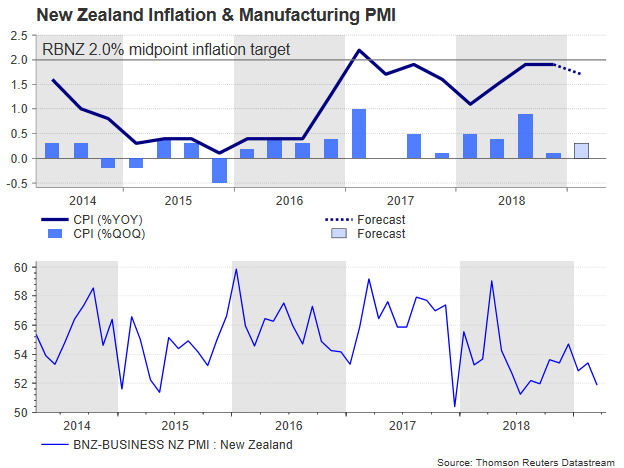
Weaker-than-expected manufacturing and services PMI data for the month of March released last week have already opened the window for a rate cut this year, with the overnight indexed swaps displaying a 27% chance for a 0.25 bps rate reduction in May and almost 80% by November. But a Bloomberg interview with the RBNZ governor Adrian Orr on Thursday brought some confusion to markets after the head of the central bank questioned whether a rate cut is appropriate in May, fueling speculation that policymakers may decide to wait a little longer before taking any action.
Renewed optimism that the US-Sino trade talks are approaching a final lap, and upbeat exports and bank loan data out of China have also forced investors to rethink their rate views this week. A potential solution to trade issues and a sustainable growth recovery in China would brighten the economic outlook for the kiwi economy that is heavily dependent on resource mining and commodity activities, but a domestic rebound would undoubtedly be more precious for the local currency. Hence, while nothing is certain in the outside world yet, investors will closely follow CPI readings this week to predict the RBNZ’s next move.
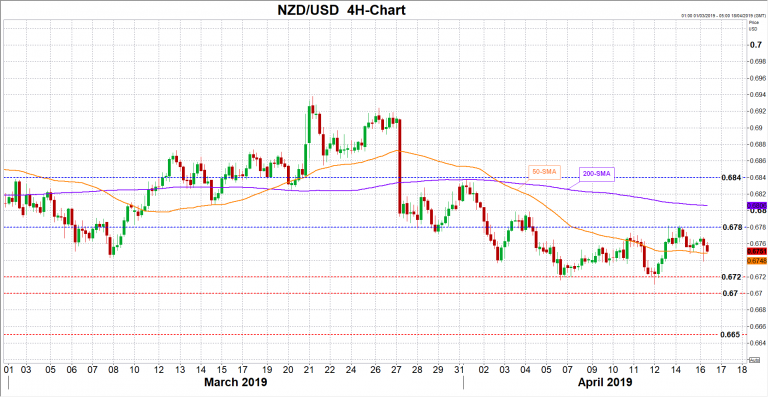
The market reaction could be negative if inflation numbers miss forecasts, with kiwi/dollar probably correcting lower towards 0.6720. Further down, the bears may test the 0.67 handle before meeting support near 0.6650.
In the alternative scenario, a stronger inflation number could help the pair to reach its previous highs around 0.6780, while a bigger surprise may also open the door for the 200-period SIMPLE moving average (SMA) currently at 0.6800. In case of steeper increases resistance could also stretch towards the 0.6840 mark.
Chinese GDP growth figures released a few hours after New Zealand’s inlflation readings could also impact the market.