Sample Category Title
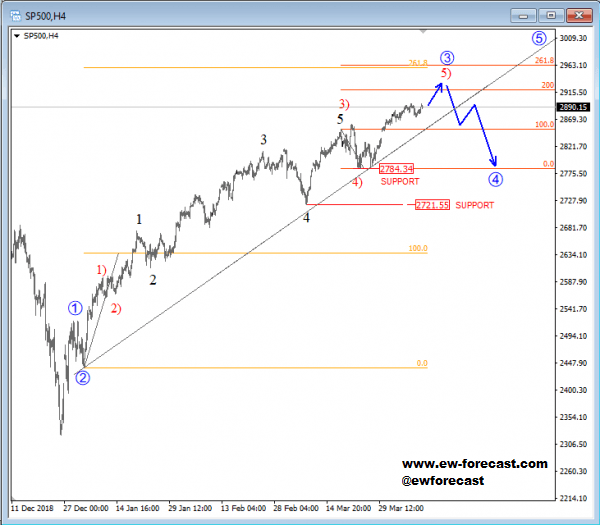
Elliott Wave Analysis: S&P500 At The Highs
S&P500 is at the highs, so stocks are obviously very strong, however we still expect to see a three-wave pullback to develop from current highs in the near future. We are currently observing a five-wave recovery within higher degree wave 3, with possible resistance and turning point being seen around the 2930/2970 area. There we see various Fibonacci ratios, from 200.0 to 261.8, which can react as resistance for the stock market. That being said, after sub-wave 5) of three fully develops, that is when a temporary pullback as wave four with support around 2784/2721 may follow.
S&P500, 4h
Oil Loses Momentum Just After Breaking Resistance
Markets mixed as key events pass without drama
Another mixed session looks on the cards on Thursday, very much continuing the trend this week as we move passed what could have been a volatile Wednesday unscathed and look ahead to a relatively calm end to the week.
Investors and businesses I’m sure will be relieved to learn that no-deal Brexit has been avoided on Friday, while the rest of us are left wondering why we potentially have another six months of this nonsense. The extension has done nothing for the pound which priced this in a long time ago and remains towards the lower end of its trading range. In the absence of a Brexit deal and with the economy underperforming, facing another six months of uncertainty and maybe no rate hike as a result, the bullish case for sterling near-term may have significantly diminished.
Oil loses momentum just after breaking resistance
A second large inventory build in two weeks, reported by EIA on Wednesday, has seen the oil rally stutter just as it was getting going. A break through an important resistance zone last week looked to have been the catalyst for another pop higher in WTI, with the price having jumped from around $63 to $65 in just a couple of days but already we’re seeing consolidation around these levels and momentum appears to have waned.
The rise in inventories accompanied new economic projections by the IMF which highlighted slowing growth around the world and numerous risks to the economy. Reports that Russia may be contemplating raising production and refusing to partake in OPEC+ cuts beyond the current June deadline may also have contributed to oil quickly losing its appeal. There remains numerous supportive factors for oil prices though, with clashes in Libya drawing much attention despite current production being uninterrupted. Above $65, the $66-68 has previously been a major area of support and resistance so we may not have to wait long for the rally to once again run into difficulty, if of course it finds its mojo again.
$1,280 vulnerable if gold fails to break March peak
We’re seeing some profit taking in gold early in the day on Thursday, with the yellow metal coming on the back of four winning days in the last five. That’s an impressive run of form considering only a week ago we were seeing $1,280 – which is increasingly becoming an important support area – being tested by sellers only for it to be successfully defended once again.
Gold bulls should put the celebrations on hold though because we’ve now fallen short of the previous peak for a second time since it topped out in mid-February. That’s not to say we won’t see another run at it in the coming sessions but a failure to break through the March peak – around $1,325 – may reinvigorate the sellers and see $1,280 quickly come under pressure again. Of course, the dollar could have a key role to play and at the moment it is trading close to multi-month highs. A break higher could put $1,280 under considerable pressure.
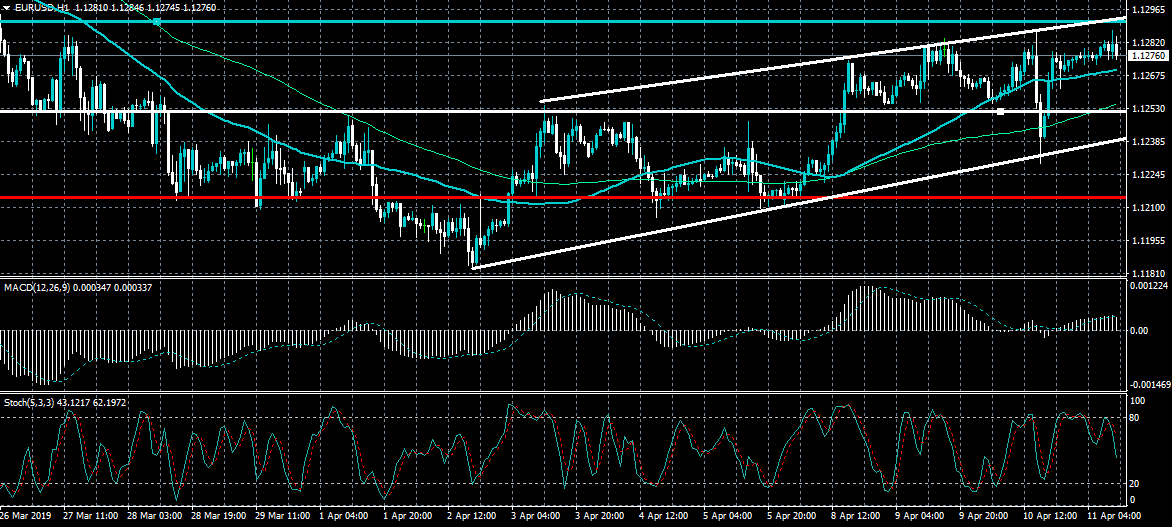
EURUSD Trapped Inside Bear Flag
The euro continues to struggle with major weekly resistance against the US dollar with bulls so far failing to move the pair above the 1.1290 level. The one-hour time frame is showing that the EURUSD is trapped inside a bear flag pattern, with trendline resistance located close to the 1.1290 level. Key technical support from the flag pattern is currently located around the 1.1240 level
The EURUSD pair is only bullish while trading above the 1.1250 level, key technical resistance is found at the 1.1290 and 1.1350 levels.
If the EURUSD pair trades below 1.1250 level, key intraday support is found at the 1.1216 and 1.1170 resistance levels.
GBPUSD Technically Weak
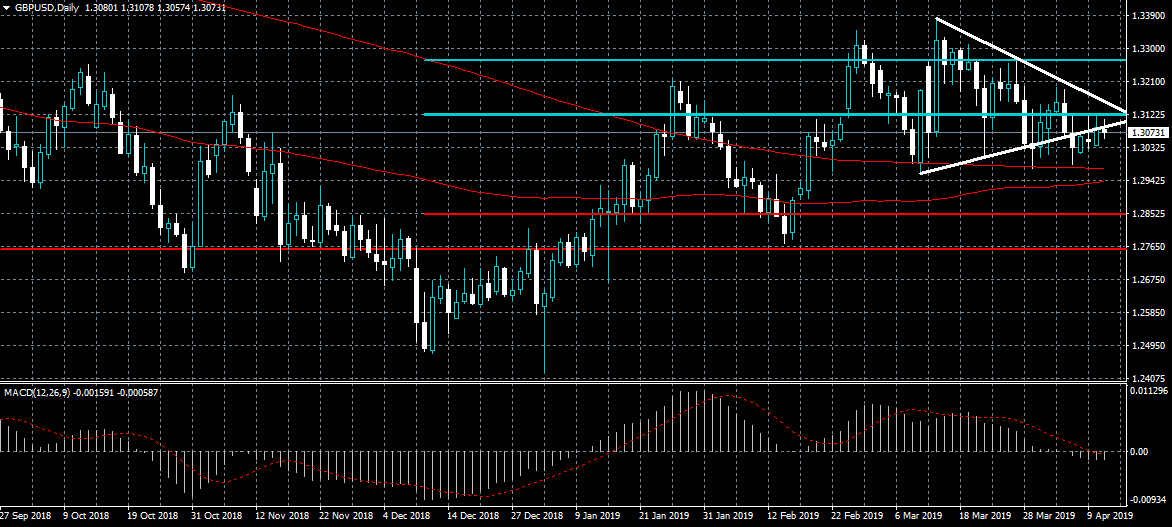
The British pound is starting to slip below the 1.3100 level against the US dollar as trader remain unimpressed with the latest Brexit deadline extension. The GBPUSD pair is technically weak while trading below the 1.3100 level and could fall towards the 1.2980 level. The MACD indicator on the four-hour time frame is also trending lower as selling pressures start to build.
The GBPUSD pair is only bullish while trading above the 1.3100 level, key intraday resistance is found at the 1.3125 and 1.3265 levels.
If the GBPUSD pair trades under the 1.3100 level, key intraday support is found at the 1.3030 and 1.2980 levels.
EUR/USD – Euro Remains Subdued As German CPI Matches Forecast
EUR/USD is almost unchanged in the Thursday session. Currently, the pair is trading at 1.1276, up 0.02% on the day. On the release front, German Final CPI remained steady, with a gain of 0.4%. This matched the forecast. The U.S. will release producer price index reports. PPI is expected to rise to 0.3% and Core PPI is forecast to improve to 0.2%. Unemployment claims is projected to rise to 210 thousand.
The ECB is expected to hold interest rate levels and will release a policy statement. The U.S. releases key inflation data. CPI is expected to improve to 0.3% and Core CPI is projected to climb to 0.2%. As well, the FOMC releases the minutes of the March policy meeting. On Thursday, the focus will be on inflation. Germany posts CPI and the U.S. releases PPI. On Friday, the eurozone releases industrial production, while the U.S. posts UoM consumer sentiment and the semi-annual Treasury currency report.
There were no surprises from the ECB policy meeting, and the euro responded with limited movement. The bank held the minimum bid rate at 0.00%, where it has been pegged since 2016. Investors were more interested in Mario Draghi’s comments after the rate decision. Draghi acknowledged that eurozone economic data remains weak, particularly in the manufacturing sector. The economic outlook remains weak, with Draghi saying that “slower growth momentum is expected to extend into the current year”. At the same time, Draghi said that the likelihood of a recession remains low. On the inflation front, Draghi stated that interest rates will remain at current levels at least until the end of 2019 and possibly later.
The Federal Reserve was also in focus on Wednesday, with the release of the minutes from the March meeting. The Fed left the door open to rate hikes in 2019, provided that economic conditions improved. Some members said that they expected the economy to improve, while others said that rate movement could shift “in either direction based on incoming data and other developments”.
USD/JPY Outlook: Pullback Shows Initial Signs Of Stall Above Massive Rising Daily Cloud
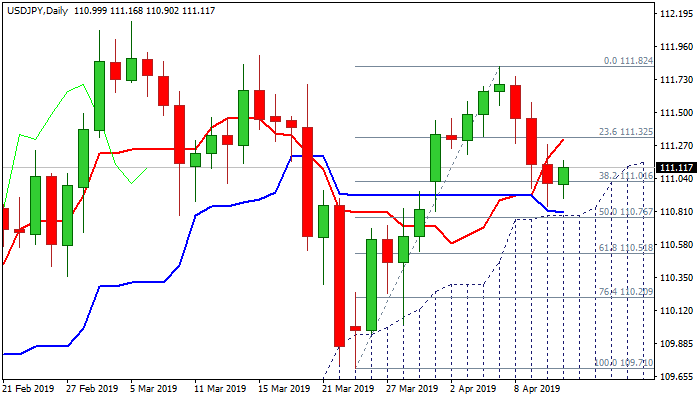
The pair bounces from correction low at 110.84, where three-day fall found support.
Pullback from 111.82 high showed signs of stall just ahead of daily cloud top, as massive cloud continues to strongly underpin the action, signaling limited correction.
Wednesday’s action failed to close below pivotal Fibo support at 111.01 (61.8% of 109.71/111.82), which adds to signs that corrective action has bottomed.
Strong bullish momentum and flat stochastic at oversold zone border on daily chart support the notion.
The dollar showed limited reaction on Fed minutes, released on Wednesday, as US central bank signaled that will remain on pause for the rest of the year.
Some of US policymakers support the idea of possible rate hike in certain circumstances, but some pointed to scenario that interest rate could shift in either direction, according to the situation.
Further advance and strong bullish close today would generate initial signal of reversal, however, such scenario would require confirmation on return above 200SMA (111.49).
On the other side, strong bearish signal could be expected on penetration of thick daily cloud.
Res: 111.19, 111.30, 111.49, 111.82
Sup: 111.01, 110.84, 110.74, 110.51
USD/JPY Tests Short-Term Channel
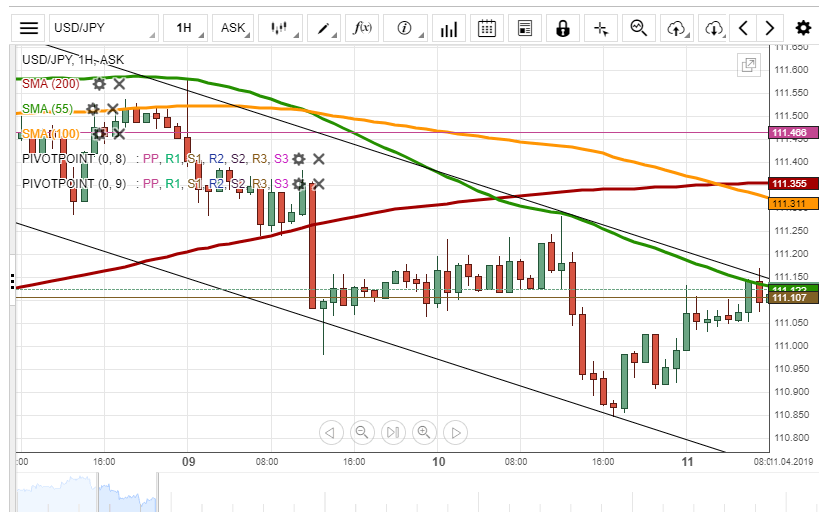
During Wednesday's trading session, the USD/JPY currency pair continued to trade within the short-term descending channel.
From a technical perspective, it is likely that the pair reverses south from the upper channel line and continues to decline. However, the exchange rate has to surpass the monthly PP at 110.91.
If the given channel does not hold, a breakout north might occur in the nearest future. A possible upside target is the resistance level formed by the 100– and 200-hour SMAs located circa 111.35.
USD/CAD Breaches 100– And 200-Hour SMAs
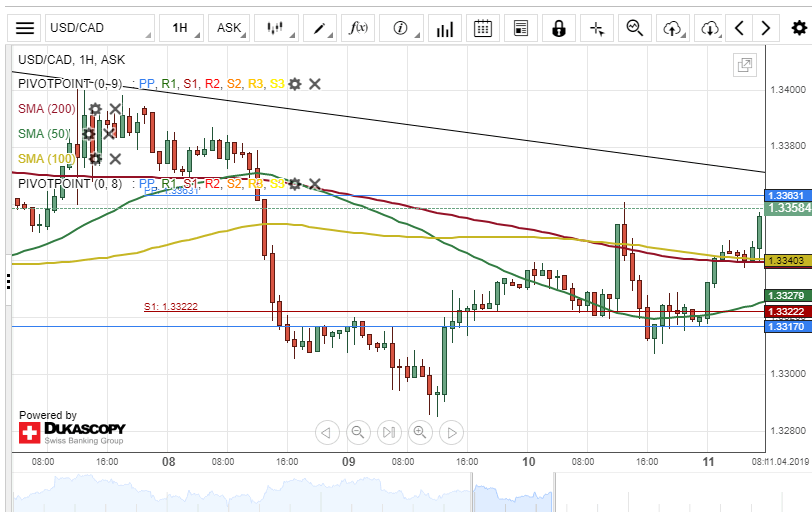
The US Dollar depreciated about 50 base points against the Canadian Dollar on Wednesday. The decline was stopped by a support cluster formed by the combination of the weekly and the monthly pivot points at 1.3322.
Thursday's trading session began with bullish sentiment, and by the middle of the day, the currency pair has breached both the 100– and 200-hour SMAs at 1.3340.
As for the near future, it is likely the USD/CAD currency exchange rate will aim for the upper boundary of an ascending channel pattern at 1.3363 during the following trading session.
XAU/USD Supported By 55-Hour SMA
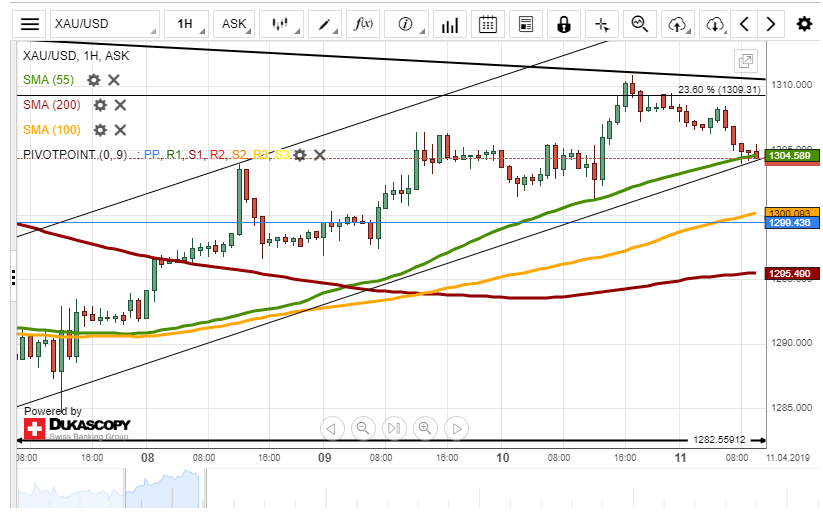
Yesterday, the price for gold reached the resistance level formed by the Fibonacci 23.60% retracement at 1,309.31.
If the support formed by the 55-hour SMA at 1,304,49 holds, it is likely that the XAU/USD reaches the upper boundary of the descending triangle pattern located circa 1,311.00 and reverses south.
Otherwise, it is expected, that some bearish momentum prevails in the market, and the price for gold declines to the support level formed by the monthly PP and the 100-hour SMA at 1,299,44.
NZD/USD Reveals New Pattern
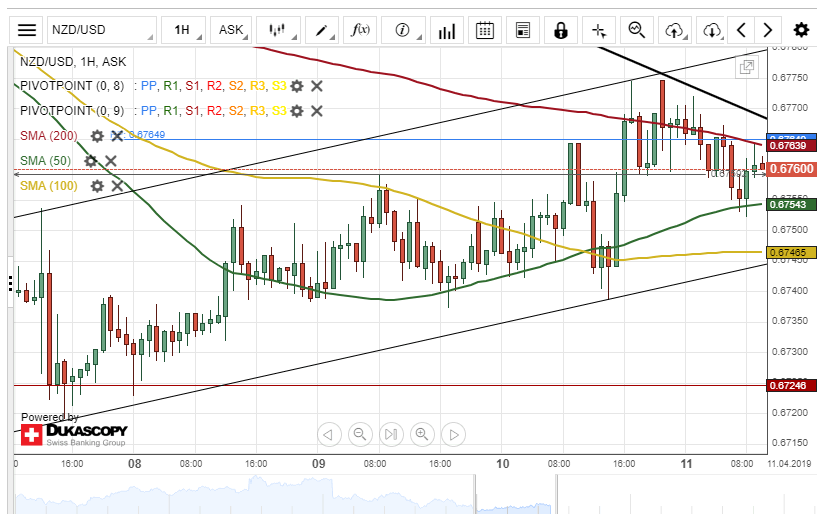
The New Zealand Dollar has revealed a new junior ascending channel pattern against the US Dollar. The channel pattern guided the currency pair towards the upper boundary of a dominant descending channel at 0.6774 on Wednesday.
As for the near future, it is likely that the NZD USD exchange rate will continue to maintain the junior ascending channel pattern.
Meanwhile, technical indicators flash sell signals on the daily time frame chart. Therefore, the currency exchange rate could aim for the lower boundary of the channel pattern at 0.6746 within this session.