Sample Category Title
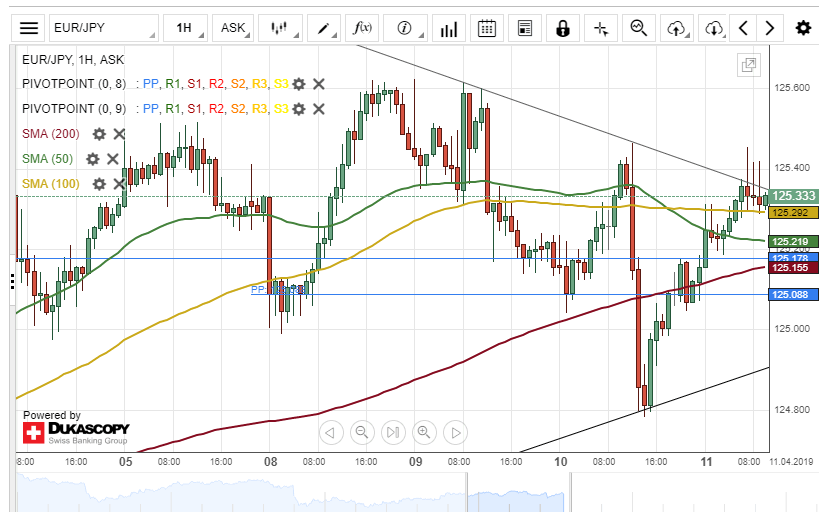
EUR/JPY Bullish Momentum Today
The price movement of the single European currency versus the Japanese Yen was guided by a downside sentiment during Wednesday's trading session. The currency pair declined by about 68 base points on Wednesday.
The exchange rate breached the 50– and 100-hour SMAs during the first half of today's trading session.
Everything being equal, it is likely that the EUR/JPY currency pair will aim for a swing high of 125.73 during the following trading session.
However, technical indicators demonstrate that the currency exchange rate could edge lower today.
AUD/USD Moving Towards 50-Hour SMA
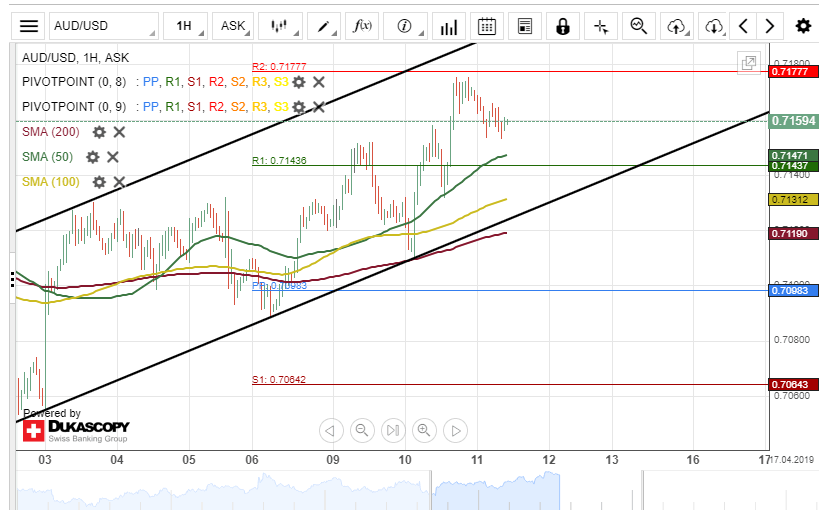
The Australian Dollar bounced off a support cluster formed by the lower boundary of an ascending channel pattern and 200-hour simple moving average at 0.7111 during Wednesday's trading session.
Most likely, the currency exchange rate could edge lower towards a support level at 0.7143 within this session.
If the support line as mentioned above holds, the AUD/USD currency pair will continue its upside movement today.
However, if the pair passes the support line, a potential breakout through the lower boundary of an ascending channel pattern might occur.
EUR/USD Could Reach 1.300 Mark
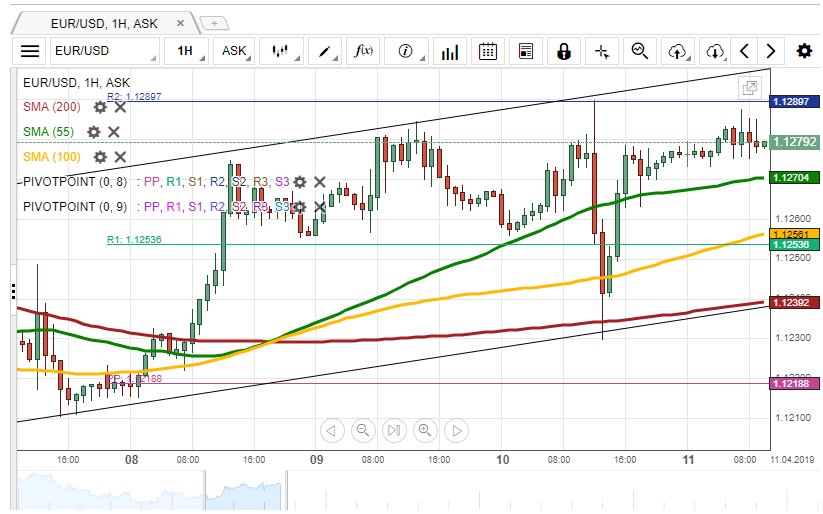
Yesterday, the EUR/USD currency pair re-tested the lower boundary of the short-term ascending channel at 1.1232 and jumped to the resistance level—the monthly PP at 1.1281.
If the given resistance level holds, most likely, the exchange rate steps lower to the support level formed by a combination of the weekly R1 and the 100-hour SMA at the 1.1254 mark.
On the other hand, the pair could use the support of the 55-hour SMA at 1.1269 and breach the given resistance. Also, today's the US PPI data release on 12:30 GMT could push the Euro to appreciate against the US Dollar to the upper channel line at 1.1300.
GBP/USD Likely To Trade Sideways
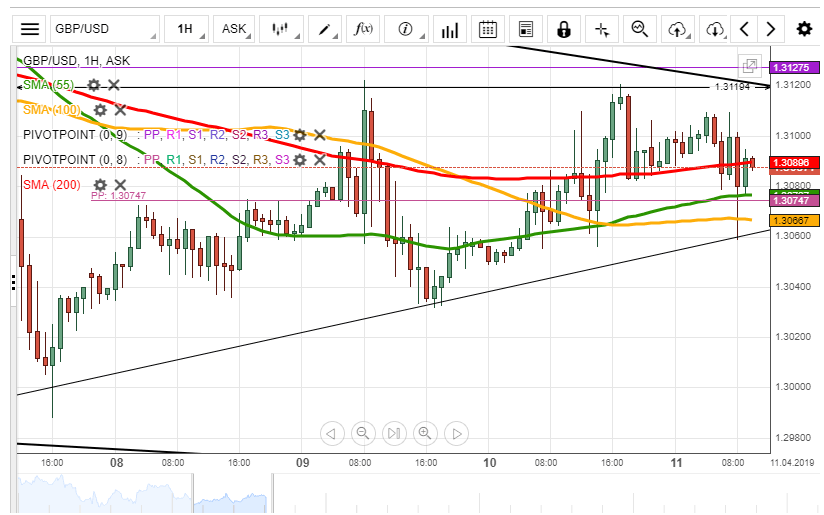
As apparent on the chart, on Wednesday, the GBP/USD exchange rate tried to surpass the resistance line located at 1.3119.
Given, that the rate is supported by the 55-, 100– and 200-hour SMAs, currently located in the 1.3067/1.3089 range, it is expected, that rate trades sideways between the weekly PP at 1.3075 and the given resistance line.
If the given support cluster does not hold, it is likely, that some downside potential prevails in the market, and currency pair tries to surpass the psychological level at the 1.3040 mark.
Forex Technical Analysis: EUR/USD, USD/JPY, GBP/USD
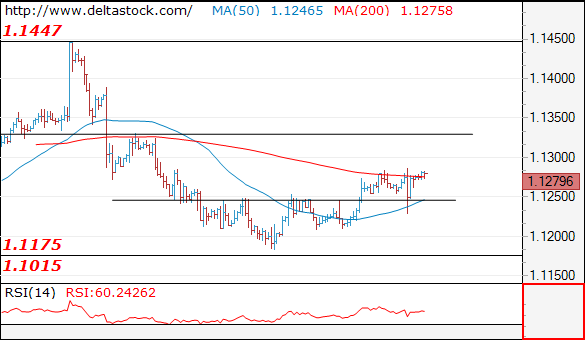
EUR/USD
Current level - 1.1279
My outlook is positive, for a rise towards 1.1330 area. Crucial on the downside is 1.1225 low.
| Resistance | Support | ||
| intraday | intraweek | intraday | intraweek |
| 1.1330 | 1.1570 | 1.1225 | 1.1175 |
| 1.1330 | 1.1830 | 1.1175 | 1.0860 |
USD/JPY
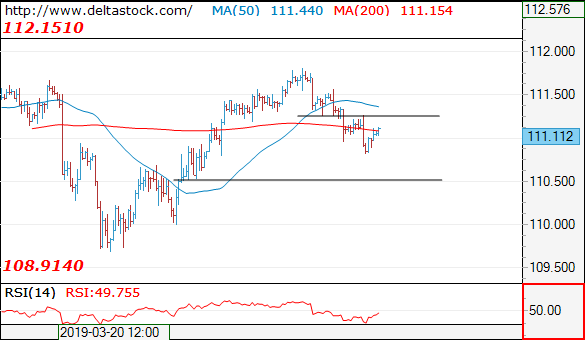
Current level - 111.11
There are no signs of a reversal with the recent low at 110.80 and the bias remains negative, for a dip to 110.50. crucial on the upside is 111.25.
| Resistance | Support | ||
| intraday | intraweek | intraday | intraweek |
| 111.25 | 113.00 | 110.50 | 108.90 |
| 112.15 | 114.50 | 110.50 | 107.40 |
GBP/USD
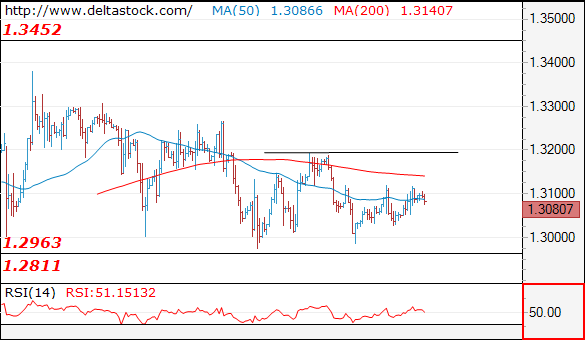
Current level - 1.3080
Intraday allow a brief spike above 1.3120, towards 1.3200 resistance area. If that test fails, another dip to 1.2960 major support should be expected.
| Resistance | Support | ||
| intraday | intraweek | intraday | intraweek |
| 1.3120 | 1.3450 | 1.2960 | 1.2820 |
| 1.3200 | 1.3450 | 1.2960 | 1.2610 |
First Signs Of Stimulus Emerge In China
The ECB monetary policy meeting followed by Fed Minutes left investors rather confused as to where both economies are heading. One sure thing is that both monetary authorities have clearly signaled that it is premature to take further decisions on the forward guidance for the time being, thus pushing investors towards further caution. Yet encouraging news are arising from the second largest economy, whose government’s effort to boost domestic demand is finally taking effect.
Not only did China’s factory activity expand, but consumer inflation also showed good improvement in March. The uptick of Manufacturing PMI back into expansion territory, its highest range in 8 months as well as accelerating producer prices to 0.40% (prior: 0.10%) from last year are good signs that stimulus measures are helping. Although 5-months high headline CPI at 2.30% (consensus: 1.50%) does not necessarily provide sufficient proof of rise due to a major bias in inflated pork prices (i.e. supply shortage due to African swine fever), the non-food metric is also showing decent improvements, bouncing by 10 bps at 1.80% after having flattened in the past 3 months. Although the latest results are to be taken with a tweezers and need to be monitored in the coming months, it appears that the Chinese economy is most likely recovering. Aside of Beijing’s plan to increase infrastructure spending, a reduction of corporate tax of 2 trillion yuan ($297.8 billion) and an effective VAT tax cut of 3 percentage points for manufacturing firms, Sino-American trade talks appear to go on the right direction and on the verge of signing a final agreement on the implementation of an enforcement mechanism.
USD/CNY sideways trading since end-February 2019 along the range of 6.7115 is expected to sustain until sizable events emerge.
The Analytical Overview Of The Main Currency Pairs
The EUR/USD currency pair
Technical indicators of the currency pair:
Prev Open: 1.12615
Open: 1.12732
% chg. over the last day: +0.11
Day's range: 1.12713 – 1.12874
52 wk range: 1.1214 – 1.2557
Yesterday had a lot of important macroeconomical events and EUR/USD was traded very actively. There was o single defined trend, however. The ECB kept the monetary policy, as was expected. Mario Draghi mentioned the growing risks in the EU economy but elected to keep the interest rates until the end of the year. The FOMC Minutes confirmed the dowish position of Federal Reserve. The basis consumer index of the US customer prices was 0.1%, which is lower than expected 0.2%.
The key support and resistance levels are 1.12650 and 1.12850. The quotes can grow further. Today you should evaluate all the reports coming from the US and open positions from the key levels.
The Economic News Feed for 11.04.2019:
Number of Unemployment Benefits Applications (US) – 15:30 (GMT+3:00);
Manufacturer's Price Index (US) – 15:30 (GMT+3:00);
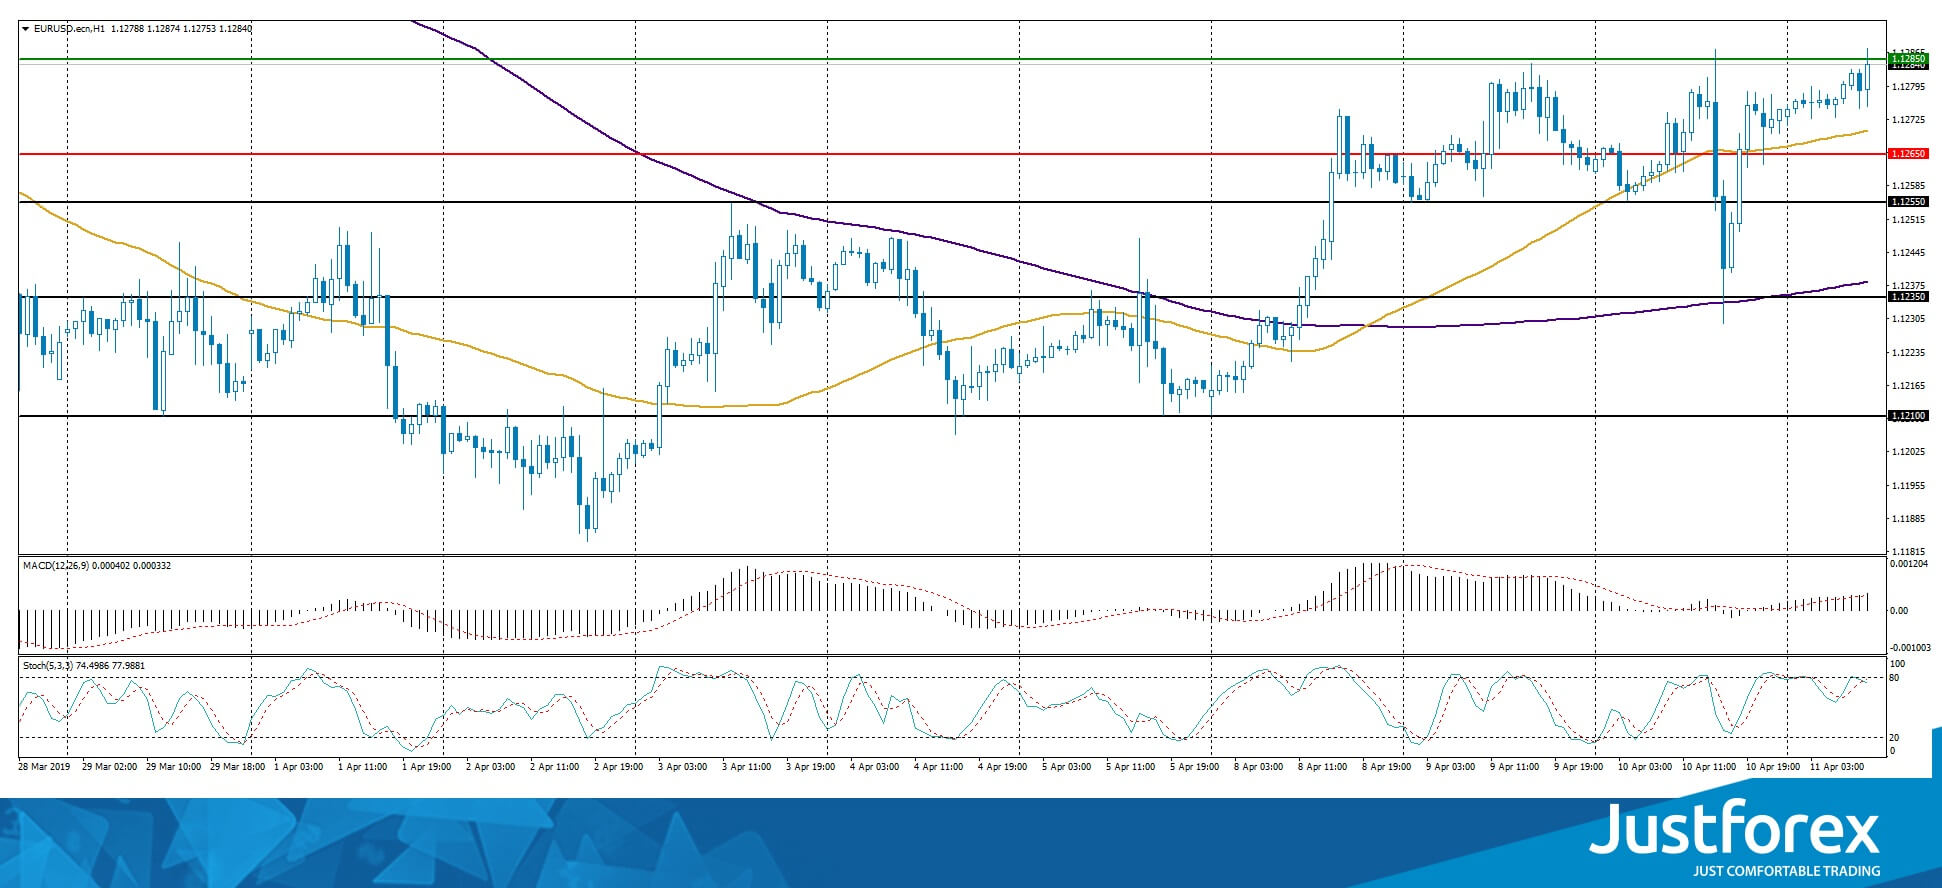
The price fixed above 50 MA and 200 MA which points to the power of the buyers.
The MACD histogram is in the positive zone and keeps rising which points to further growth of EUR/CAD.
The Stochastic Oscillator is near the overbought zone, the %K line is crossing the %D line. There are no signals.
Trading recommendations
Support levels: 1.12650, 1.12550, 1.12350
Resistance levels: 1.12850, 1.13000, 1.13400
If the price fixes above 1.12850, expect the quotes to rise toward 1.13250-1.13500.
Alternatively, the quotes can descend toward 1.12500-1.12350.
The GBP/USD currency pair
Technical indicators of the currency pair:
Prev Open: 1.30474
Open: 1.30828
% chg. over the last day: +0.27
Day's range: 1.30778 – 1.31089
52 wk range: 1.2438 – 1.4378
GBP/USD was in a bullish mood yesterday. The EU leaders agreed to postpone Brexit for 12 months. GBP is additionally supported by the positive GDP results and the growing industrial production volume. Right now the quotes are consolidating at 1.30750-1.31200. You should open positions from these levels, the pair is likely to grow further.
The Economic News Feed for 11.04.2019 is calm.
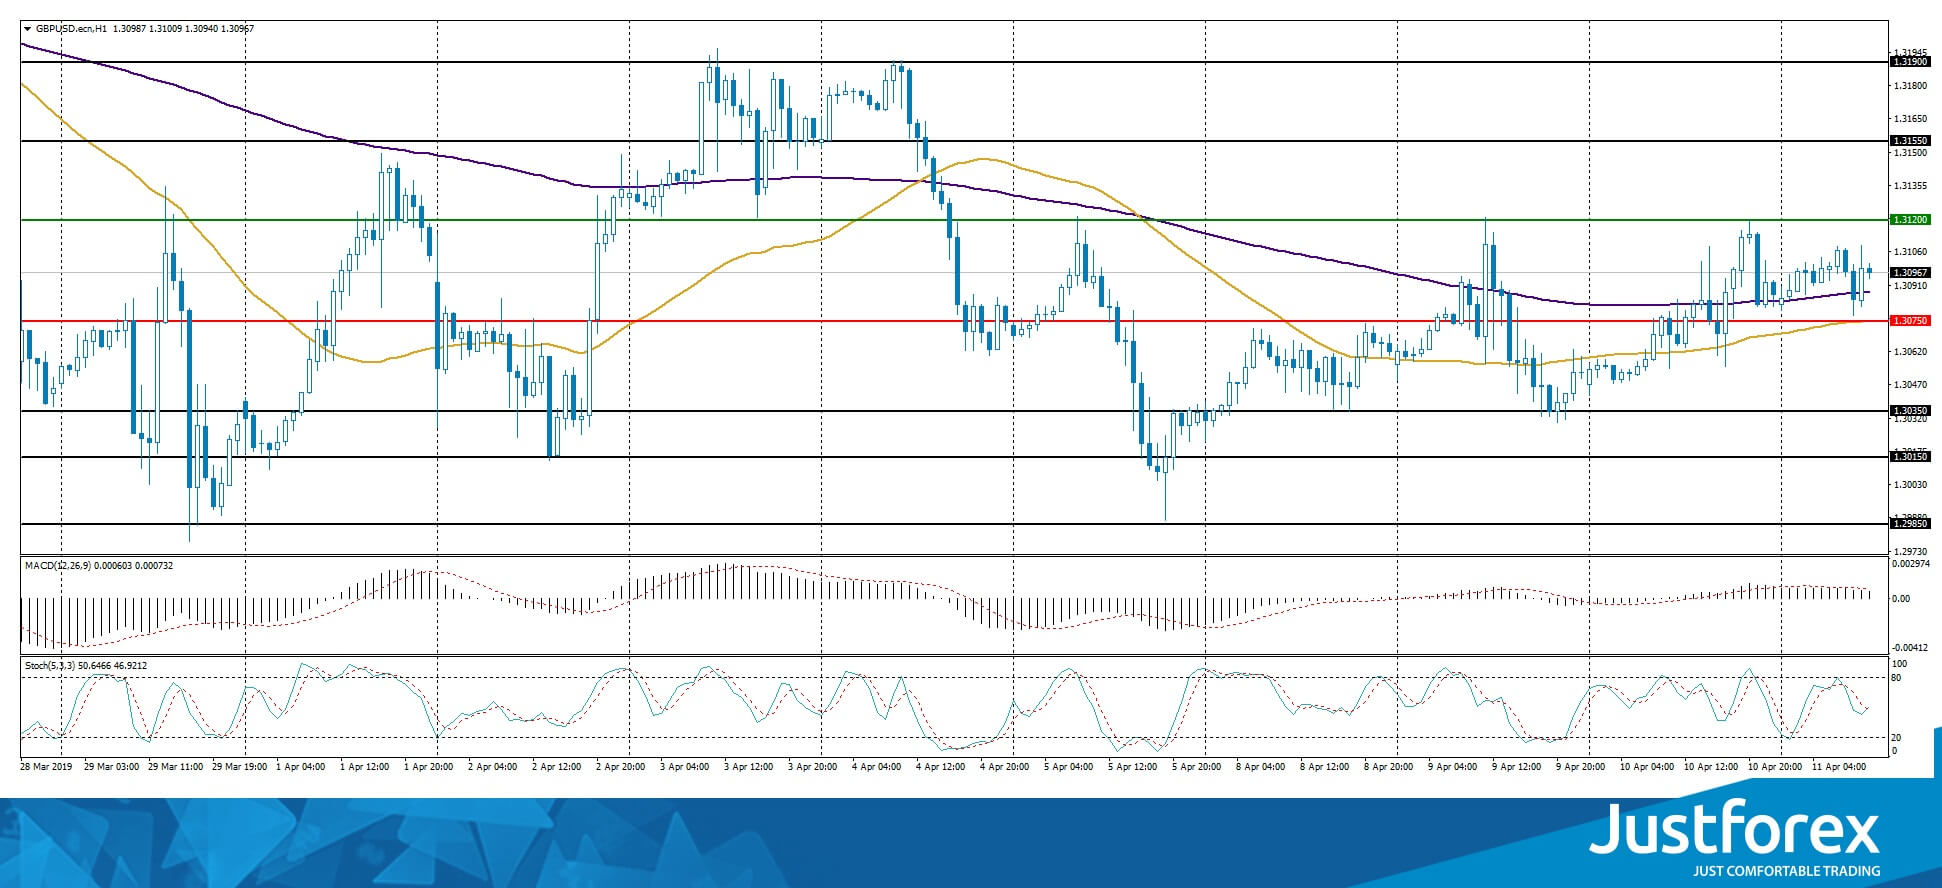
The indicators do not provide precise signals, the price has crossed 50 MA and 200 MA.
The MACD histogram is in the positive zone but below the signal line, which gives a weak signal to buy GBP/USD.
The Stochastic Oscillator is in the neutral zone, the %K line is crossing the %D line. There are no signals at the moment.
Trading recommendations
Support levels: 1.30750, 1.30350, 1.30150
Resistance levels: 1.31200, 1.31550, 1.31900
If the price fixes above 1.31200, expect the quotes to rise toward 1.31500-1.31700.
Alternatively, the quotes can descend toward 1.30500-1.30300.
The USD/CAD currency pair
Technical indicators of the currency pair:
Prev Open: 1.33207
Open: 1.33107
% chg. over the last day: -0.06
Day's range: 1.33107 – 1.33564
52 wk range: 1.2248 – 1.3664
USD/CAD is being actively traded as of late. There is no single trend, but the key range is 1.33300-1.33600. You should open positions from these levels and wait for more releases from the US. Keep an eye on the oil quotes dynamics.
The Economic News Feed for 11.04.2019 is calm.
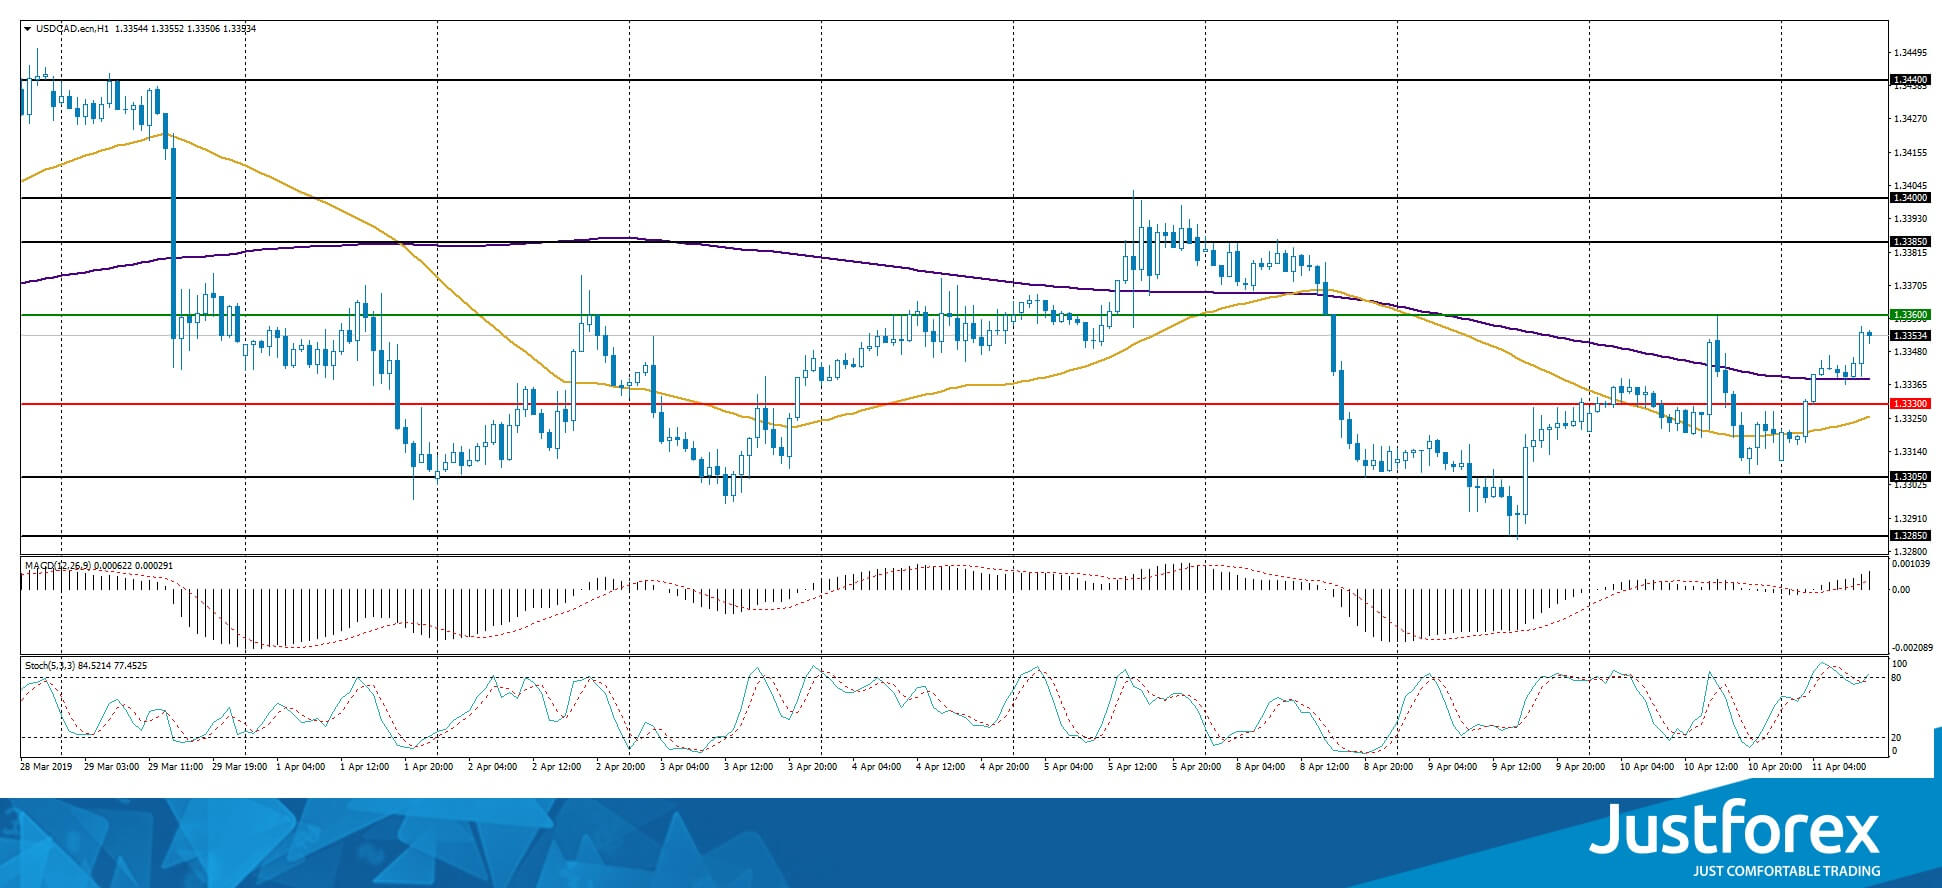
There are no signals, the price is consolidating close to 200 MA.
The MACD histogram is in the positive zone and above the signal line, which points to the bullish mood.
The Stochastic Oscillator is close to the overbought zone, the %K line is crossing the %D line. There are no signals at the moment.
Trading recommendations
Support levels: 1.33300, 1.33050, 1.32850
Resistance levels: 1.33600, 1.33850, 1.34000
If the price fixes above 1.33600, expect the quotes to grow toward 1.33850-1.34000.
Alternatively, the quotes can fall toward the round 1.33000.
The USD/JPY currency pair
Technical indicators of the currency pair:
Prev Open: 111.131
Open: 110.968
% chg. over the last day: -0.14
Day's range: 110.896 – 111.167
52 wk range: 104.56 – 114.56
USD/JPY has an ambiguous technical picture. The trading instrument is moving sideways. The local support and resistance levels are 111.000 and 111.200. The quotes can descend further. Keep an eye on the economic releases and the US Treasury Bond's yield. Open the positions from the key levels.
The Economic News Feed for 11.04.2019 is calm.
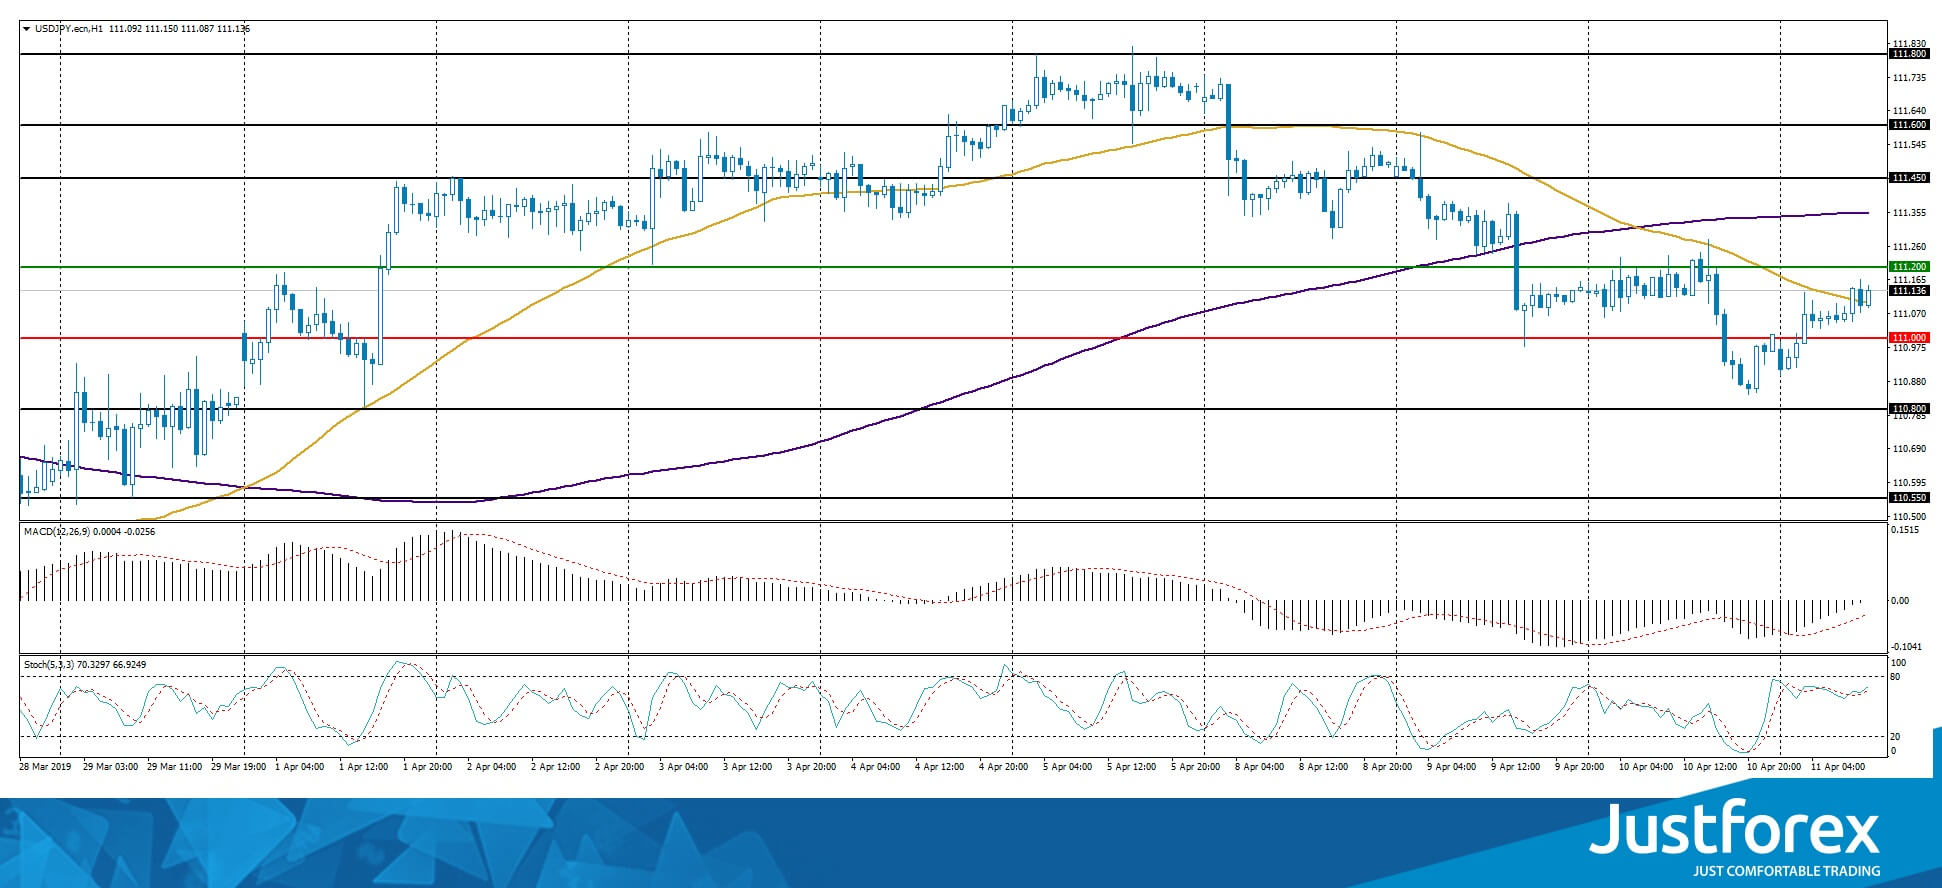
The indicators do not provide precise signals, the price has crossed 50 MA.
The MACD histogram is close to 0.
The Stochastic Oscillator is in the neutral zone, the %K line is crossing the %D line. There are no signals at the moment.
Trading recommendations
Support levels: 111.000, 110.800, 110.550
Resistance levels: 111.200, 111.450, 111.600
If the price fixes below 111.000, expect the quotes to fall toward 110.700-110.600.
Alternatively, the quotes can grow toward 111.450-111.600.
Investors Assess Important Macroeconomic Events
The US dollar is being traded without a clear dynamic after the release of the FOMC minutes. The FOMC minutes for March showed that the Fed would not adjust policy and planned to keep the key marks of monetary policy until the end of this year. However, some officials said they could change their views on the key interest rate. Although politicians noted that the US labor market looked strong, some of them said that the "deterioration" in the US economy could be intensified due to the large debt of American companies. They also noted a continuing weakness in the housing market. Yesterday, the dollar index (#DX) closed with a small minus (-0.05%).
Meanwhile, the US currency was supported by the news that the US and China were striving for progress in the negotiations on a possible trade agreement between the countries.
In particular, the Treasury Secretary Steven Mnuchin said that the parties agreed on a mechanism that would ensure the implementation and compliance of the trade agreement. The US claim China to implement significant reforms to end the theft of US intellectual property. Washington also wants Beijing to limit industrial subsidies, expand its markets for US companies and significantly increase purchases of US agricultural, energy and industrial products.
Financial market participants assess the results of the ECB meeting. So, the Central Bank left the key interest rates unchanged, as experts expected. The regulator announced it intended to keep interest rates at current levels until the end of 2019. The head of the Central Bank, Mario Draghi, is concerned about the growing risks in the Eurozone economy. The ECB will continue to reinvest the proceeds from the bonds purchased as part of the quantitative easing program to the fullest extent during the additional period after it starts raising interest rates.
The European Council agreed yesterday for a further extension of the Brexit deadline. The European Union extended the exit deadline until October 31, 2019. German Chancellor Angela Merkel insisted that the UK should not be expelled and leave the block without an agreement. The British pound was supported additionally by positive economic releases from the UK.
The "black gold" prices have become stable. Oil quotes are consolidating near annual highs. At the moment, futures for the WTI crude oil are testing the mark of $64.00 per barrel.
Market Indicators
- Yesterday, the bullish sentiment was observed in the US stock market: #SPY (+0.34%), #DIA (+0.03%), #QQQ (+0.54%).
- The 10-year US government bonds yield fell slightly. Currently, the figure is at the level of 2.48-2.49%.
The news feed for 2019.04.11:
- Initial jobless claims at 15:30 (GMT+3:00);
- Producer price index in the US at 15:30 (GMT+3:00).
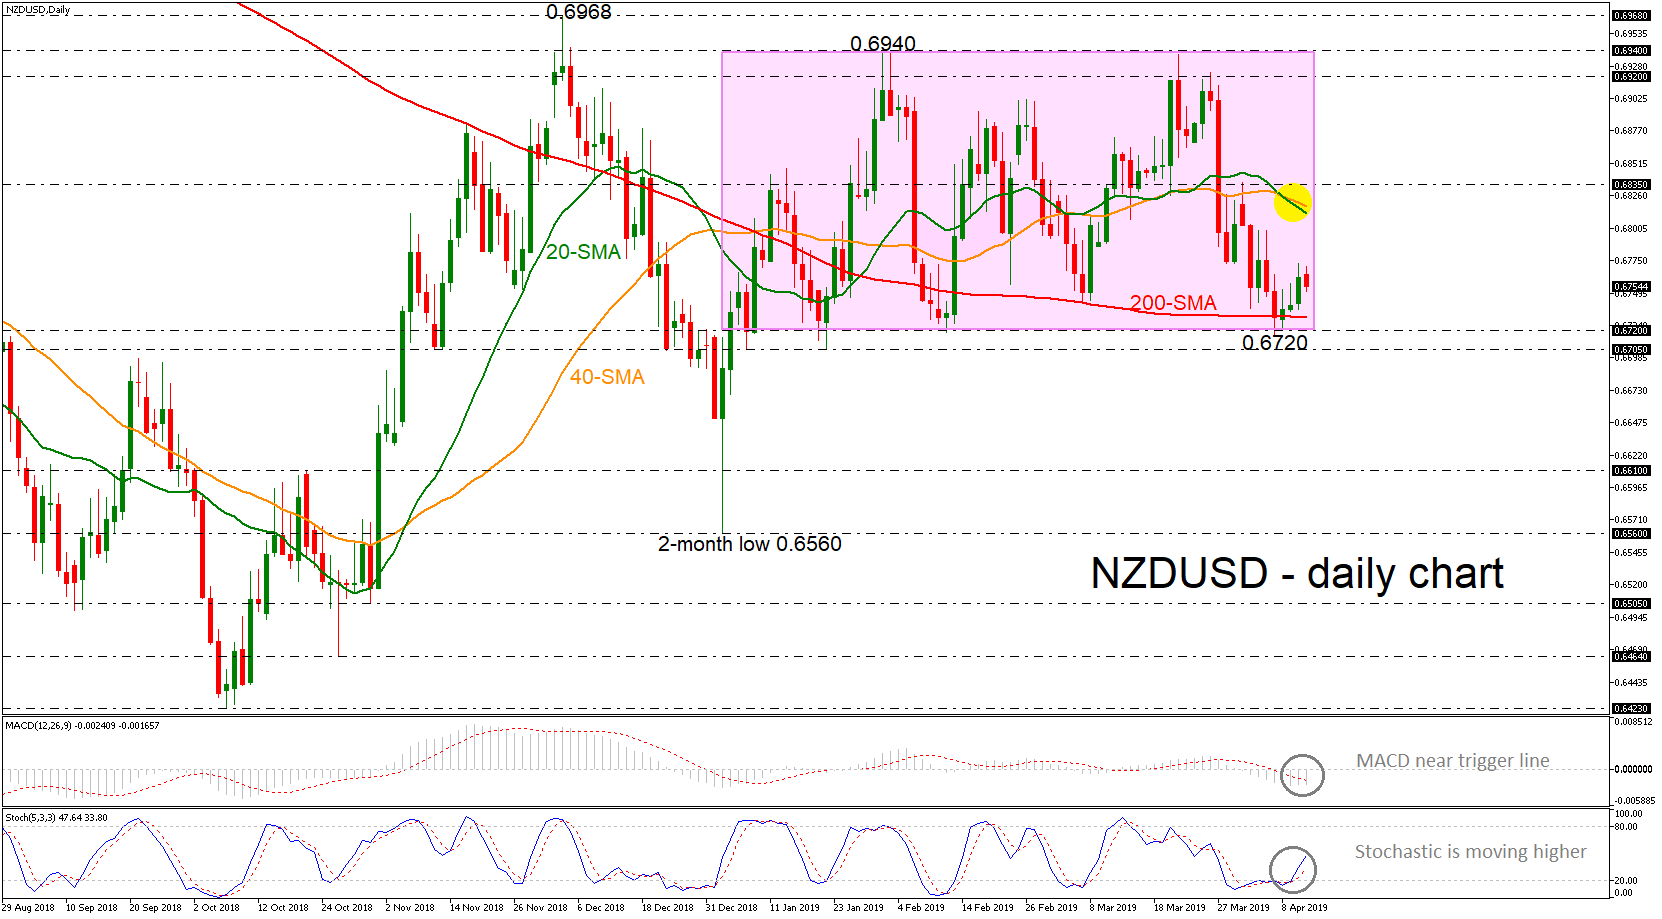
NZDUSD Remains In Consolidation Area, Stochastics Suggest Bullish Bias
NZDUSD has been developing within a consolidation area over the last three months with upper boundary the strong resistance level of 0.6940 and the support level of 0.6720. In the near term, the price rebounded on the 200-day SMA, posting three positive days.
Technically, the %K line of the stochastic oscillator is gaining ground after the bullish cross with the %D line in the previous days, while the MACD is trying to advance above trigger line in the negative territory.
An extension to the upside could find resistance around the bearish cross of the 20- and 40-simple moving averages (SMAs) currently at 0.6815, while higher up, immediate resistance is coming from the 0.6835.
If the bears manage to take control and penetrate the sideways channel, support is coming slightly below the lower boundary near 0.6705. A close below this level as well, could confirm the forthcoming bearish structure until the 0.6610 area.
Overall, NZDUSD lacks direction and investors should be waiting for an exit of the range before placing orders.
EUR/USD Outlook: Bulls Regained Traction But Struggle Again At Key 1.1280 Resistance Zone
The Euro stands at the front foot in early European trading on Thursday after bulls returned to play and managed to fully recover Wednesday’s fall, sparked by soft tone from ECB President Mario Draghi, who pointed to downbeat economic outlook and stronger dollar after soft US CPI data revived risk mode.
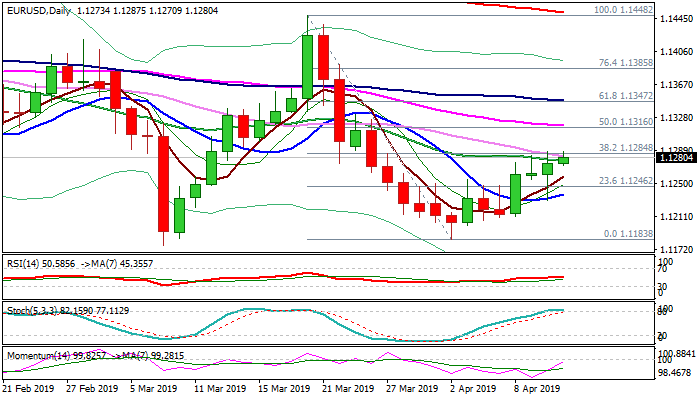
Despite prevailing positive tone on rising momentum, the Euro faces strong headwinds from key barriers at 1.1278/84 zone (converging 20/30 SMA’s / Fibo 38.2% of 1.1448/1.1183) which capped attempts in past two days.
Sustained break here would generate positive signal for extension of recovery from 1.1183 (2 Apr low) towards targets at 1.1318 (55SMA) and 1.1348 (100SMA).
Repeated failure to clear these barriers would revive downside risk and expose lower pivot at 1.1237 (10SMA) loss of which will confirm reversal.
Res: 1.1284, 1.1318, 1.1348, 1.1385
Sup: 1.1270, 1.1257, 1.1237, 1.1210