Sample Category Title
US-China close to a trade deal, might announce Trump-Xi summit today
News regarding US-China trade negotiations are generally positive. Trump scheduled to meet Chines Vice Premier Liu He at 2030 GMT today (Thursday). WSJ reported that there might even be an announcement of a Trump-Xi summit during the meeting. Bloomberg reported that the draft agreement would give China six years, until 2025, to meet the commitments.
According to unnamed source, under agreement, China pledged to buy more US commodities including soybeans and energy products. Also 100% US owned companies would be allowed to operate in the country. Failure to fulfil these binding commitments would trigger retaliation from the US. There are also some non-binding pledges from China too, which would be implemented by 2029.
However, there is little news regarding how to hand the punitive and retaliation tariffs imposed since last year. Trump previously warned they are necessary "for a substantial period of time" for China's history on missing promises.
Separately White House Economic Adviser Larry Kudlow said "We're covering issues that have never really been covered before, including enforcement". And, "al making good progress, all making good headway, but we're not there yet... we hope this week to get closer." Kudlow also said Liu will remain in Washington for three days and possibly longer.
Elliott Wave View Looking For Further Correction In Gold
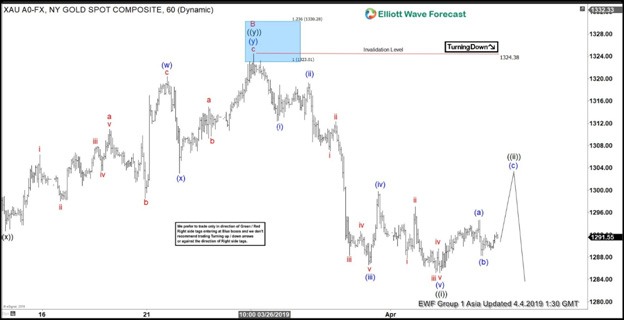
Elliott Wave view suggests that Gold has ended cycle from August 16, 2018 low ($1160.37). The yellow metal is currently correcting that cycle as a zigzag Elliott Wave structure. Down from Feb 20, 2019 high, wave A ended at $1281.01 and wave B ended at $1324.38. The yellow metal still needs to break below wave A at $1281.01 to validate this view.
Wave C is in progress as a 5 waves impulse Elliott Wave structure. Down from $1324.38, wave ((i)) ended at $1285.17. In the 1 hour chart below, we can see wave ((i)) subdivides as an impulse of a lesser degree. Wave ((ii)) bounce takes the form of a zigzag structure where wave (a) ended at $1294.36 and wave (b) ended at $1288.20. Near term, while wave ((ii)) bounce stays below $1324.38, expect Gold to extend lower. Projected area of wave ((ii)) comes at $1297 – $1303 where wave (a) = wave (c).
1 Hour XAUUSD Elliott Wave Chart
Trade Deal Hopes Euphoria Continues
China shares hit one-year high
Speculation that a trade deal was “close” helped Wall Street to rally yesterday and that trend extended in to today’s Asian session, with little on the data front to disrupt the bullish sentiment. Despite the fact that the details of the proposed deal appear to be very one-sided, with the US supposedly being allowed to re-impose tariffs immediately if China does not comply with the terms of the deal, but China cannot do the same, nor can it take the US to the World Trade Organisation, China shares pushed higher for a second straight day to touch the highest since March 13 last year.
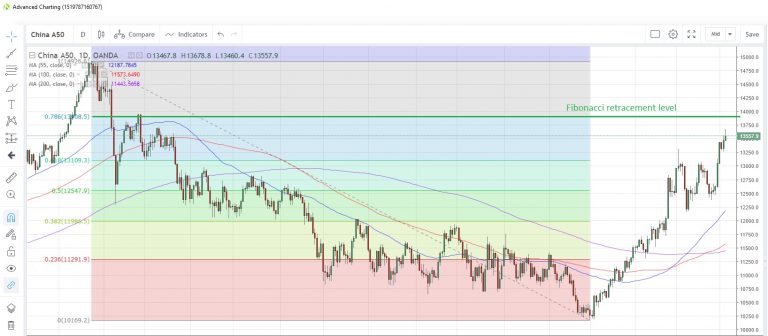
The index appears to be heading toward the 78.6% Fibonacci retracement of the January 2018 to January 2019 drop at 13,908.
USD/JPY grapples with key moving average
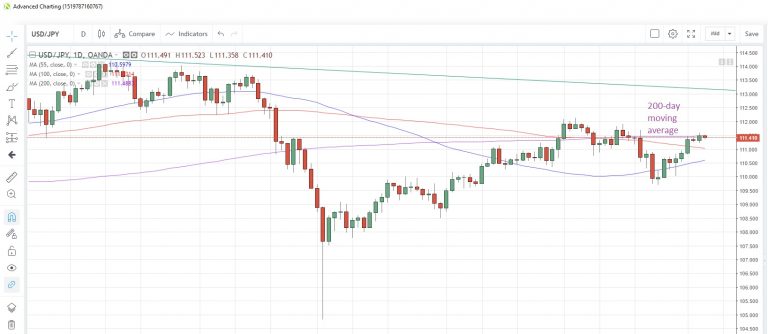
USD/JPY was marginally lower on the day as the FX pair hovers around the 200-day moving average at 111.49. The moving average has been tested daily this week but we have yet to see a sustained close above it. Speaking before Parliament, Bank of Japan Governor Kuroda reiterated that the Bank needs to continue easing persistently to support the economy and acknowledged that it would take some time to reach price targets.
German factory orders to stay weak
German factory orders likely contracted for a ninth straight month on February. Surveys suggest orders fell 5.4% y/y following a 3.9% decline in January. The minutes of the last ECB meeting are due today, with focus squarely on discussions about the meager growth forecasts. There are more US jobs data releases today ahead of tomorrow’s nonfarm payroll report. Challenger job cuts for March and the weekly jobless claims are scheduled. Speeches from the Fed’s Mester and Williams complete the session.
Market Morning Briefing: Aussie Has Risen Sharply
STOCKS
Among the equities, Shanghai and Nikkei are positive in the near term. DAX is heading towards a key resistance. Dow, Sensex and Nifty may see some downticks in the near term before resuming their uptrend.
Dow (26218.13, +39.00, +0.15%) continued to trade below the resistance at 26250. As mentioned yesterday, a dip to 26000 cannot be ruled out while below 26250. A range bound move between 26000 and 2625 seems likely in the near term. A decisive break above 26250 is needed for the Dow to target 27000 and 27200 thereafter.
DAX (11954.40, +199.61, +1.70%) retains the momentum and has surged further. The index is likely to extend the current upmove towards 11200 and even 11250 in the coming days after which a corrective fall is possible. Support is at 11900.
Nikkei (21760.65, +47.44, +0.22%) remains positive and is heading towards 21900-22000 as expected. Cluster of resistances are poised in between 21925 and 22000. A pull-back from there can drag it to 21500 or even 21000 again. But a strong weekly close above 22000 will increase the possibility of the index targeting 22600 thereafter.
Shanghai (3244.82, +28.52, +0.89%) has risen sharply above 3200 and remains bullish for a test of 3280.
Sensex (38877.12, -179.53, -0.46%), though surged to record highs, seems to be lacking fresh follow-through buyers above 39000. This keeps the possibility high of the index falling to 38500 on a break below 38800 in the coming sessions. A decisive close above 39000 is needed to bring back the bullish momentum to target 39500 and higher levels.
Nifty (11643.95, -69.25, -0.59%) has immediate support at 11600 which is likely to be tested in the coming sessions. A break below it can trigger a corrective fall to 11500 or even 11400. Nifty needs a strong close above 11760 to become bullish again and move higher.
COMMODITIES
Gold and Silver looks mixed and can remain range bound in the near term. May be the outcome of the US non-farm payroll data on Friday could be a trigger for it break the range on either side. Copper has bounced from a key support but has a resistance ahead which has to be breached for it to move further higher. Oil may consolidate or may dip in the near term before moving higher.
Gold (1291) continues to hover above 1280. The near term outlook is mixed and gold can trade in the broad 1280-1305 range for some time.
Silver (15.13) is stuck in between 15 and 15.2. A breakout on either side of 15 or 15.2 will decide the next move. A test of 15.35 is possible on a break above 15.2. On the other hand, a break below 15 can take it to 14.85.
The support in the 2.90-2.89 region has held well for Copper (2.95). It has bounced to 2.95 as expected. A decisive break above 2.96 is needed for copper to extend the upmove to 3.0 levels. Inability to breach 2.96 can drag it to 2.90 again.
WTI (62.41) is holding higher but seems to lack strength. Support is at 61.45 (200-day moving average). While above this support, a test of 63.5-64 is possible in the near term. But a decisive break below 61.45 will drag WTI to 60.35.
The 69.7-70 resistance region on the Brent (69.35) has been holding well as of now. A dip to 68.3 and 68 looks likely before Brent breaks above 70 and rallies to 72.
FOREX
Dollar-Index (97.08) has dipped from 97.50 itself and could possibly fall towards 96.50 or lower in the coming sessions. Trading within the broad 97.75-95.75 region the current fall is likely to sustain for about a week at least.
Euro (1.1238) on the other hand has bounced back sharply negating a test of 1.11 just now. While the rise sustains, Euro could continue to move up towards 1.1250-1.1300 in the near term.
Euro-Yen (125.22) is almost stable. We need to see if it breaks above 125.40 which would enable a rise towards 126.0-126.8 again in the near term; else a fall back to 125-124 is possible.
Dollar Yen (111.42) could test resistance levels of 111.50-112.0 from where a rejection is expected towards 111-110 in the near term.
Aussie (0.7116) has risen sharply. A break above 0.7150 could take it higher towards upper resistance of 0.72.
Pound (1.3171) has tested resistance at 1.32 and could face rejection to 1.3050 just now. Only on a rise above 1.32, we would consider medium term bullishness for Pound targeting upside levels of 1.34.
USDCNY (6.7136) could rise towards 6.75 in the near term. Near term looks bullish.
Dollar-Rupee (68.43) declined after rising to 68.83 yesterday indicating that the bearish momentum is strong and is in place for the near term. While downside levels of 68.25/00 remains open, we could possibly see a short bounce from 68.40/35 levels during the coming sessions.
INTEREST RATES
The US Yields are headed up. The 30Yr (2.93%) is up from 2.90% seen yesterday and could move up towards 3% before pausing. The 10Yr (2.52%) is also headed up and could rise towards 2.55/58% in the coming sessions.
RBI Monetary policy is due today.
The 10Yr GOI (7.4167%) needs to break below 7.40% to turn bearish towards 7.35%. Else we could see some ranged trade within 7.40-7.45%.
The German-US 10YR (-1.42%), the US-JGB 10YR (2.56%) and the German-JGB 10YR (0.05%) have all bounced well from near term supports and while the spreads continue to rise, the respective currency pairs of Euro, Dollar-Yen and Euro-Yen look bullish for the near term.
US Crude Oil Inventory Surprisingly Jumped as Producers Ramped Up Output on Price Increase
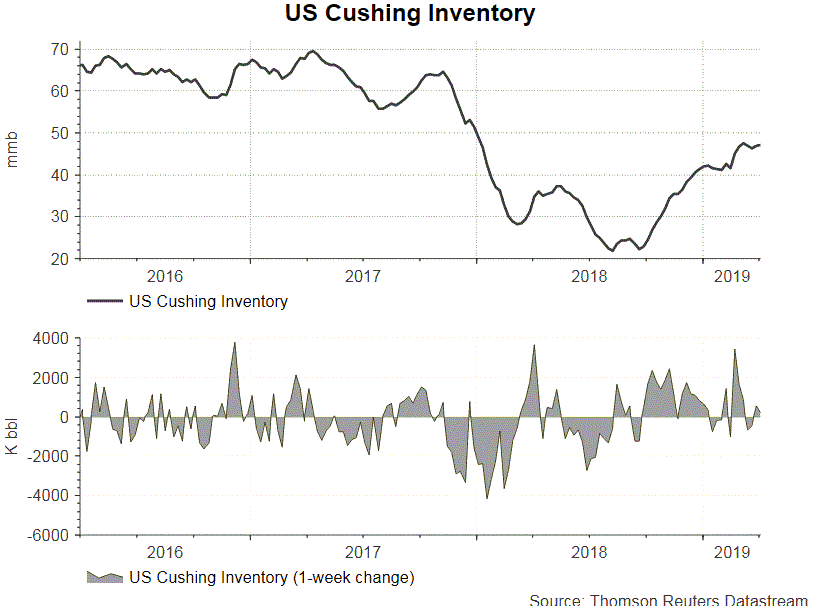
The report from the US Energy Information Administration (EIA) shows that total crude oil and petroleum products (ex. SPR) stocks surged +7.22 mmb to 1229.13 mmb in the week ended March 29. Crude oil inventory surprisingly soared +7.24 mmb to 449.52 mmb (consensus: -0.43 mmb). Inventories rose in 3 out of 5 PADDs with PADD 3 (Gulf Coast) seen a +8.73 mmb increase. Meanwhile, Cushing stock added +0.2 mmb to 47.13 mmb. Utilization rate dropped -0.2% to 86.4% while crude production gained +0.1M bpd to a fresh record high of 12.2M bpd for the week. US producers ramped up production as crude oil price has strengthened for 4 consecutive weeks. Crude oil imports increased +0.22M bpd to 6.76M bpd in the prior week.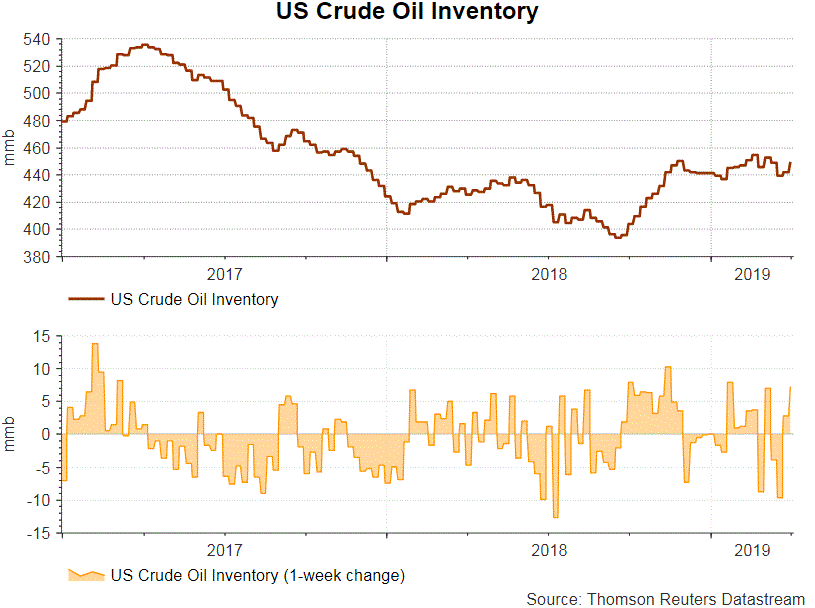
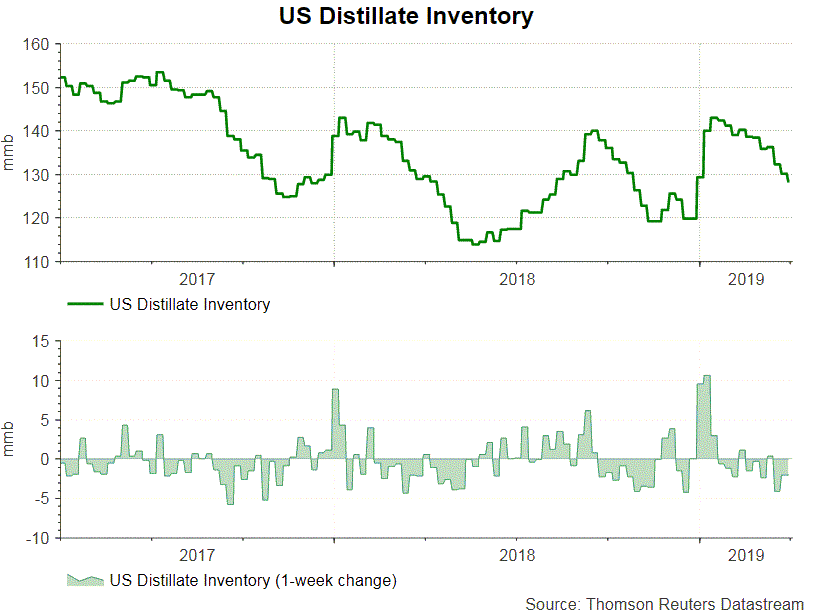
Concerning refined oil product inventories, gasoline inventory declined -1.78 mmb to 236.84 mmb as demand added +0.08% to 9.13M bpd. The market had anticipated a -1.54 mmb drop in stockpile. Production gained +1.62% to 9.81 bpd while imports rose +8.43% to 0.75M bpd during the week. Distillate inventory fell -2 mmb to 128.17 mmb. Demand dropped -1.42% to 4.16M bpd. The market had anticipated a -0.51 mmb decline in inventory. Imports plunged -28% to 0.14M bpd while production was down -1.12%to 4.87M bpd during the week.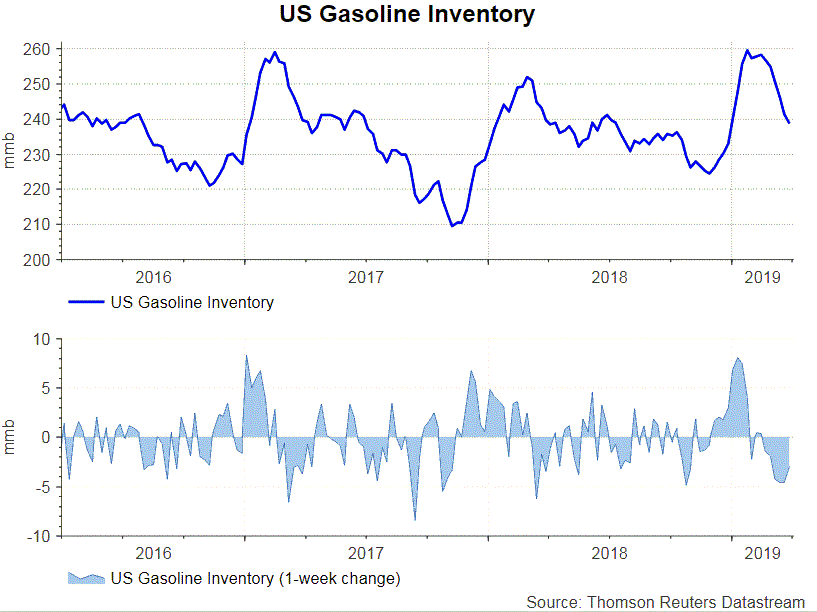
 Released after market close on Wednesday, the industry- sponsored API estimated that crude oil inventory increased +3 mmb during the week. For refined oil products, gasoline stockpile drew -2.6 mmb while distillate decreased -1.9 mmb.
USD/CHF Remains At Risk Of More Downsides
Key Highlights
- The US Dollar recently failed to break the key 1.0000 resistance against the Swiss Franc.
- A crucial resistance is formed near 0.9990 on the 4-hours chart of USD/CHF.
- The US ISM Non-Manufacturing Index declined from 59.7 to 56.1 in March 2019.
- The US Initial Jobless Claims for the week ending March 30, 2019 could rise from 211K to 216K.
USDCHF Technical Analysis
After trading as low as 0.9896, the US Dollar recovered above 0.9950 against the Swiss Franc. However, the USD/CHF pair failed to break the key 1.0000 resistance and recently declined.
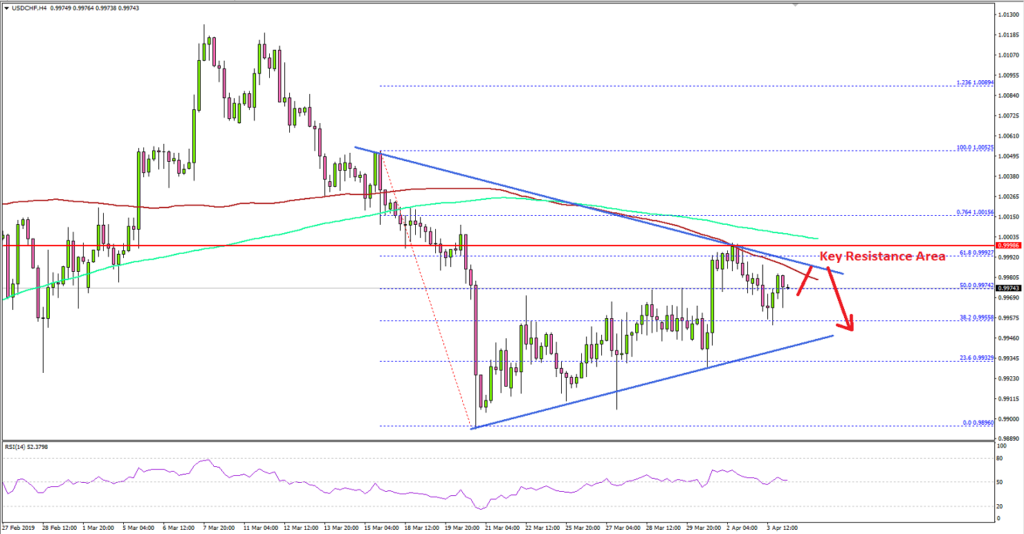
Looking at the 4-hours chart, the pair started a decent recovery from the 0.9896 low and climbed above the 0.9950 and 0.9975 resistance levels. There was even a break above the 50% Fib retracement level of the last decline from the 1.0052 high to 0.9896 low.
However, the pair faced a strong resistance near 1.0000 and the 100 simple moving average (4-hours, red). The pair declined recently below 0.9975 and it seems like there is a crucial resistance formed near 0.9990 and a bearish trend line on the same chart.
A break above 0.9990 and follow through above 1.0000 might start a solid upward move. On the downside, there is a decent support formed near 0.9940. If there is a break below the 0.9940 support, the pair is likely to revisit the 0.9900 support area.
Fundamentally, the US ISM Non-Manufacturing Index for March 2019 was released by the Institute for Supply Management (ISM). The market was looking for a minor decline from the last reading of 59.7 to 58.0.
The actual result was lower than the forecast, as the US ISM Non-Manufacturing Index declined from 59.7 to 56.1, but the overall economy grew for the 119th consecutive month.
The report added:
The New Orders Index registered 57.4 percent, an increase of 1.9 percentage points from the February reading of 55.5 percent. The Production Index registered 55.8 percent, a 1-percentage point increase compared to the February reading of 54.8 percent.
Overall, the US dollar might continue to struggle in the short term and a break above 1.0000 is needed for USD/CHF to continue higher.
Economic Releases to Watch Today
- US Initial Jobless Claims – Forecast 216K, versus 211K previous.
- Canada’s Ivey PMI March 2019 – Forecast 51.1, versus 50.6 previous.
US And China Seek Asymmetric Enforcers
US and China seek asymmetric enforcers
The Dove-fest unleashed by global central banks in January and February seems to have done its job for now. March prints on service and manufacturing PMIs across the globe have shown a (mostly) upside surprise implying that the dark clouds of late 2018 could be lifting. We’re not just talking China here, of course, the trend appears to be global, with countries as far apart as Brazil and Singapore posting expansionary PMI data.
So is this a false dawn or the start of a new harvest of “green shoots” for the global economy? It’s probably too soon to say if the rush will fade, but what is for sure, it needs a US-China trade deal to make it happen. Any sceptics to this viewpoint could look to the North American session today. The Financial Times (FT) reported from Washington DC that a trade deal was close. It immediately saw poor US ADP Employment data forgotten, Wall Street rallying back slightly into the green and the US 10-year yield climb back above 2.50%. Even the German 10-year Bund regained the 0% handle. The world is a strange place when the markets let out a sigh of relief at 0% government yields.
The devil is in the detail of course, and the FT reports the final 10% involves China signing off on an asymmetric enforcement regime. Basically, if China is perceived by the US as having broken the terms of the trade deal, the US can re-impose tariffs immediately until China fully complies. China though is not allowed to impose counter-tariffs or take the US to the World Trade Organisation. This will be a bitter pill to swallow. If anything it highlights the tough stance the US is taking with China, not seeking easy wins but a fundamental reset in how China does business with the world. Green shoots and all, China will likely have to juice and swallow most of it.
Of course, financial markets are the ultimate experts in not letting the details get in the way of a good story and the positive vibes from the trade talks and PMI prints should see Asia off to a good start with a light data calendar.
FX
The US dollar gave back its gains of the early session as a risk-on outlook story saw a rotation out of US Treasuries and the dollar. The Dollar Index fell slightly by 0. 28% to 97.09 with the euro, yen and sterling all gainers.
However, volatility remained dire overall with FX markets continuing the belligerent wait-and-see mindset that has characterised 2019. Nevertheless, regional currencies should get off to a bright start in Asian trading on trade hopes.
Equities
Wall Street finished the day slightly higher with the Nasdaq rising 0.6%, and the Dow Jones and S&P up approximately 0.2%. Respectable but not stunning. Poor US ISM and ADP Employment data had seen Wall Street sink into the red earlier in the session.
Global growth hopes from the trade talks gave Wall Street a late fillip and the same theme should apply to Asian stock markets today. It’s likely regional equities will proceed straight to go this morning and enjoy positive starts.
Oil
Last night’s US Crude Inventory data surprised with an unexpected build-up of 7.2 million barrels versus an expected drawdown of -425,000 barrels. The data should have been enough to hold the recent crude rally below the waterline with traders experiencing a sinking not loving feeling. Instead, both Brent and WTI closed unchanged at USD70.00 and USD68.20 dollars a barrel respectively.
The global growth US-China story is, of course, the reason with oil particularly exuberant in recent times on the prospects of a global recovery. The bull run has left both Brent and WTI dangerously overbought on their Relative Strength Indicators. The technical picture suggests that the longer oil stays so overbought on a daily basis, the uglier the correction down will be for both contracts. Traders should exercise caution at these levels.
Gold
Gold had a quiet session and seems to have really fallen off the trading radar of late. The yellow metal closed unchanged at USD1,290.00 an ounce balanced between a weaker dollar and hot money rotating into more risk-seeking assets.
Gold though remains safely above its crucial 1275.00/1280.00 support region even if the eyes of the world are turned elsewhere.
Eco Data 4/4/19
[php_everywhere instance="1"]
US 10-year yield reclaims 2.5, strong resistance ahead
Both US and German bond yield enjoy solid rally today despite poor economic data. Sentiments are generally lifted by optimism on US-China trade negotiations despite lack of concrete news on the progresses. Nevertheless, German 10-year yield turns positive for the first time since late March, and that's significant. Meanwhile, US 10-year yield also breaks 2.5% handle.
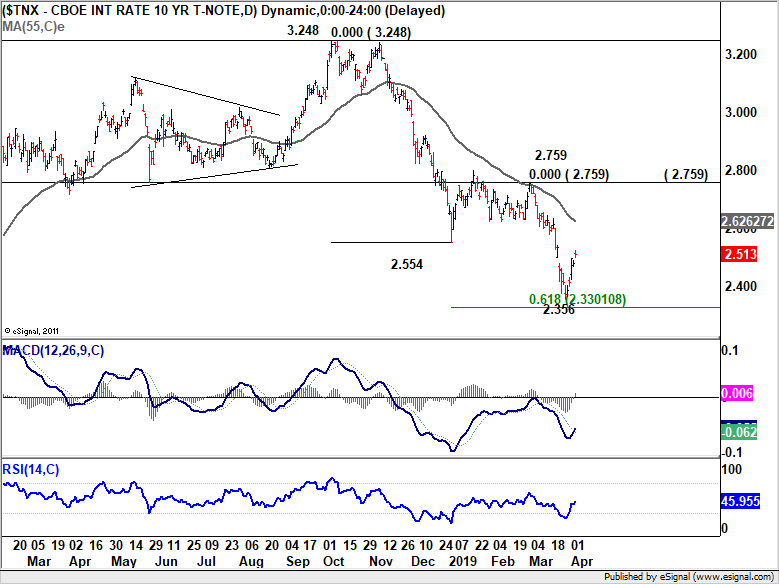
10-year yield (TNX) hits as high as 2.524 so far today. The extended rebound is not too much of a surprise considering that it was supported just above 61.8% projection of 3.248 to 2.554 from 2.759 at 2.330. For now, we'd maintain that sustained break of 2.554 support turned resistance is needed to be the first sign of trend reversal. Otherwise, the currently rebound is nothing more than a corrective recovery.
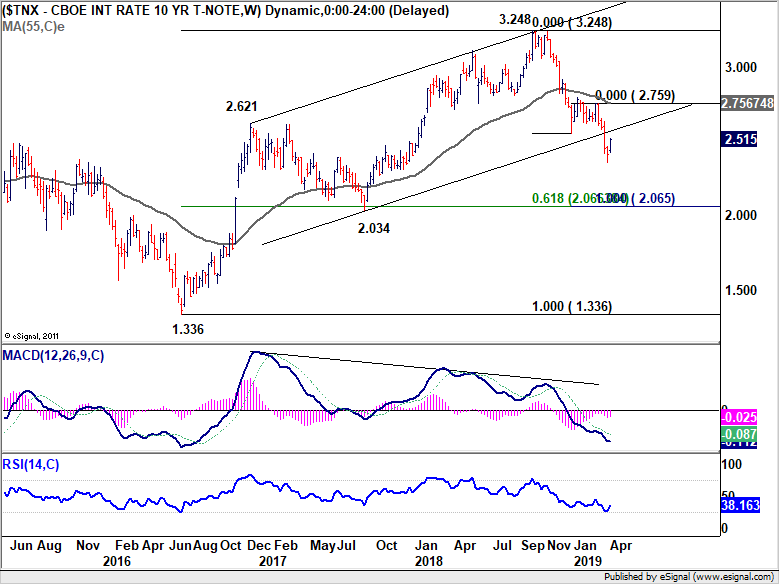
To put it into longer term perspective, TNX is actually still limited well below long term channel support. Current development suggests that fall from 3.248 is at least corrective whole up trend from 1.336. And, further decline is in favor to 2.034 cluster support before bottoming. So, it's too early to be optimistic.
US Jobs Growth to Pick Up; Wage Growth to Remain Robust
The US dollar shrugged off downbeat retail sales and inflation figures recently as business data surveyed by the ISM institute indicated that production, new orders and employment bounced up in the previous month, helping 16 out of 18 manufacturing industries to pick up growth. The data volatility is now extending to the end of the week when the March Nonfarm payrolls report is awaited by investors to reassess their outlook on the Fed’s frozen monetary tightening plans.
The Fed has dramatically lowered its interest rate projections to zero this year after raising them four times in 2018. Downside external risks from China and Europe as well as internal signs that the US economy could be at the end of its growth cycle put the central bank in safety mode and 2019 forecasts for two rate hikes to bed in early March, with policymakers relying on data developments to drive policy.
The economic evidence, however, has been mostly disappointing since the FOMC policy meeting as initial estimates for a weaker 2.6% y/y growth in the last quarter of 2018 were revised even lower to 2.2% last week, embracing the Fed’s dovish turn. The Core Personal Consumption Expenditures (PCE) Price Index, the main inflation tool policymakers use to adjust monetary policy was also a negative spot as the measure eased more than analysts anticipated and further below the 2.0% target. Personal consumption and income readings which accompanied the inflation report were not encouraging either; although they returned to growth, the rise did not match forecasts and was minimal, underlying the lack of spending confidence among households, something proved by the surprising negative retail sales prints in February as well.
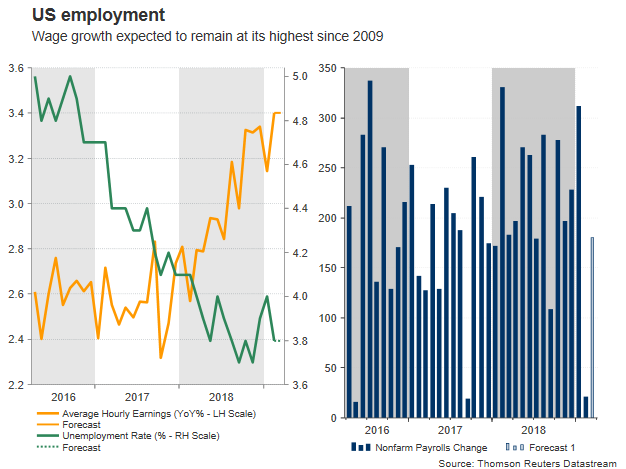
While the latter could be partially attributed to delays in processing tax refunds, the US Jobs report scheduled for release on Friday at 1230 GMT could give some insights on whether the slowing in consumption, which accounts for more than two-thirds of the US economic activity, is a temporary incident or a downtrend in progress.
Still, analysts hope for a brighter employment report this time and therefore well-supported pockets in the household framework. Particularly, the US economy is said to have added 180k new job positions in private and public nonfarm sectors in March compared to the sluggish 20k increase registered in the preceding month, leaving the unemployment rate unchanged at 3.8%, the lowest in 19-years. Average hourly earnings are seen slightly weaker at 0.3% on a monthly basis versus February’s rise of 0.4% but year-on-year, the gauge is expected to hold the strongest in a decade at 3.4%, well above the inflation rate, boosting consumers’ real disposable incomes to mitigate a potential negative economic shock.
Nevertheless, the Fed is not willing to continue the rate hiking path unless wage growth translates to higher inflation. Markets are even more pessimistic, predicting a rate cut with a probability of 65% by the end of the year if trade talks between the US and China are prolonged without real results and EU-UK negotiations fail to deliver an orderly Brexit, hurting confidence in the global economy.
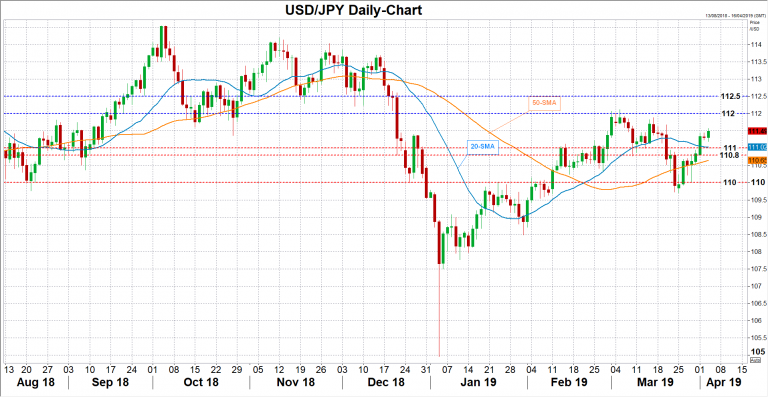
Another negative surprise in NFP numbers, would undermine the health of the US job market and bring down hopes for higher inflation, making a rate cut more likely. The US dollar could bear the disappointment, driving USDJPY closer to the 20- and 50-day moving averages (111-110.80), while the 110 level could be also eyed in case of steeper declines.
Alternatively, better-than-expected results may help USDJPY to reach its recent highs near the 112 mark on the increasing assumption that a tighter labor market could revive inflation pressures and therefore reduce chances for a rate cut. A bigger positive surprise may also lead the pair towards 112.50-113.