

Sample Category Title
Asian Equities Trade Mixed Ahead Of Fed Decision
General Trend:
- IT, Telecom Services, Property, Materials and Energy firms decline in Shanghai
- Shanghai banking index out performs in early trading amid renewed RRR cut speculation
- Everbright Securities declines in Hong Kong, cut outlook on investment impairment
- Iron/Steel and Real Estate firms rise in Japan, Securities brokers decline
- Sony and Nintendo decline as Google plans video game service
- Resources and financial companies decline in Australia
- Australian iron ore producers decline; China iron ore prices decline by 5% on mining resumption by Vale
- Australian coal miner New Hope continues to decline post earnings
- Crop protection firm Nufarm declines over 20% in Australia, cut outlook and suspended dividend
- Samsung Electronics declines on session, CEO made AGM comments
- Fedex declined over 5% in afterhours trading, cut earnings outlook
- Australia 3-yr yield remains below RBA’s cash rate
- Australia Feb labor market data due on Thursday
- US dollar trades generally higher ahead of Wed’s Fed decision
- New Zealand Dollar (NZD) declines ahead of Thursday’s release of Q4 GDP
- Tencent expected to report Q4 earnings on Thursday (after the market close)
Headlines/Economic Data
Australia/New Zealand
- ASX 200 opened -0.1%
- FCG.NZ Reports H1 (NZ$) normalized Net 80M v 35.9M y/y, EBIT 32M v 45M y/y, Rev 9.7B v 9.8B y/y
- TLX.AU Announce cGMP manufacturing of TLX250 complete, to start clinical trials in US mid-2019 subject to permission from FDA
- (AU) Australia Quarterly Statement by the Council of Financial Regulators (CFR): Housing markets remain weak, particularly in Melbourne, Sydney and Perth; but does not raise stability concerns, will be closely watching
- (NZ) NEW ZEALAND Q4 CURRENT ACCOUNT BALANCE (NZ$): -3.3B V -3.6BE; CURRENT ACCOUNT TO GDP RATIO YTD: -3.7% V -3.9%E
- NUF.AU Reports H1 (A$) Net -13.6M v +12.0M y/y; EBTDA 120.9M v 123.2M y/y; Rev 1.58B v 1.46B y/y; suspends dividend payout
- (AU) Australia sells A$900M v A$900M indicated in 2.50% May 2030 bonds, avg yield 1.9459% v 2.0677% prior, bid to cover:3.03x v 3.41x prior
- ECX.AU Confirms profit warning, no longer expects to achieve FY19 Net profit consistent with FY18; deal with McMillan Shakespeare may not go ahead
- (AU) Australia RBA Assistant Gov Bullock: Further tightening in lending standards might, however, impact both purchasers of new apartments and developers, none planned - speaking at the Urban Development Institute of Australia WA, Perth
- (AU) Australia Feb Skilled Vacancies m/m: -0.9% v -0.5% prior
Japan
- Nikkei 225 opened -0.1%
- (JP) BoJ Dep Gov Wakatabe: Japan is making progress towards fiscal health - speaking in Diet
- 6502.JP Toshiba Memory said to plan to postpone plan for Sept IPO - Japanese Press
- 8028.JP May report FY18/19 Core Op +20% y/y - Japanese Press
- (JP) Bank of Japan (BOJ) Monetary Policy Meeting Minutes for Jan 22-23 meeting (2 meetings ago): Reiterates Most: Will take time to reach inflation target of 2%, Appropriate to continue easing persistently
- (JP) Japan land prices +1.2% y/y, helped in part by tourists (4th year of increasing) - Nikkei
Korea
- Kospi opened -0.3%
- (KR) South Korea Feb PPI m/m: +0.1% v -0.2% prior (1st increase since Oct); y/y: -0.2% v +0.1% prior
- 042700.KR Signs KRW2.6B contract to provide chip manufacturing equipment to Hynix
- 005930.KR CEO Kim Ki-Nam: difficult management conditions remain this year, to achieve growth based on profitability in TV and home appliance unit this year
- (KR) US Dept of Defense has diverted funding for military operations in Korea to build President Trump's wall along the border with Mexico - Korean press
- (KR) Bank of Korea (BOK) sells KRW2.75T in 2-yr Monetary Stabilization Bonds (MSBs), avg yield 1.85% v 1.82% prior
- (KR) North Korean propaganda outlet Uriminzokkiri: South Korean military's Ssangyong and Ulchi Taegeuk exercises are a "vicious challenge" to hopes for peace and a violation of the agreements reached between the two Koreas - Yonhap
China/Hong Kong
- Hang Seng opened -0.4%; Shanghai Composite opened -0.2%
- (CN) China PBOC may cut RRR in Q2 - China Securities Journal
- (CN) China-US trade talks said to be in final stages; Trade Rep Lighthizer and Treasury Sec Mnuchin to fly to Beijing week of March 25th – press
- (CN) Some US officials reportedly see China walking back trade offers; some officials said to see China moves as normal part of the process - press
- (CN) China said to be considering excluding 737 Max aircraft from US trade deal - press
- (US) Pres Trump: China trade talks are going "very well" - press conf Q&A
- (CN) China PBoC Open Market Operation (OMO): Skips OMO v CNY50B injected in 7-day prior; Net: CNY0B injection v CNY50B injected prior
- (CN) China PBoC sets yuan reference rate: 6.7101 v 6.7062 prior
- (CN) China President Xi to sign agreements with France and Italy on visit to EU
- 489.HK Nissan JV cuts 2022 China sales target by 8% to 2.39M autos (prior 2.61M)
- (CN) Analysts expected listed China banks will need to raise ~$260B in capital over the next 3-yrs as regulations require shadow bank loans to now be listed on balance sheets - FT
North America
- FOXA Disney and 21st Century Fox announce $51.57 per share value in connection with $71B acquisition
- (US) NPD: US Feb Total Video Game Spending $1.05B, +4% y/y
Europe
- (UK) BBC's Kuenssberg: PM May's office has indicated the Brexit extension letter will be sent tomorrow to the EU
- (UK) UK PM May has requested to address the 1922 Committee at 17:00 local time (16:00GMT) on Wed - UK Media
Levels as of 1:20 ET
- Nikkei 225, +0.1%, ASX 200 -0.3%, Hang Seng -0.4%; Shanghai Composite -1.1%; Kospi -0.7%
- Equity Futures: S&P500 -0.1%; Nasdaq100 -0.1%, Dax -0.5%; FTSE100 -0.6%
- EUR 1.1358-1.1342 ; JPY 111.69-111.32 ; AUD 0.7092-0.7056 ;NZD 0.6857-0.6827
- Gold -0.1% at $1,304/oz; Crude Oil -0.2% at $59.16/brl; Copper flat at $2.918/lb
Elliott Wave View: Nifty Looking To Break 2018 High
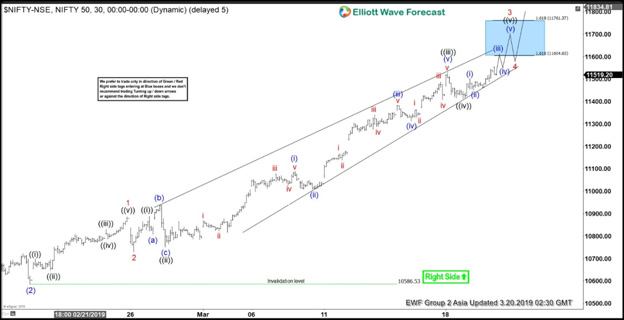
Since forming the low on Oct 26, 2018 low, Nifty has rallied higher and now is challenging the 2018 high (11760.20). A break above 2018 high will signal that the Index has ended the entire correction from 2018 high. A break above 11760.20 will also rule out the possibility of a double correction in Nifty. Our current view anticipates this breakout, but the actual break is going to validate the view and opens further upside.
The rally from Oct 26, 2018 low is proposed to be unfolding as an impulse Elliott Wave structure. Wave (2) of this impulse ended at 10586.53. Wave (3) rally is currently in progress with subdivision as an impulse. Up from 10586.53, wave 1 ended at 10887.1 and wave 2 ended at 10729.30. Near term, dip is expected to find buyers in 3, 7, or 11 swing for further upside within wave (3). As far as pivot at 10586.53 low stays intact, expect Index to extend higher.
For completeness, we also present an alternative view. In the alternate view, the rally from Oct 26, 2018 low takes the form of a zigzag Elliott Wave structure. In this case, Nifty should end the current 5 waves up from 10586.53 as wave (C). Afterwards, the Index will turn lower aggressively without breaking above 2018 high (10729.3).
1 Hour Nifty Elliott Wave Chart
EUR/USD And USD/CHF: US Dollar Remains In Downtrend
EUR/USD recovered nicely and broke the 1.1325 resistance area to move into a positive zone. USD/CHF is currently under pressure, but it may recover in the short term.
Important Takeaways for EUR/USD and USD/CHF
- The Euro gained traction and broke the 1.1280 and 1.1325 resistance levels against the US Dollar.
- There is a key bullish trend line formed with support at 1.1340 on the hourly chart of EUR/USD.
- USD/CHF declined heavily and broke the 1.0040 and 1.0020 support levels.
- There is a major bearish trend line formed with resistance at 1.0000 on the hourly chart.
EUR/USD Technical Analysis
After traded below the 1.1240 support level, the Euro found a strong buying interest against the US Dollar. The EUR/USD pair started a solid upward move and broke the 1.1280 and 1.1325 resistance levels.
The recent upward move was strong as the pair even broke the 1.1340 resistance level and settled above the 50 hourly simple moving average. The pair traded as high as 1.1361 on FXOpen and it is currently correcting lower.
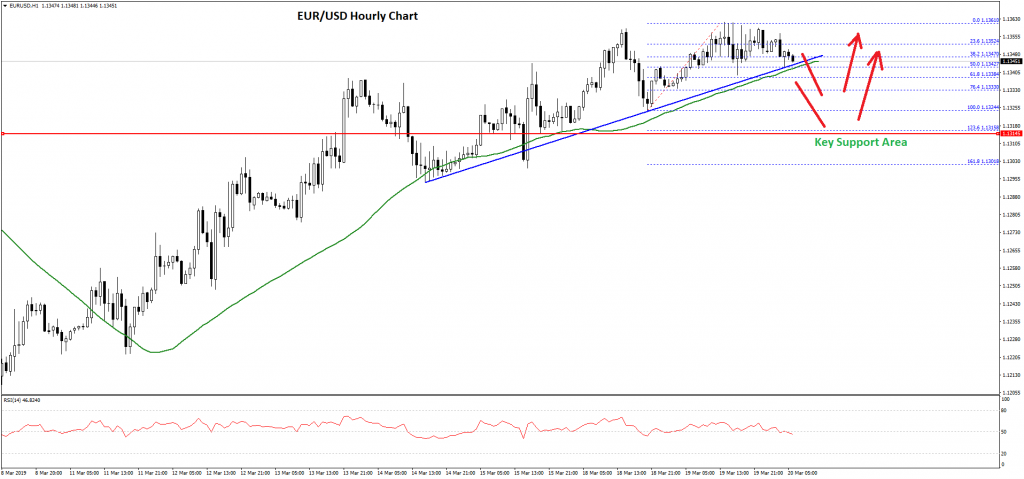
The pair corrected below the 1.1350 support and the 38.2% Fib retracement level of the recent wave from the 1.1324 low to 1.1361 high. However, there is a strong support formed above the 1.1345 level.
There is also a key bullish trend line formed with support at 1.1340 on the hourly chart of EUR/USD. The trend line is close to the 50% Fib retracement level of the recent wave from the 1.1324 low to 1.1361 high.
If there is a downside break below the trend line, the pair may correct lower towards the 1.1325 support zone. If sellers gain control, the pair could even test the 1.1300 support level, where buyers are likely to emerge.
On the upside, an initial resistance is near the 1.1360 zone, above which the pair is likely to climb towards the 1.1380 and 1.1400 resistance levels in the coming sessions.
USD/CHF Technical Analysis
The US Dollar started a significant downside move from the 1.0125 zone against the Swiss franc. The USD/CHF pair declined heavily and broke the 1.0100 and 1.0080 support levels to move into a bearish zone.
Sellers gained control and pushed the pair below the 1.0040 and 1.0020 support levels. There was even a close below the 1.0020 support and the 50 hourly simple moving average.
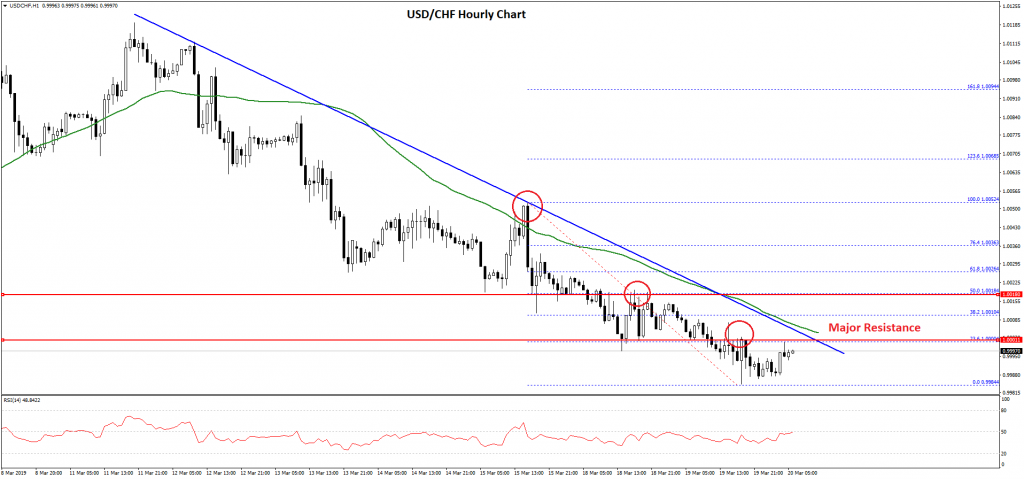
The pair traded as low as 0.9984 and it is currently correcting higher. It recently tested the 1.0000 resistance and the 23.6% Fib retracement level of the recent decline from the 1.0052 high to 0.9984 low.
It seems like there is a strong resistance formed near the 1.0000 and 1.0020 levels. There is also a major bearish trend line formed with resistance at 1.0000 on the hourly chart. The trend line also coincides with the 50 hourly SMA.
If there is an upside break above the trend line and the 50 hourly SMA, the pair could correct higher towards the 1.0020 level. It represents the 50% Fib retracement level of the recent decline from the 1.0052 high to 0.9984 low.
Sellers are likely to protect the 1.0020 resistance level. If they fail, the US Dollar could climb towards the 1.0050 resistance level. On the downside, an initial support is at 0.9985, followed by 0.9960.
Market Morning Briefing: Euro Tested 1.1360 Before A Short Dip
STOCKS
Indian equities retains their momentum and looks much stronger than their global peers. Among the global indices, DAX is relatively stronger than others while the DOW, Nikkei and Shanghai may consolidate before moving higher.
Dow (25887.38, -26.72, -0.10%) failed to get strong follow-through buying above 26,000 yesterday. However, the 21-day moving average (25823) is holding well and is keeping the chances alive of Dow moving up to test 26100 and 26200 levels. The outlook will turn negative for a sharp fall to 25200-25100 only if Dow declines decisively below 25770.
DAX (11788.41, +131.35, +1.13%) has risen towards 11780 as expected. The bullish outlook remain intact for the index to test our next target of 11870-11900.
Nikkei (21583.63, +16.78, +0.078%) is facing resistance around 21600. Immediate support is at 21450 (21-day moving average) while above which Nikkei can breach 21600 and rally to 21900 and 22000. But a break below 21450 can drag it to 21260.
Shanghai (3064.12, -26.85, -0.87%) seems to be struggling to breach 3100. If it continues to trade below 3100, a fall to 3000 or 2975 cannot be ruled out in the coming sessions. As mentioned yesterday, a decisive close above 3100 is needed for the index to target 3150 and 3180 thereafter.
Sensex (38363.47, +268.40 +0.70%) and Nifty (11532.40, +70.20, +0.61%) has negated the possibility of a corrective fall mentioned yesterday. The indices remain strong and retains their momentum. As mentioned a few days ago, Sensex and Nifty 50 are likely to revisit their previous highs if 38989 and 11760 respectively in the coming weeks.
COMMODITIES
Gold and Silver remains range-bound and has come-off after testing the upper end of their respective range. Copper is range-bound with a bullish bias and could be gearing up for a fresh rally. On the oil space, while Brent remains mixed in the near term, WTI looks relatively much stronger on the charts than Brent.
Gold (1305) tested 1310 and has come-off slightly. The 1290-1310 sideways range remains intact. A breakout on either side of 1290 or 1310 will decide the next move.
Silver (15.35) has reversed lower from around 15.45. It is likely to remain range bound between 15.10 and 15.50. Within this range, the possibility is high of it declining to 15.10 in the near term.
Copper (2.92) is inching higher within its 2.89-2.95 sideways range. The bias is positive for copper to breach the range above 2.95 and rise to 2.98 and 3.0 in the short term.
WTI (59.1) tested 59.5 as expected but did not breach it. The broader outlook remains bullish for WTI to break 59.5 and rise to 60.7 and 61. However, an intermediate dip to 58 before further upmove cannot be ruled out.
Brent (67.55) tested 68 but has come-off slightly from there. A dip to 66.5 cannot be ruled out if it remains below 68. A strong break and a decisive close above 68 will pave way for 70 in the coming days.
FOREX
Views on major currency pairs remain intact as most of them are stable near levels seen yesterday.
Dollar-Index (96.47) has bounced a bit, trading above 96.25 currently. While the support holds, the index could head higher towards our earlier mentioned target of 97.00 on the upside or even higher.
Euro (1.1347) tested 1.1360 before a short dip. Note that 1.14 is an important near term resistance and could hold, pushing Euro towards 1.13-1.1250 again.
Euro-Yen (126.68) is trading higher, heading towards 126.80. It would be important to see if 126.80 helps to push Euro-Yen towards 125.20 again. Else a rise above 126.80 could indicate fresh medium term bullishness which could turn bullish for Euro too, contrary to our current view of a gradual fall. Watch price action near 126.80.
Dollar Yen (111.61) is stuck above 111 for the last few sessions unable to decide which direction to take. At the same time, it has not been able to bounce to test 112.5 as expected. If the pair does not rise from here, it could move down towards 110-109 eventually. For now, it is likely to trade within 111-112 for 1-2 more sessions.
Aussie (0.7071) is trading lower. While below 0.7120, Aussie may come off towards 0.70-0.6950 in the near term. Immediate resistance is seen near 0.7150.
Pound (1.3257) is likely to see sideways movement within 1.32-1.34 region for a few sessions. But while important resistance at 1.34 holds, preference is for an eventual fall towards 1.31
USDCNY (6.7119) looks bearish on the weekly candles while there is also a decent support near 6.70 on the nearer term charts. There is equal possibility of moving on either direction from here. We would wait to see a sharp movement in the near term. For now, the pair may remain stable near current levels.
Dollar-Rupee (68.9675) moved up sharply yesterday. While there is scope for a rise towards 69.10 on the upside, a dip towards 68.60 is also a fair possibility. We would wait to see which direction the pair takes. Preference is for a test of 69.10 on the upside.
INTEREST RATES
The US yields have moved up.The 2YR (2.47%), 5Yr (2.43%), 10Yr (2.61%) and the 30YR (3.02%) are trading higher. A further rise towards 2.67% (10Yr), 3.10% (30Yr) and 2.5% (5Yr) looks likely for the near term. US yields are bullish.
The 10YR GOI (7.5357%) moved up yesterday from levels near 7.48%. A rise to 7.55% could be possible while above 7.45%. Trade within 7.45-7.55% is possible in the near term
UK 20YR (1.61%) is trading just above support levels and could soon see a rise towards 1.70% . This could also pull up the 5YR (0.87%) and 10Yr (1.19%) which could have some scope of falling towards 0.84% and 1.17% in the near term.
OPEC+ Unity Not as Strong as What the Headline Shows
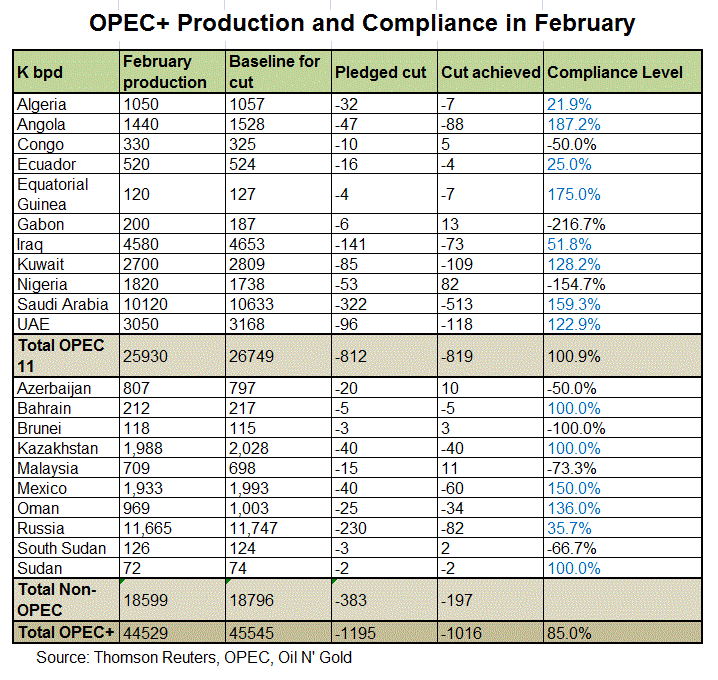
At the OPEC+ meeting over the weekend, the members hoorayed for the compliance to the production cut deal, which is expected to reduced output by 1.2M bpd for 6 months through June. As noted in the accompanied statement, “overall conformity reached almost 90%” in February, up from 83% in January. However, after a closer to the figures, it is discovered that not all participating countries adhered to their production quotas. Indeed, half of them either cut less than required or even increased production last month.
Using OPEC’s figures, the overall compliance of OPEC-11 was 105.5%. Saudi Arabia reduced output by 70% more than required. Meanwhile, only Gabon and Nigeria produced more than required. According to Thomson Reuters’ data, the overall compliance by OPEC-11 was 100.9%. Again, most of the output cut was shouldered by Saudi Arabia. The Kingdom reduced output by -513K bpd in February with a compliance level of 159.3%. Other members that cut more than required included Angola, Equatorial Guinea, Kuwait and UAE. The rest either reduced production less than required or produced exceeding their quotas.
For the 10 non-OPEC countries involving in the deal, Russia’s compliance level was merely 35.7%. That is, the countries only reduced output by -82M bpd from the baseline level, although it has agreed to cut by -230K bpd. Kazakhstan, the second largest producer in the group, fully complied with the quota while Mexico, the third largest, cut more than required with a compliance level of 150%. There are four countries (Azerbaijan, Brunei, Malaysia and South Sudan) increased production, instead of cutting, during the month.
In a surprising move, OPEC+ cancelled the meeting April as they required more time to assess the impact of US sanctions on Iran and Venezuela. Iran and Venezuela are currently exempted from production quotas. There is a risk that OPEC+ might decide not to extend the output cuts in the second half of the year, if they judge that the sanctions have significantly affected oil supply from Iran and Venezuela.
Fed to stand pat, release new projections, may announce end to balance sheet runoff
Fed is widely expected to keep interest rate unchanged at 2.25-2.50% today. Also the central bank is expected to reiterated that it's in no hurry to make another move. The language that "the Committee will be patient as it determines what future adjustments to the target range for the federal funds rate may be appropriate to support these outcomes" should be maintained .
There will be two major focuses for the announcement as well as press conference. Firstly, Fed's is known to be preparing for ending the balance sheet roll-off this year. The balance sheet surged from less than USD 1T in 2008 to hit a peak of USD 4.5T as a result of the quantitative easing program. It then started to be reduced by USD 50B per month since early last year. The detailed plan might be revealed today with specifics on when and how the runoff would end.
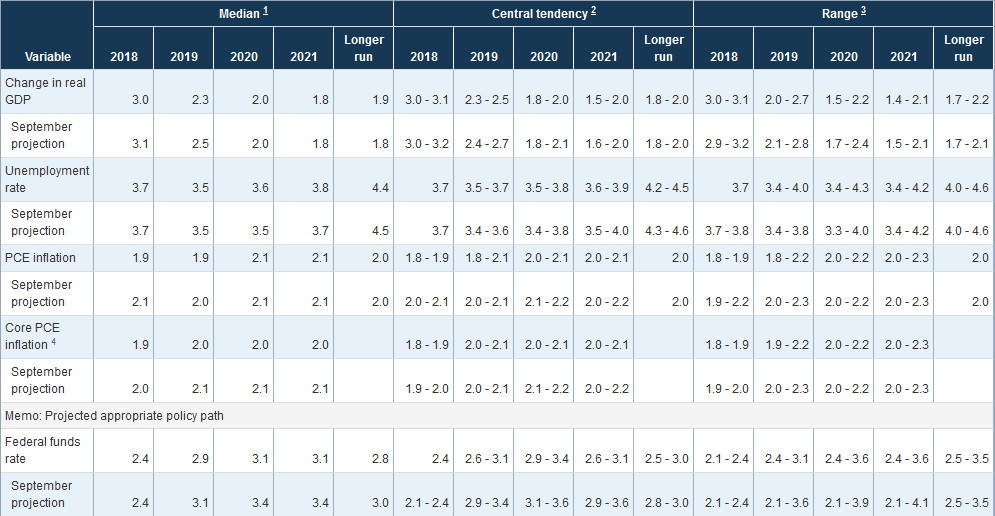
Fed will also publish first set of new economic projections after it shifted to a "patient" stance. Forecasts on GDP, unemployment rate and inflation are important as usual. But a crucial part is projection on federal funds rate. Back in December, the median forecast was for interest rate to rise to 2.9% in 2019, with central tendency at 2.6-3.1%. For 2020, media rate was at 3.1%. The longer run neutral rate was projected to be at 2.8%, with central tendency at 2.5-3.0%. Today's projections will hopefully answer questions like: Is there one or two expected rate hikes this year? Are some members expecting a rate cut? Where the neutral rate is? Will rate hike continue down the road to surpass neutral?
Here are Fed's December projections.
Below are some suggested readings on FOMC:
- FOMC Preview: Fed to Maintain Dovish Tone and Announce Plan to End Balance Sheet Reduction
- FOMC Preview: Is The Market Too Dovish On The Prospects For A 2019 Rate Hike?
- Fed to Clarify How Patient it Could Get With Rate Hikes
- FOMC Preview – Fed To Signal One More Rate Hike
- Two Thine Own Inflation Target Be True? Fed Policy Review Part 1
- Could the Fed Go Negative? Fed Policy Review Part 2
BoJ Jan minutes: Current policy stance appropriate as momentum towards 2% inflation target maintained
As revealed by minutes of January 22-23 BoJ meeting, "most members" believed it's appropriate to " persistently continue with the powerful monetary easing under the current guideline for market operations" as momentum towards 2% inflation target was maintained. Meanwhile, "many members" said it's necessary to take account of developments of developments in economic activity, and financial conditions in a "balanced manner".
The board also spent considerable amount of time discussing monetary policy stance in responses to downside risks. One member noted it was necessary to "devise ways to avoid a situation where an expectation that no policy change would occur for the time being would be fixed to an excessive degree in financial markets"
Another member noted that "it was not desirable to adopt a stance of not taking action until a serious crisis occurred". This member also said "it was necessary to emphasize the Bank's stance of taking swift, flexible, and decisive actions."
Gold Price Could Continue To Rise Near Term
Key Highlights
- Gold price found support near $1,292 recently and climbed above $1,300 against the US Dollar.
- There was a break above a key bearish trend line with resistance at $1,305 on the 4-hours chart of XAU/USD.
- The US Factory Orders increased 0.1% in Jan 2019 (MoM), less than the +0.3% forecast.
- The Fed Interest Rate Decision is scheduled later today (forecast 2.5%, versus 2.5% previous).
Gold Price Technical Analysis
After a significant decline, gold price found support near the $1,280 level against the US Dollar. The price started a fresh rebound, formed a swing low near $1,292, and extended gains above $1,300.
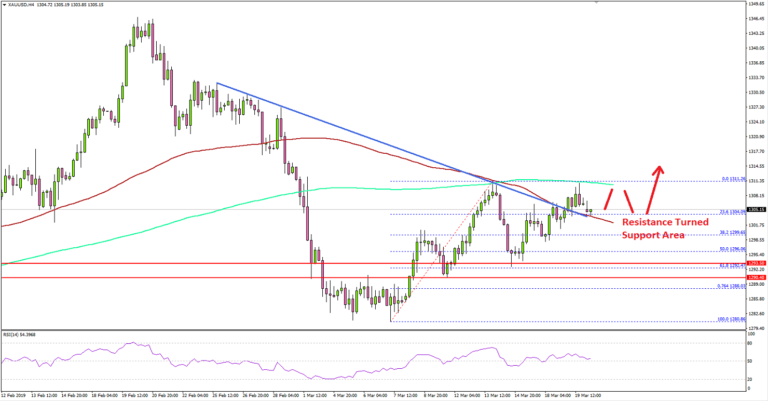
The 4-hour chart of XAU/USD indicates that the price corrected lower after trading as high as $1,311. It declined below the $1,300 support and the 50% Fib retracement level of the last wave from the $1,280 low $1,311 high.
However, the $1,292 area acted as a strong support along with the 61.8% Fib retracement level of the last wave from the $1,280 low $1,311 high. As a result, the price started a fresh upward move and broke the $1,300 and $1,305 resistance levels.
There was also a break above a key bearish trend line with resistance at $1,305 on the 4-hours chart of XAU/USD. It opened the doors for more gains above $1,305 and the 100 simple moving average (red, 4-hours).
Therefore, there are high chances of more gains above the $1,310 and $1,315 resistance levels in the near term. On the downside, the price is likely to find support near the $1,304 and $1,300 levels.
Fundamentally, the US Factory Orders report for Jan 2019 was released by the US Census Bureau. The market was looking for a 0.3% rise in orders in Jan 2019, compared with the previous month.
Though, the result was lower than the forecast as there was only 0.1% rise in orders, similar to the last reading. Besides, this was the second consecutive increase in the US Factory Orders.
Overall, gold price is gaining bullish momentum and it is likely to climb above $1,315 in the coming days. Looking at the major pairs such as EUR/USD and GBP/USD, a decent rebound is underway, with an increase in selling pressure on the greenback.
Economic Releases to Watch Today
- UK Producer Price Index (input) Feb 2019 (YoY) – Forecast +4.3%, versus +2.9% previous.
- UK Producer Price Index (Input) Feb 2019 (MoM) – Forecast +0.9%, versus -0.1% previous.
- UK Consumer Price Index Feb 2019 (YoY) – Forecast +1.8%, versus +1.8% previous.
- UK Core Consumer Price Index Feb 2019 (YoY) – Forecast +1.9%, versus +1.9% previous.
- Fed Interest Rate Decision – Forecast 2.5%, versus 2.5% previous.
High-level US-China trade talks to resume next week, aiming at a deal in April
It's reported, without confirmation from named officials, that high-level US-China trade talk are going to resume week in a push to close the deal by the end of April. US Trade Representative Robert Lighthizer and Treasury Secretary Steven Mnuchin would fly to Beijing in the week of March 25 to meet Chinese Vice Premier Liu He again. The following week, Liu He is expected to fly to Washington to continue the negotiations.
At the same time, it's reported that China is pushing back against some of the American demands on core issues. A key reason is the lack of assurance from Trump on lifting tariffs imposed. China is also said to be stepping back from the initial agreements over pharmaceutical data protection, patent linkages and refused to give ground on data-service issues. Nevertheless, some officials on both sides are seeing the "back-and-froth" as something expected in typical negotiations.
The date for signing a trade deal between the countries has been pushed back recently. While it's still possible to happen in April, the more probable occasion would be as sideline of G20 summit in Japan in June. Meanwhile, in his typical rhetorics, Trump said at the White House yesterday that "talks with China are going very well".
Daily Markets Broadcast
Wall Street falters on talk of trade roadblocks
Wall Street indices were mostly lower yesterday though the NAS100 index eked out small gains. Talk that China was walking back some trade deal offers hit sentiment. Meanwhile, US negotiators are heading to Beijing next week. The Fed concludes its two-day policy meeting later today, with no change in rates or outlook expected.
US30USD Daily Chart
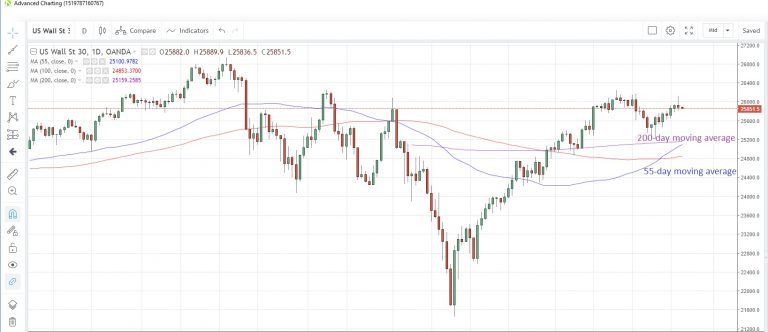
The US30 index closed lower yesterday, snapping a two-day winning streak, after touching a two-week high
The 55-day moving average at 25,101 looks poised to cross above the 200-day moving average at 25,159 in the next day or so. It crossed above the 100-day moving average on March 13
The FOMC concludes its two-day meeting later today, with no change in rates or stance expected. It will also release new economic projections, which are expected to show some downgrades.
DE30EUR Daily Chart
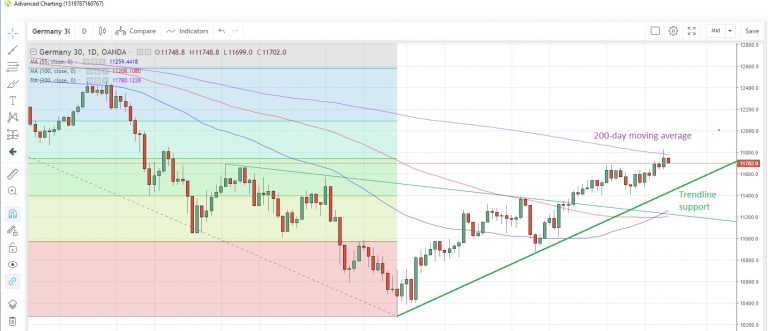
The Germany30 index rallied to the highest in five months yesterday, buoyed by an improvement in Germany’s ZEW survey in March
The index tested the 200-day moving average at 11,785 for the first time since August 1. Rising trendline support has shifted to near 11,450
The German ZEW economic sentiment survey for March improved to -3.6 from -13.4 with expectations for a -11.0 reading. That was the best reading in a year.
WTICOUSD Daily Chart
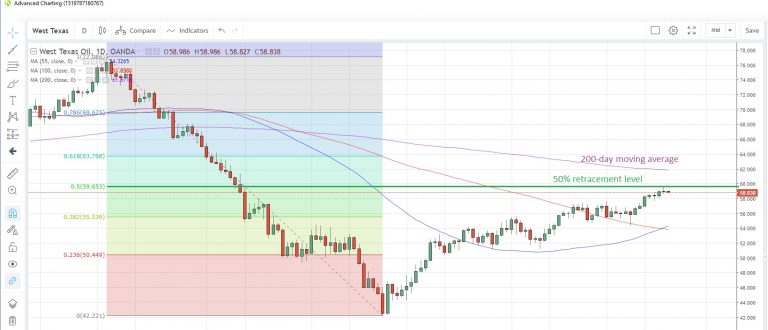
WTI advanced for the sixth day in seven days yesterday, climbing to the highest since November 12 before retreating following the China trade negotiations news
The rally stalled just at the 50% retracement level of the October-December drop at $59.653
The EIA weekly report on crude stocks is expected to show a drawdown of 775,000 barrels in the week to March 15. That would be the second weekly reduction in a row following last week’s -3.86 million barrel hit.