Sample Category Title
EUR/JPY Daily Outlook
Daily Pivots: (S1) 126.17; (P) 126.39; (R1) 126.70; More....
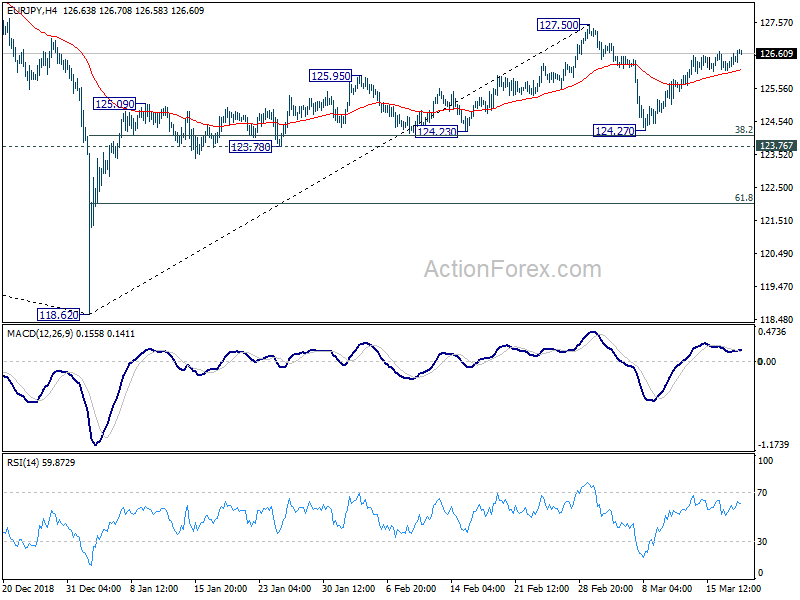
EUR/JPY's rebound from 124.27 resumes today and focus back on 127.50 resistance. Decisive break there will resume whole rise from 118.62 and target 129.50 resistance next. In case of another fall, near term outlook will remain bullish as long as 124.23 cluster support (38.2% retracement of 118.62 to 127.50 at 124.10) holds.
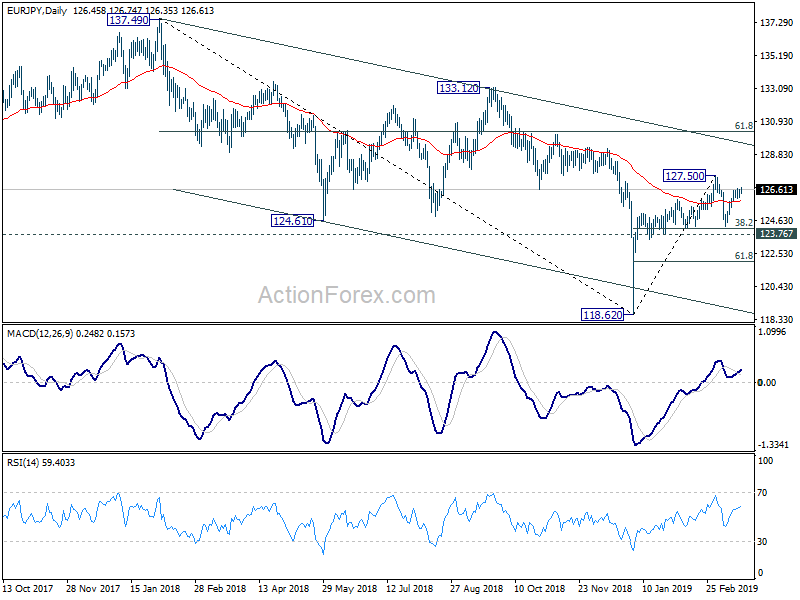
In the bigger picture, current development argues that medium term decline from 137.49 (2018 high) has completed with three waves down to 118.62 already. Decisive break of 133.12 resistance will confirm this bullish case. And whole up trend from 109.03 (2016 low) might resume through 137.49 in that case. On the downside, break of 124.23 support will invalidate this case. And in such case, the down trend from 137.49 could possibly resume through 118.62.
EUR/GBP Daily Outlook
Daily Pivots: (S1) 0.8538; (P) 0.8554; (R1) 0.8575; More...
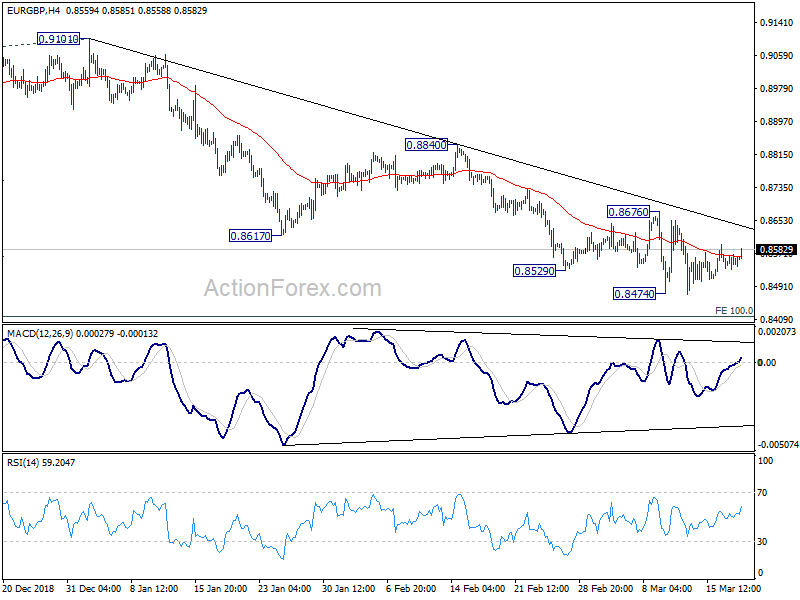
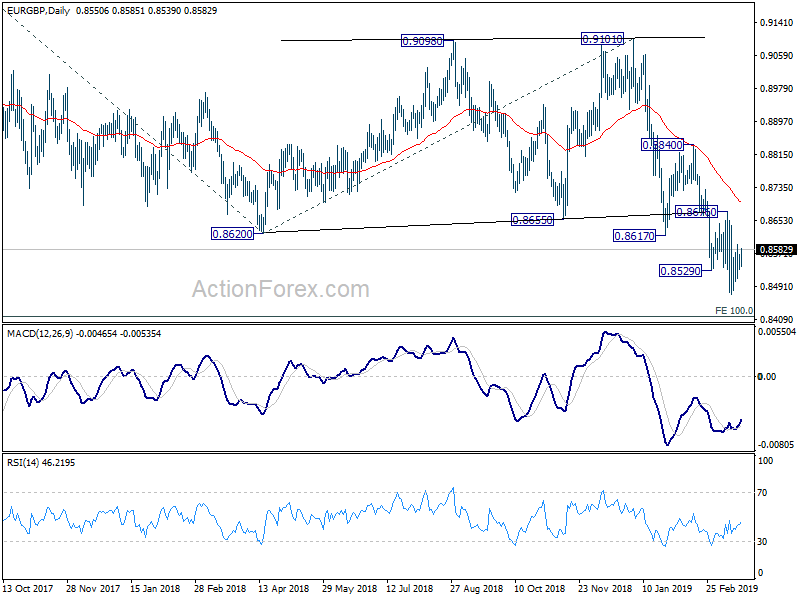
Intraday bias in EUR/GBP remains neutral as consolidation from 0.8474 is in progress. More sideway trading could be seen. But with With 0.8676 resistance intact, further decline is expected. Firm break of 0.8474 will resume larger down trend to 0.8416 long term projection next. However, on the upside, decisive break of 0.8676 will indicate short term reversal and bring further rise to 0.8840 resistance.
In the bigger picture, EUR/GBP is seen as staying in long term range pattern started at 0.9304 (2016 high). Current fall from 0.9305 (2017 high), is a falling leg inside the pattern. Such decline is now targeting 100% projection of 0.9305 to 0.8620 from 0.9101 at 0.8416 and possibly below. But for now, we'd expect strong support around 0.8312 support to contain downside and bring rebound.
EUR/AUD Daily Outlook
Daily Pivots: (S1) 1.5966; (P) 1.5995; (R1) 1.6042; More...
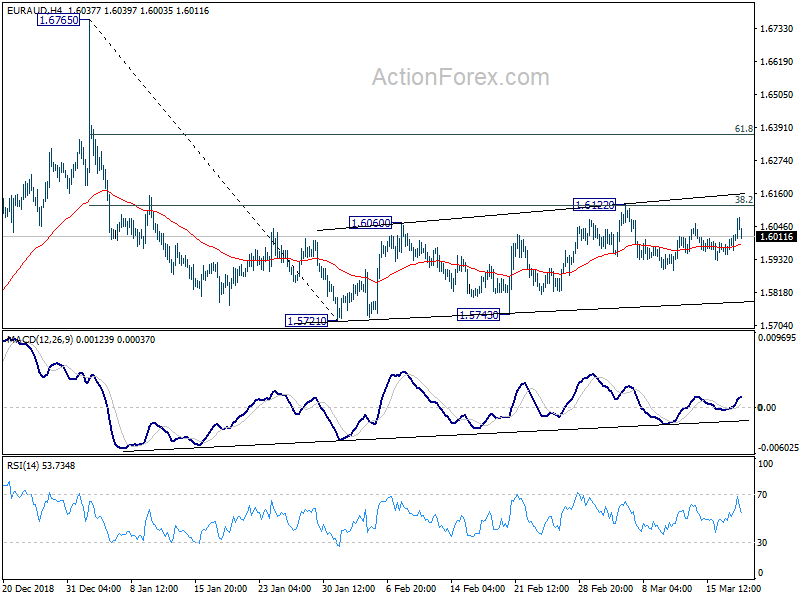
Intraday bias in EUR/AUD remains neutral as consolidation from 1.5721 is extending. On the downside, break of 1.5721 low will resume the decline from 1.6765 and target 1.5346 support. On the upside, above 1.6122 will resume the corrective rise from 1.5721 instead.
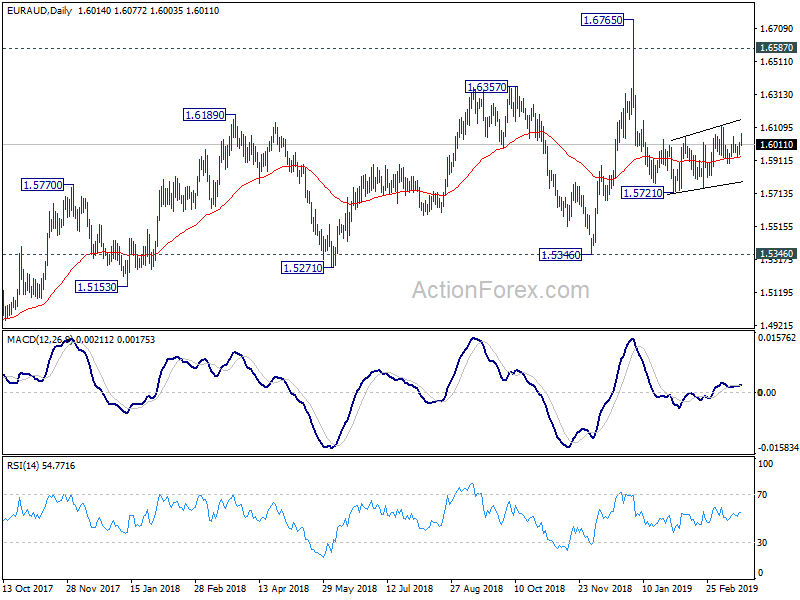
In the bigger picture, as long as 1.5346 support holds, outlook will remain bullish. Uptrend from 1.1602 (2012 low) is expected to resume sooner or later. Break of 1.6765 will target 61.8% retracement of 2.1127 (2008 high) to 1.1602 at 1.7488 next. However, firm break of 1.5346 key support will indicate trend reversal, with bearish divergence condition in weekly MACD, and turn outlook bearish.
ETHUSD Bulls Still In Control
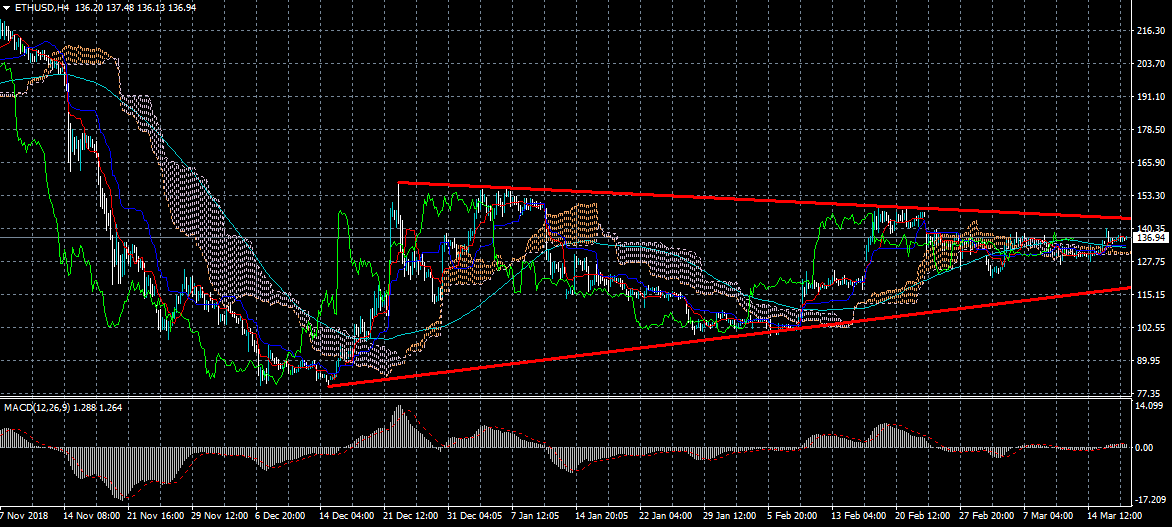
Ethereum is edging closer to major trendline resistance on Wednesday as short-term bulls continue to retain control of the second largest cryptocurrency. The ETHUSD pair has now broken above the Ichimoku cloud on the four-hour time frame, with the $145.00 level the strongest form of resistance above. If bulls can break above triangle resistance, the overall bullish projection of the pattern would take the ETHUSD pair above the $200.00 level.
The ETHUSD pair is bullish while trading above the $130.00 level, key resistance is found at the $155.00 and $175.00 levels.
If the ETHUSD pair trades below the $130.00 level, key support is found at the $125.00 and $118.00 levels.
EURUSD Struggling With 1.1360
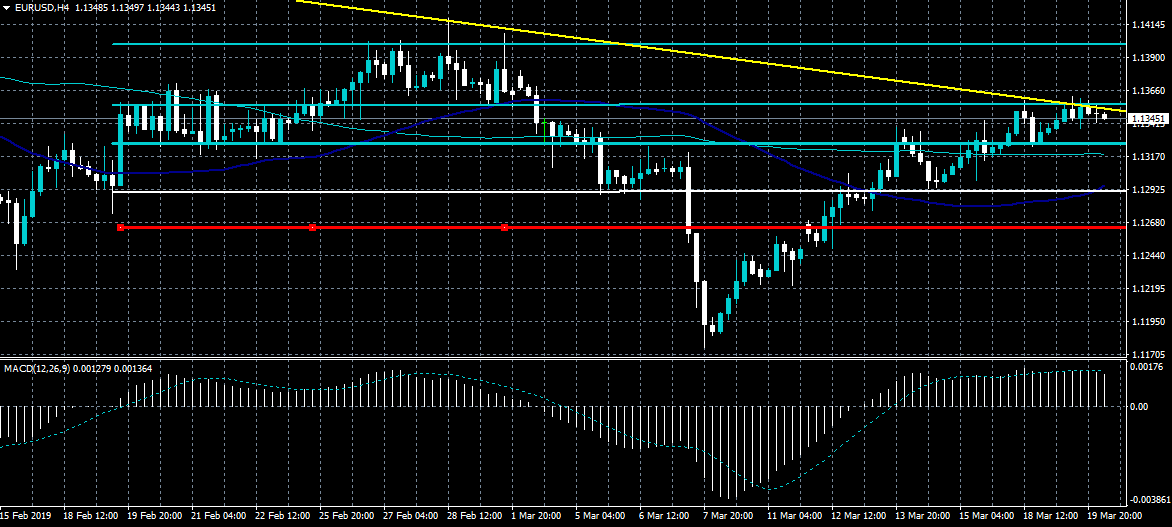
The euro is struggling to break above the key 1.1360 resistance level against the US dollar on Wednesday, as traders await the FOMC monetary policy decision later today. The EURUSD pair may test back towards the 1.1290 level if bulls fail to break the 1.1360 level. A strong advance above the 1.1360 level will likely provoke buying towards the 1.1400 level, with extended resistance found at the 1.1454 level.
The EURUSD pair is only bullish while trading above the 1.1360 level, key technical resistance is found at the 1.1400 and 1.1454 levels.
If the EURUSD pair starts to turn lower, sellers may test back towards the 1.1325 and 1.1290 levels.
EUR/CHF Daily Outlook
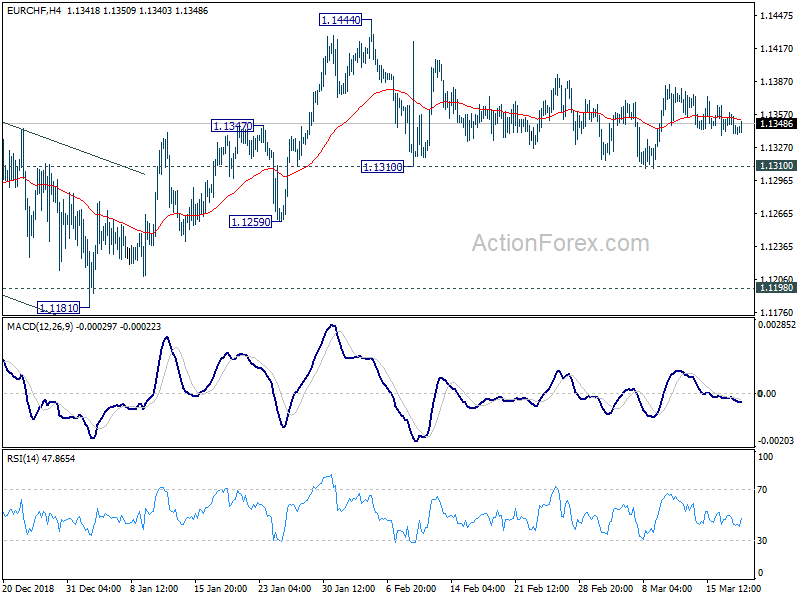
Daily Pivots: (S1) 1.1334; (P) 1.1347; (R1) 1.1354; More...
EUR/CHF is still gyrating in consolidation from 1.1444 and intraday bias remains neutral. More sideway trading could be seen. But with 1.1310 support intact, further rise is still expected. On the upside, firm break of 1.1444 resistance will resume the rebound from 1.1181 and target 1.1501 key resistance next. On the downside, firm break of 1.1310 will indicate completion of the rebound. In that case, intraday bias will be turned back to the downside for 1.1181 low again.
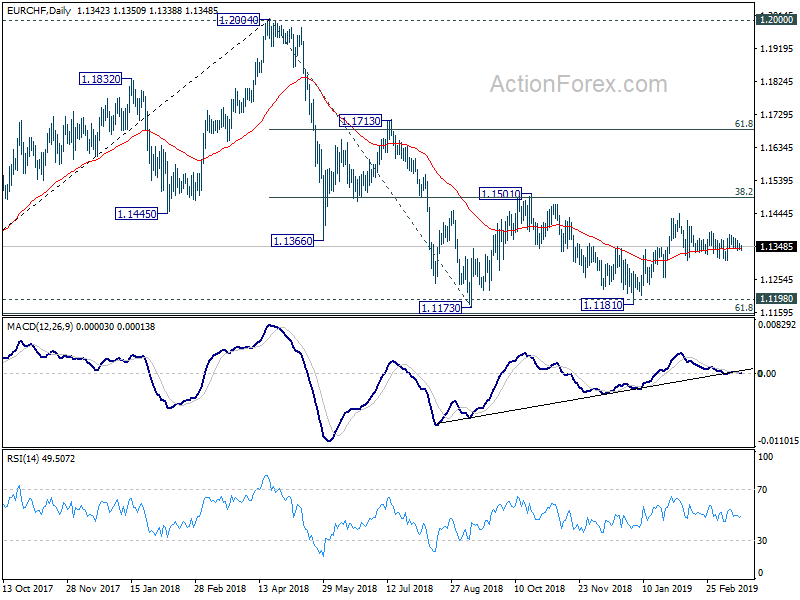
In the bigger picture, price actions from 1.2004 medium term top is seen as a correction only. Downside should be contained by 1.1154/98 support zone to complete it and bring rebound. Decisive break of 1.1501 (38.2% retracement of 1.2004 to 1.1173 at 1.1490) will confirm completion of the correction. Further rise should be seen to 61.8% retracement at 1.1687 and above next.
USDJPY Moves Back To Weekly Pivot
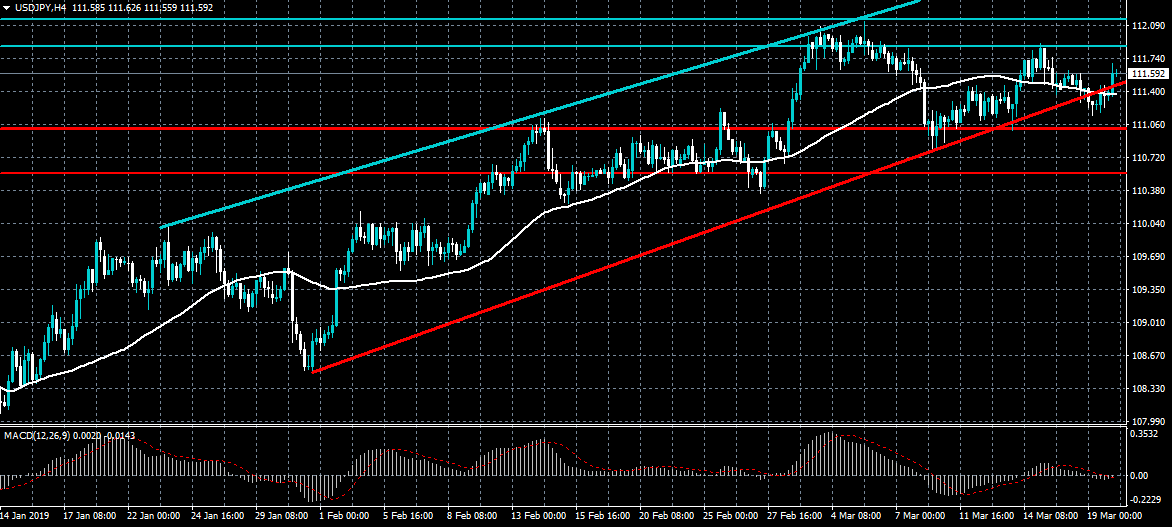
The US dollar has recovered higher against the Japanese yen currency after sellers failed to hold price below key trendline support from the rising price channel on the four-hour time frame. Bulls need to break above the 111.80 level to negate a potential triple top pattern formation and push price above the 112.15 resistance level. Sellers will have to force the USDJPY pair under the 110.80 level in order to create a bearish lower weekly low.
The USDJPY pair is bullish while trading below the 111.80 level, key resistance is found at the 112.15 and 112.80 levels.
If the USDJPY pair trades below the 111.45 level, sellers may test towards the 110.80 and 110.45 support levels.
AUDUSD Consolidates Within Ichimoku Cloud, Lacks Direction
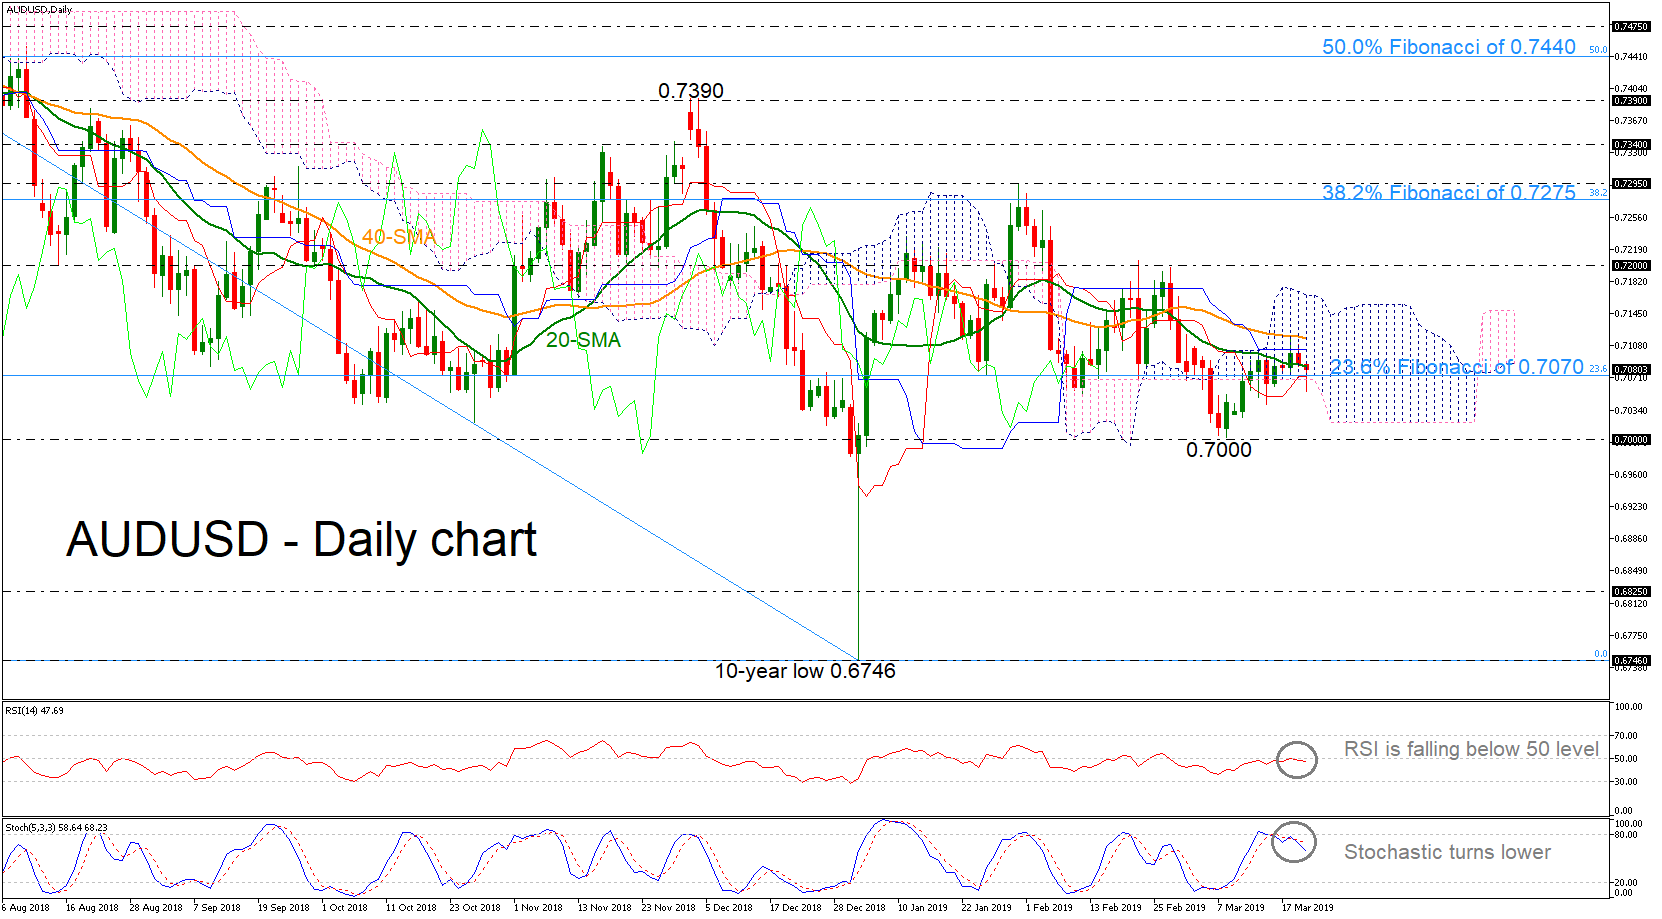
AUDUSD has rebounded somewhat after falling to the 0.7000 psychological level on March 8 but is still moving with weak momentum within the Ichimoku cloud in the daily timeframe. The price is currently developing around the 23.6% Fibonacci retracement level of the downleg from the 32-month high of 0.8135 to the 10-year low of 0.6746, near 0.7070 and between the red Tenkan-sen and blue Kijun-sen lines.
The momentum indicators now suggest that the market sentiment might get worse before getting better as the stochastic is reversing back to the downside after the bearish cross within %K and %D lines. The RSI also looks to be changing direction, moving down below the 50 neutral threshold.
Should the price retreat further, immediate support is coming from the lower bound of the Ichimoku cloud around 0.7020, before dropping towards the 0.7000 handle. A successful decline below this line could drive the pair until the 0.6825 support, where it bottomed on January 2016 and then would rest near 0.6746, identified by the low on January 3. Lower still, a violation of the 10-year low would increase speculation that a bearish phase is in progress.
In the alternative scenario, traders would be eagerly looking for a break above the 40-daysimple moving average to increase buying orders towards the upper band of the Ichimoku channel near 0.7170. If bullish forces appear even stronger, the 0.7200 key level should be another resistance to keep in mind, while more upside pressure could touch the 38.2% Fibonacci of 0.7275.
Summarizing, in the long-term, AUDUSD stands in a narrow range within the 0.7000-0.7390 area over the last seven months.
EU Juncker reiterates no re-negotiation, UK May to request short Brexit delay
European Commission President Jean-Claude Juncker reiterated the EU's stance on Brexit with Germany's Deutschlandfunk radio. He said "there will be no re-negotiations, no new negotiations, no additional guarantees in addition to those already given". He added "we have intensively moved towards Britain, there can be no more."
Juncker also hinted at another EU summit next week and said "my view this morning at quarter past 8 is that we will not get this through this week and we will have to meet again next week".
Separately, both BBC and Sky reported that UK Prime Minister Theresa May will request only a short delay to Brexit in her letter to European Council President Donald Tusk today. But the actual length will only be confirmed when the letter is published.
Education Secretary Damian Hinds also said "I don't see how a long delay gives certainty. Actually we've had long time already... People are a bit tired of waiting for parliament to get our act together and get the deal passed... Unless and until a deal is finalized, there remains the prospect of the risk of no deal."
GBPJPY Struggles To Clear 148 Region, Signals Neutral In Short Term
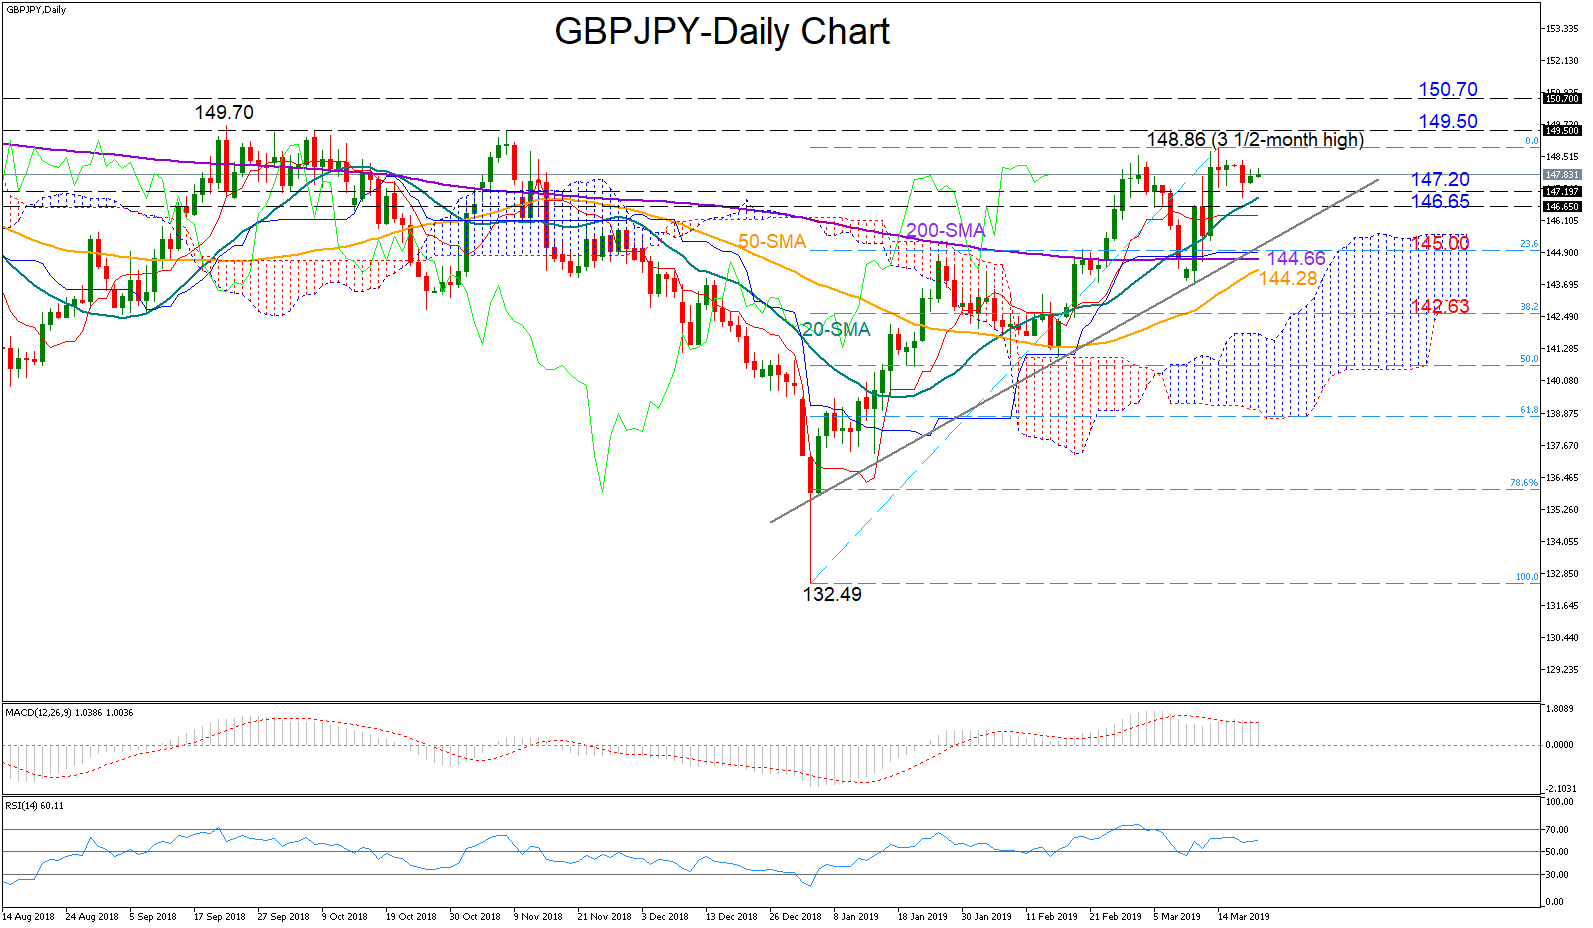
GBPJPY slid sideways after it found strong resistance just shy of the 149 handle for the second time this month. In the short term, the consolidation phase may continue as the RSI has yet to show clear direction, while the MACD is easing towards its red signal line, backing this view as well. Nevertheless, as long as the former holds above 50 and the latter above its red line, chances for upside movements are higher.
On the upside, the pair would push hard to breach its previous peak of 148.86, which is the highest reached in more than 3 months. Topping this level, a more concrete barrier could probably appear around 149.50. Should the market break this ceiling as well, the next key resistance could arise near 150.70.
In the negative scenario, a decline below the 147.20-146.65 support area could pressure the price towards 145, located in the crossroads of the 23.6% Fibonacci level of the upleg from 132.49 to 148.86 and the upward trendline drawn from the 135.79 low. A decisive close below that point and more importantly a drop under the 50-day moving average currently at 144.28 could trigger a steeper sell-off, shifting attention down to the 38.2% Fibonacci of 142.63.
Turning to the medium-term picture, GBPJPY is maintaining a positive profile thanks the higher highs and higher lows registered during the past three months. A rally above the 149.50 may confirm the start of a new bullish cycle.