Sample Category Title
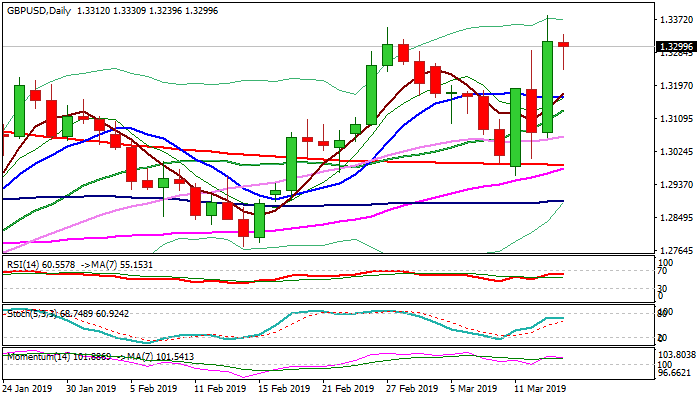
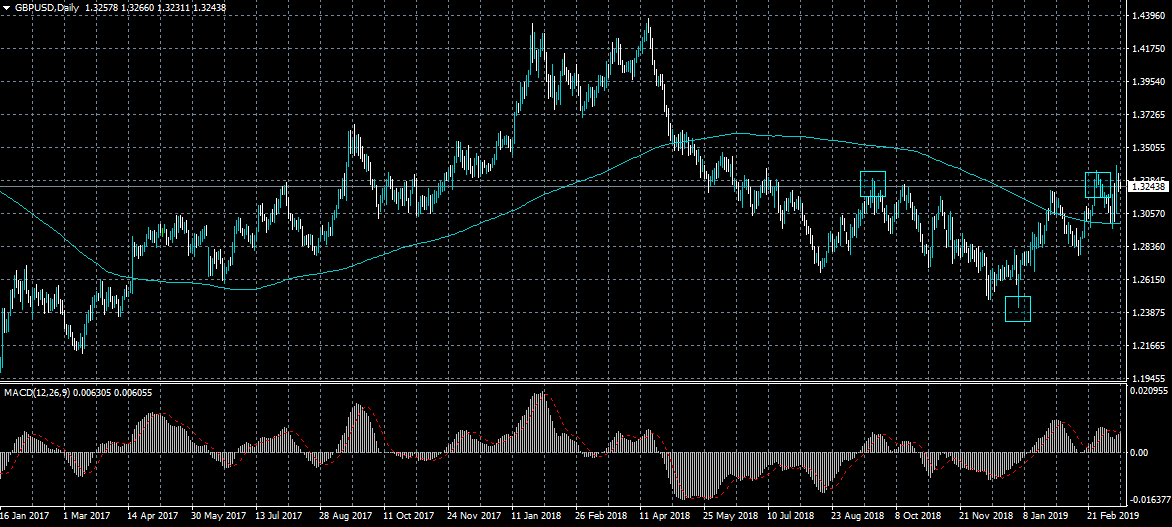
GBP/USD Outlook: Sterling Stands At The Back Foot After Parliament Voted For Brexit Delay
Cable ticked lower to 1.32 handle at the beginning of European session on Friday, following narrow range trading in Asia, after UK parliament voted for Brexit delay. The lawmakers approved short delay in attempts to agree Brexit deal until 20 March, with option for further extension if no deal can be agreed by that time. The parliament also rejected the scenario of a second Brexit referendum that was also on the table, giving the last chance to PM May to get her twice-rejected Brexit plan approved by Britain's parliament next week, just before 21 Mar Eurogroup meeting. Eventual agreement approval would be the first step as all 27 EU member countries need to vote for Brexit extension and caution is required as the bloc members may not approve it. Sterling would be inflated and would possibly rise towards key Fibo barrier at1.3620, if UK parliament approves the deal next week, but could remain highly volatile and dip further if the plan will be rejected again. Sterling stands at the back foot in early Friday's trading, following Thursday's close in red after hitting new multi-month high but failing to sustain gains above previous peaks. Bulls are taking a breather and awaiting fresh signals, as daily indicators are mixed (momentum is weakening, stochastic heads north while RSI is flat) but MA's remain in bullish setup. Corrective dips could extend further but need to hold above 10SMA (1.3165) in order not to harm bulls and keep focus at the upside. Weekly studies show more positive signals as indicators are trending up and repeated penetration of weekly cloud generated positive signal which requires confirmation on weekly close within the cloud (cloud base lays at 1.3248) that would unmask cloud top (1.3519) and 200WMA (1.3585). Near-term structure would weaken on break and close below 10SMA that would open way for deeper pullback from new high at 1.3381 through rising 20SMA (1.3146) towards 1.3066 (30SMA) and possible extension towards converged 55/200SMA's (1.2989).
Res: 1.3266, 1.3330, 1.3349, 1.3381
Sup: 1.3202, 1.3165, 1.3146, 1.3066
USDCAD Bears Meet A Wall Around 1.3285, Stochastics Oversold
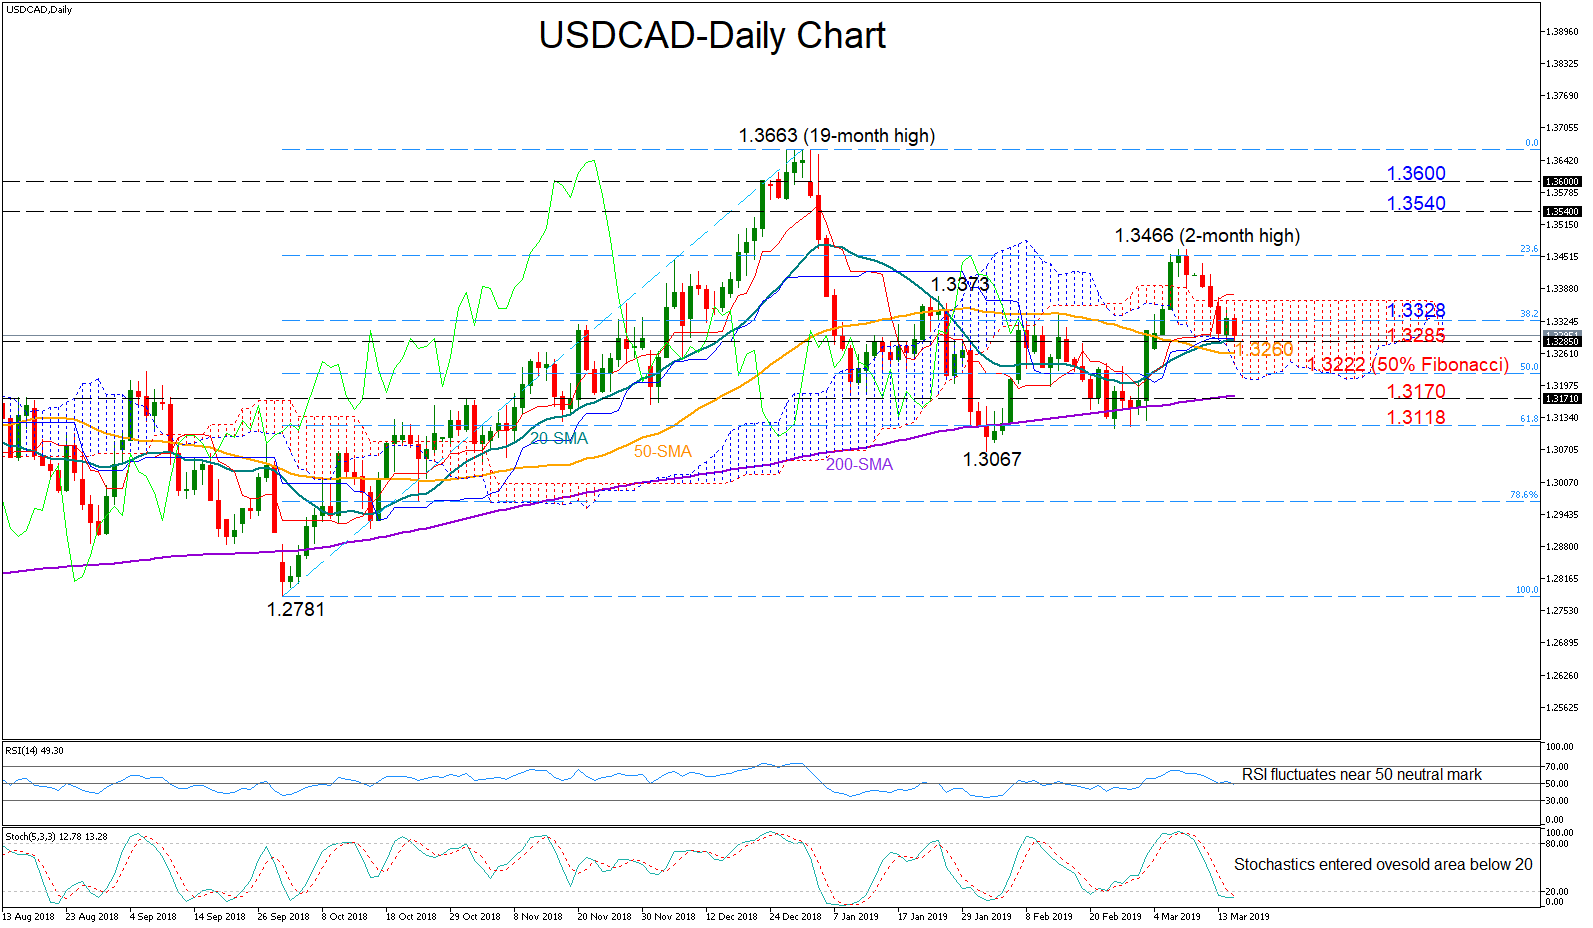
USDCAD has been trading to the downside this week but the 1.3285 level appeared a hurdle for the bears to overcome over the past two sessions. The RSI is hovering around 50, framing a neutral picture for the short term. Yet with the fast-stochastics set for a bullish cross below the 20 oversold mark, chances for an upside reversal are considerably increasing.
If the 1.3285 key number successfully stops negative pressure, sending the price higher, immediate resistance is expected to be found around 1.3328, where the 38.2% Fibonacci of the upleg from 1.2781 to 1.3663 is placed. Clearing this area, the next target could be the 2-month high of 1.3466, which if beaten could enhance buying confidence towards 1.3540-1.36, a crucial resistance area during 2016.
Should bearish forces retake control, the 50-day moving average (MA) at 1.3260 and the 50% Fibonacci of 1.3222 could curb downside movements before the 200-day MA at 1.3170 comes into view. A drop below the latter and more importantly a decisive close under the 1.3118 support could wind down interest for the pair.
In the medium-term timeframe, the market is in a range, trading between 1.3663 and 1.3067. Any violation of these boundaries could change the outlook accordingly.
USDJPY Still Bullish
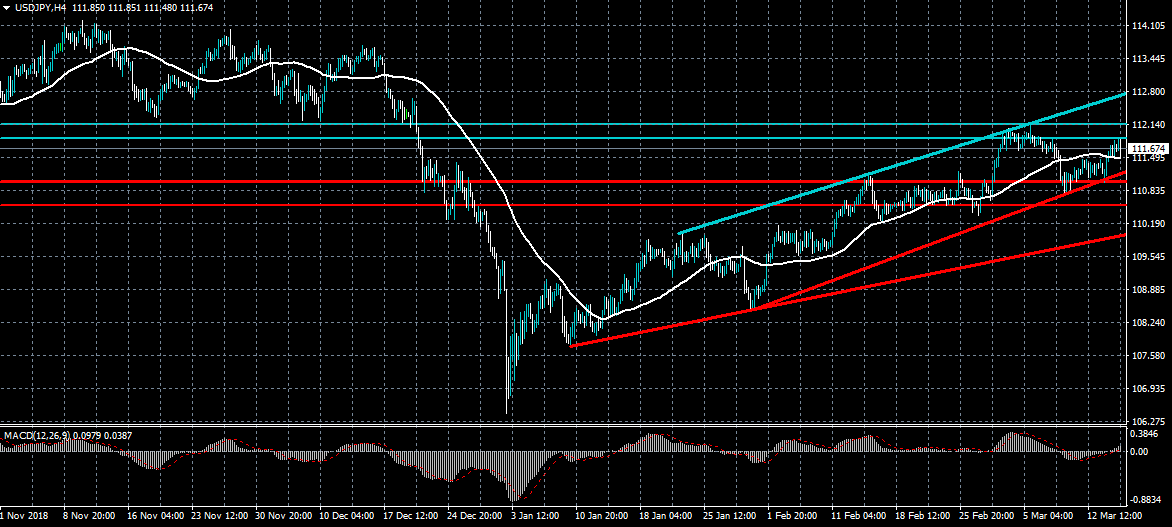
The US dollar is holding above key weekly technical support against the Japanese yen currency, with the earlier Bank of Japan policy meeting having only a limited effect on the pair. Buyers still retain intraday control of the USDJPY pair and are likely to target a bullish weekly price close above the 112.00 level. The MACD indicator on the four-hour time frame is also trending higher and signaling that pressure remains to the upside.
The USDJPY pair is intraday bullish while trading above the 111.60 level, key resistance is found at the 112.00 and 112.20 levels.
If the USDJPY pair trades below the 111.60 level, sellers may test towards the 111.45 and 111.30 support levels.
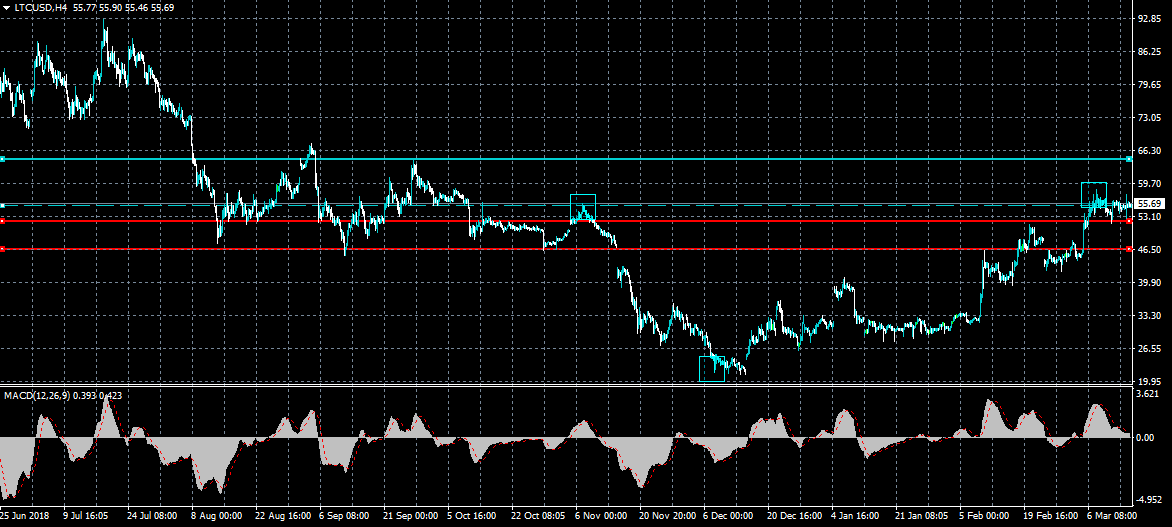
LTCUSD Bullish Bias Above $54.00
Litecoin continues to trade around the best levels of the year, with the LTCUSD pair well-supported on any technical pullbacks. The fourth largest cryptocurrency by market capitalization holds a strong intraday bullish bias while trading above the $54.00 level. The $51.80 level is minor technical support, while the $42.00 level offers critical weekly support for the LTCUSD pair.
The LTCUSD pair is strongly bullish while trading above the $54.00 level, key technical resistance is found at the $59.00 and $65.00 levels.
If the LTCUSD pair trades below the $51.80 level, key support is found at the $45.00 and $42.00 levels.
GBPUSD 1.3300 Key Resistance
The British pound continues to firm above the 1.3200 level against the US dollar, with the volatile currency pair still enjoying strong dip-buying demand. GBPUSD bulls have been struggling to hold price above the 1.3300 resistance level this week. The 1.3300 level is critically important, as it represents the neckline of a bullish inverted head and shoulder pattern on the four-hour time frame.
The GBPUSD pair is intraday bullish while trading above the 1.3200 level, key technical resistance is found at the 1.3300 and 1.3388 levels
If the GBPUSD pair trades below the 1.3200 level, sellers may test towards the 1.3155 and 1.3100 support levels.
Yen Strengthens As BoJ Leaves Rates Unchanged
The Japanese Yen strengthened against the USD after the BOJ released its interest rates decision. The bank left rates unchanged at minus 0.1% and said that it will continue with the 10-year Japanese Government Yields at about zero percent. The two decisions were what the market was expecting. In the statement, the bank highlighted the ongoing problem of global growth, which will likely affect the country’s exports. This slow growth comes at a time when rates are in the negative zone and its inflation target of 2% looks less attainable.
Drama in the UK parliament continued as the members voted to delay the country’s departure from the European Union. The motion was brought by the government, to delay Brexit by three months, and won the vote by 412 to 202. This came a day after the members voted to prevent a no-deal Brexit and two days after they rejected Theresa May’s deal. The premier will again try to find a compromise before the March 29 deadline. This extension will make it difficult for UK companies to plan, foreign investors to invest and for individuals to plan ahead.
The euro gained against the USD in overnight trading ahead of key inflation numbers from the EU. The numbers are expected to show that consumer prices rose by 1.5% in February. This will be unchanged from the previous month. On a MoM basis, the headline CPI grew by 0.3%, which was higher than the January’s minus 1.0%. The core CPI is expected to remain unchanged at an annual and monthly rate of 1.0% and 0.3% respectively. This comes after last week’s central bank decision to leave rates unchanged and extend any possibility of a rate hike from end of summer till end of the year.
EUR/USD
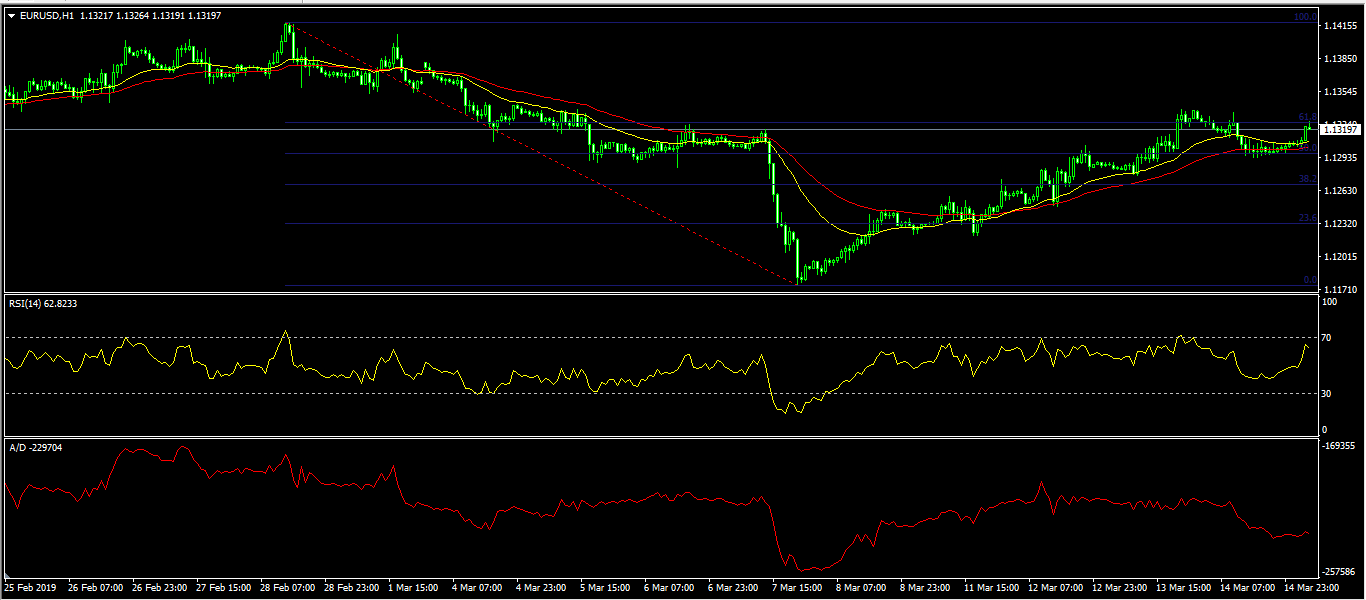
The EUR/USD pair rose to a high of 1.1325, which was along the 61.8% Fibonacci Retracement level. It was also the highest level since Monday this week. On the hourly chart, this price is slightly above the 50-day and 25-day EMAs as the RSI approach the 70 level and the accumulation and distribution indicator moves lower. The pair will likely continue moving higher, although this could change depending on the EU inflation numbers.
USD/JPY
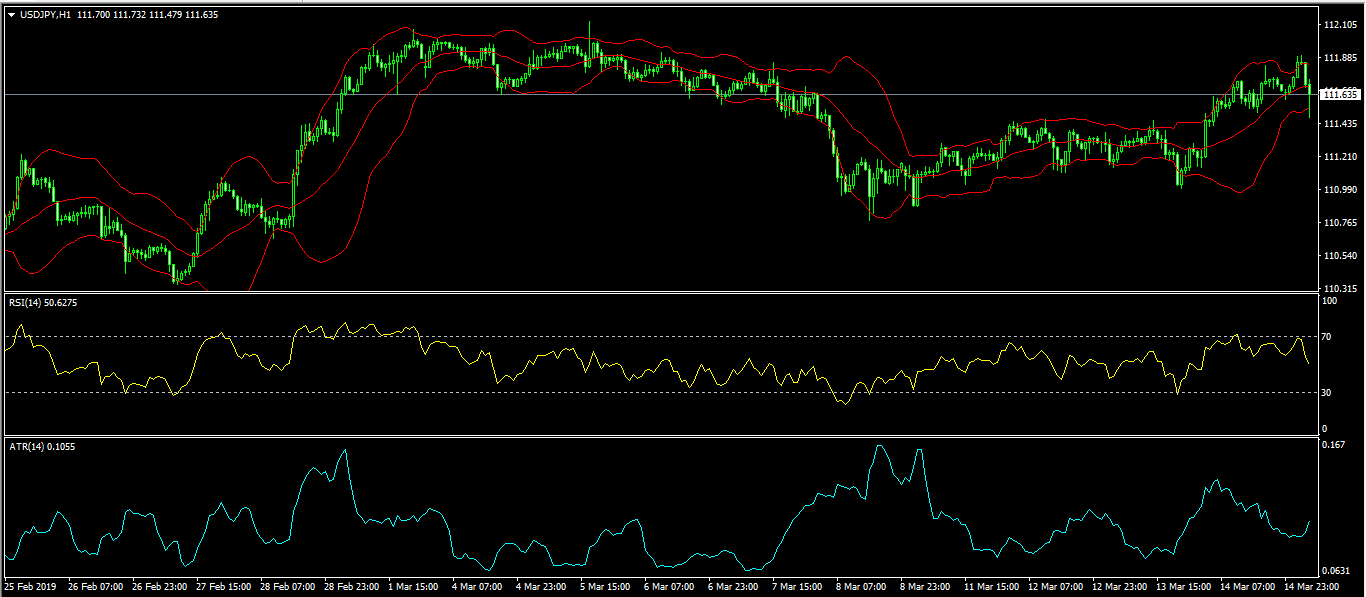
The USD/JPY pair declined after the BOJ decision earlier today. The pair reached a low of 111.48, and then pared some of those losses. This price is along the lower line of the Bollinger Bands on the hourly chart while the RSI has dropped from 70 to the current 50. The Average True Range (ATR) indicator has also started moving up. The pair will likely resume the upward trend and test the important level of 111.88.
XBR/USD
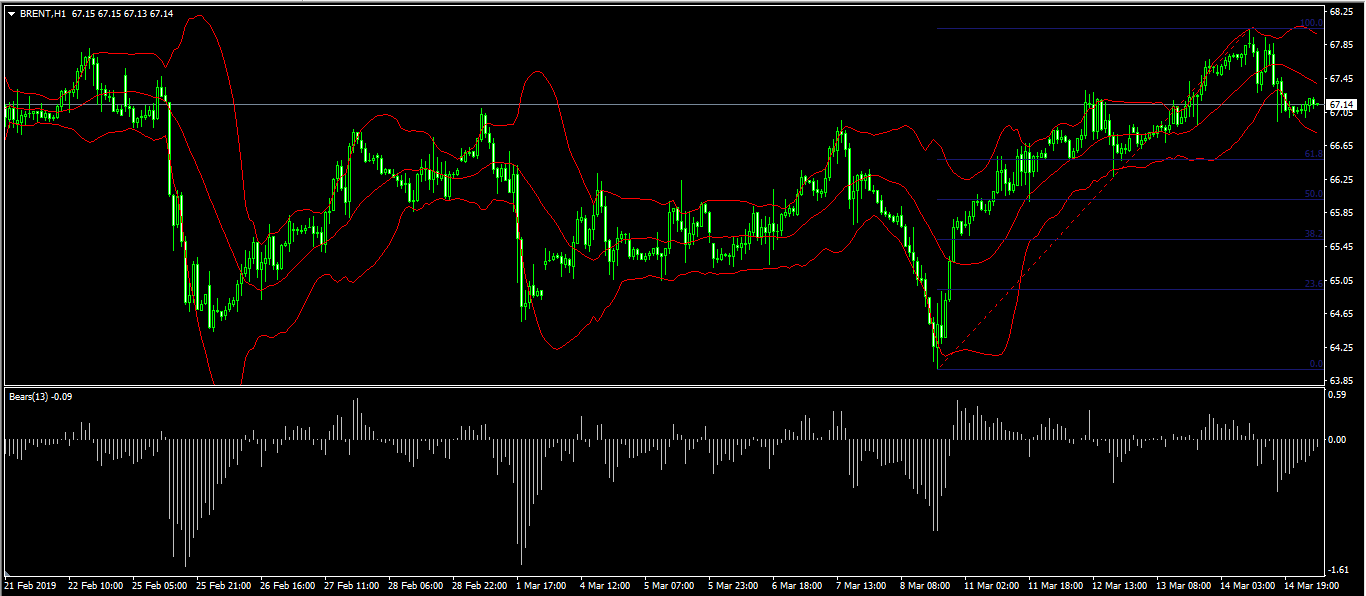
The price of Brent crude oil declined even after a report showed that OPEC was continuing to slash production. The pair reached an intraday low of 66.90. On the hourly chart, this price was between the 100% and the 61.8% Fibonacci Retracement level. It is also between the middle and upper line of the Bollinger Bands while the Bears Power strength is easing. The pair could drop to the 61.8% Fibonacci level of 66.50 before starting a fresh upward trend.
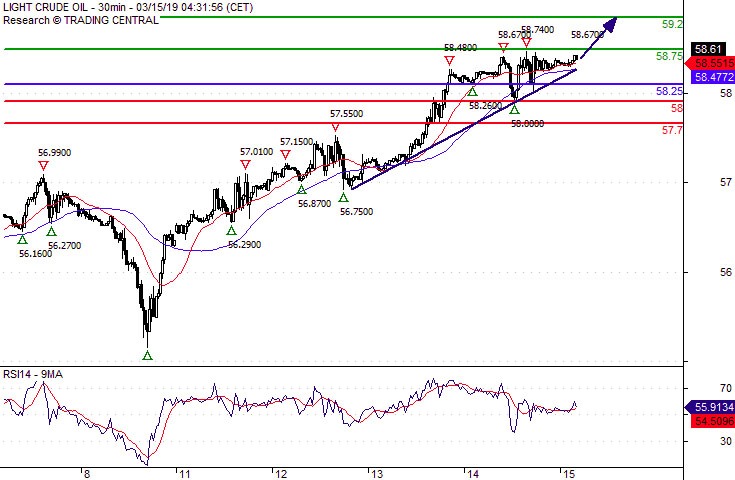
Crude Oil Further Advance
Pivot (invalidation): 58.25
Our preference Long positions above 58.25 with targets at 58.75 & 59.20 in extension.
Alternative scenario Below 58.25 look for further downside with 58.00 & 57.70 as targets.
Comment The RSI calls for a new upleg.
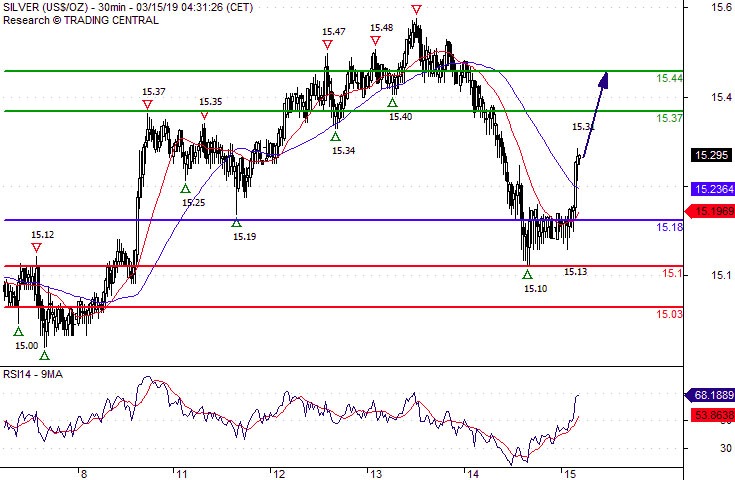
Silver Spot Rebound
Pivot (invalidation): 15.1800
Our preference Long positions above 15.1800 with targets at 15.3700 & 15.4400 in extension.
Alternative scenario Below 15.1800 look for further downside with 15.1000 & 15.0300 as targets.
Comment The RSI calls for a rebound.
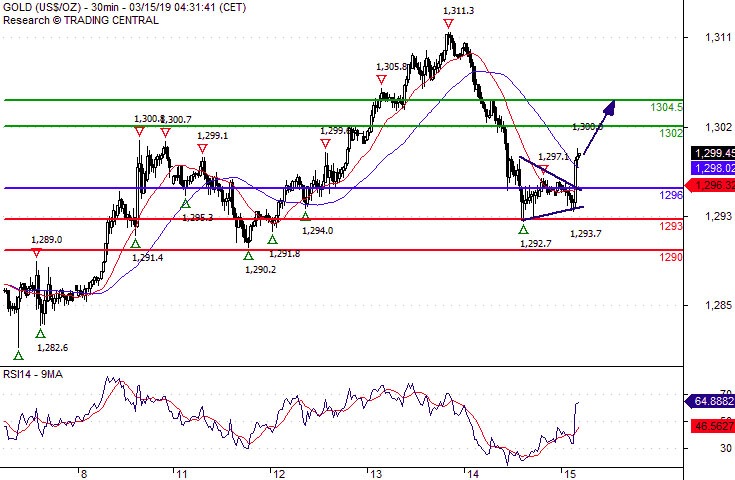
Gold Spot Rebound Expected
Pivot (invalidation): 1296.00
Our preference Long positions above 1296.00 with targets at 1302.00 & 1304.50 in extension.
Alternative scenario Below 1296.00 look for further downside with 1293.00 & 1290.00 as targets.
Comment The RSI calls for a rebound.
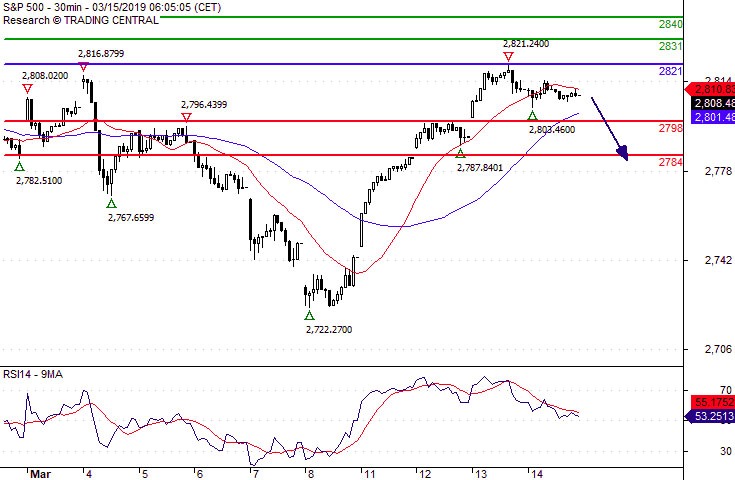
S&P 500 Under Pressure
Pivot (invalidation): 2821.00
Our preference Short positions below 2821.00 with targets at 2798.00 & 2784.00 in extension.
Alternative scenario Above 2821.00 look for further upside with 2831.00 & 2840.00 as targets.
Comment The RSI lacks upward momentum.