Sample Category Title
British Pound Trading A Tad Lower In The Morning Session
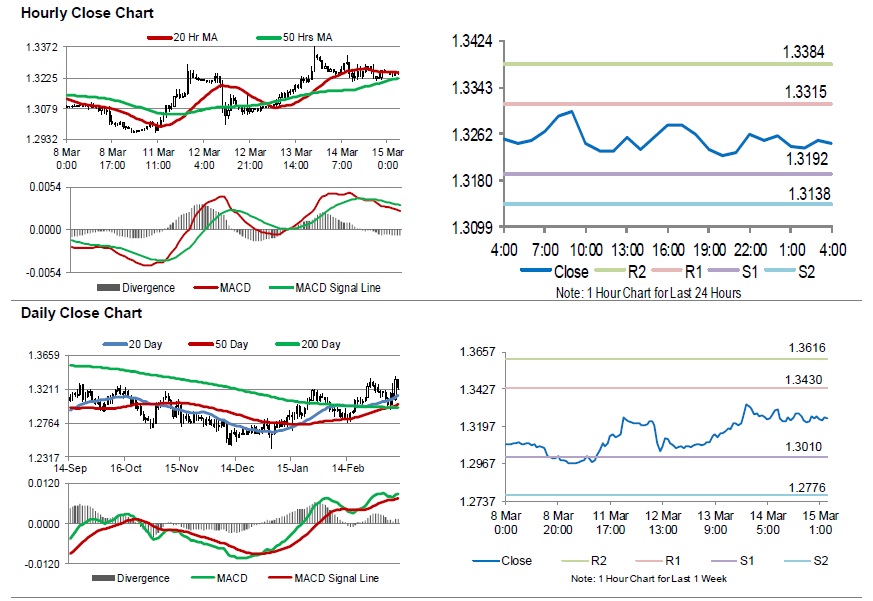
For the 24 hours to 23:00 GMT, the GBP declined 0.44% against the USD and closed at 1.3250.
In the Asian session, at GMT0400, the pair is trading at 1.3245, with the GBP trading slightly lower against the USD from yesterday’s close.
The pair is expected to find support at 1.3192, and a fall through could take it to the next support level of 1.3138. The pair is expected to find its first resistance at 1.3315, and a rise through could take it to the next resistance level of 1.3384.
Going forward, traders would closely monitor UK’s Rightmove house price index, the ILO unemployment rate, consumer price index, retail price index and house price index, all scheduled to release next week.
The currency pair is showing convergence with its 20 Hr moving average and trading above its 50 Hr moving average.
BoJ Kept Its Benchmark Interest Rate Unchanged At -0.1%
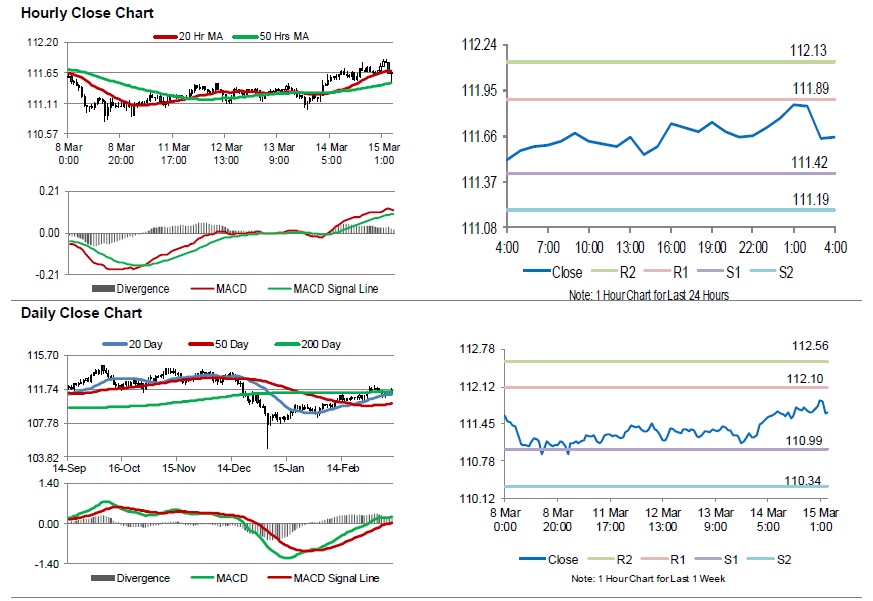
For the 24 hours to 23:00 GMT, the USD rose 0.45% against the JPY and closed at 111.71.
In the Asian session, at GMT0400, the pair is trading at 111.65, with the USD trading 0.05% lower against the JPY from yesterday’s close.
The Bank of Japan, in its March monetary policy meeting, left its interest rate steady at -0.1%, as widely expected and warned growth in exports and factory output will decline, leading to mounting overseas risks that could hinder the weak economic recovery.
The pair is expected to find support at 111.42, and a fall through could take it to the next support level of 111.19. The pair is expected to find its first resistance at 111.89, and a rise through could take it to the next resistance level of 112.13.
The currency pair is showing convergence with its 20 Hr and 50 Hr moving averages.
Switzerland’s Producer And Import Price Declined In February
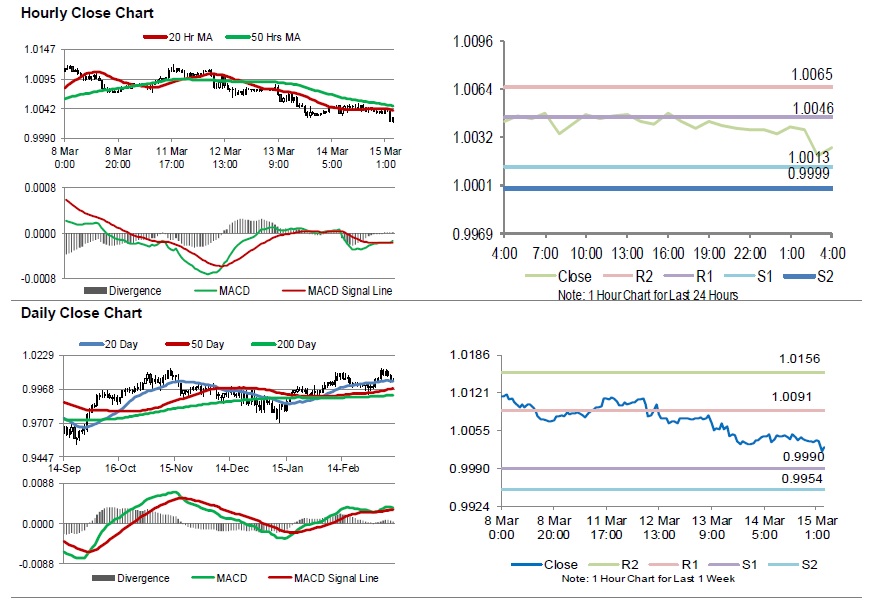
For the 24 hours to 23:00 GMT, the USD rose 0.06% against the CHF and closed at 1.0037.
On macro front, Switzerland's producer and import price index eased 0.7% on a yearly basis in February, less than market expectations for a drop of 1.0%. The index had recorded a decline of 0.5% in the prior month.
In the Asian session, at GMT0400, the pair is trading at 1.0026, with the USD trading 0.11% lower against the CHF from yesterday's close.
The pair is expected to find support at 1.0013, and a fall through could take it to the next support level of 0.9999. The pair is expected to find its first resistance at 1.0046, and a rise through could take it to the next resistance level of 1.0065.
Looking forward, investors would keep an eye on Switzerland's trade balance data, set to release next week.
The currency pair is trading below its 20 Hr and 50 Hr moving averages.
Canada’s New Housing Price Index Unexpectedly Fell In January
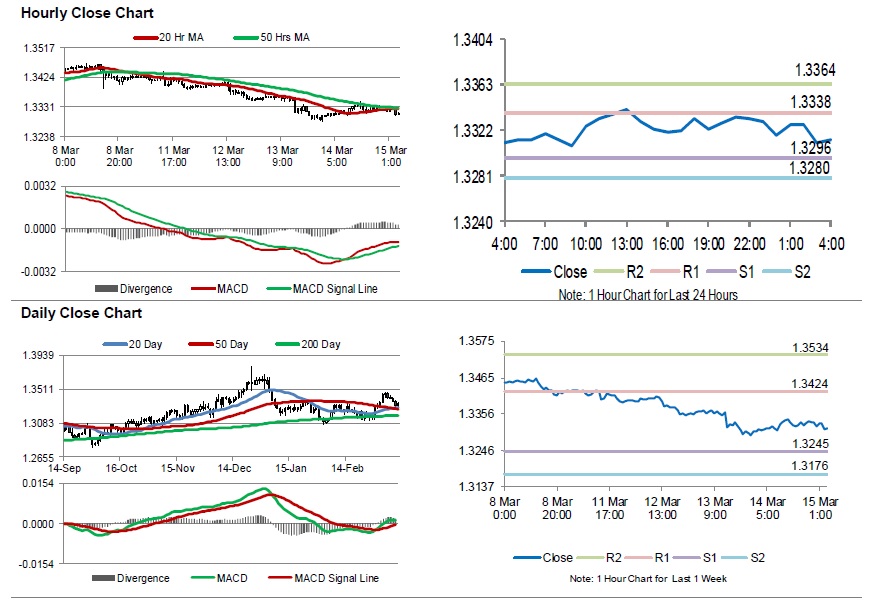
For the 24 hours to 23:00 GMT, the USD rose 0.29% against the CAD and closed at 1.3330.
On the macro front, Canada's new housing price index unexpectedly slid 0.1% on a yearly basis in January, compared to a flat reading in the prior month. Market participants had envisaged the index to remain unchanged.
In the Asian session, at GMT0400, the pair is trading at 1.3313, with the USD trading 0.13% lower against the CAD from yesterday's close.
The pair is expected to find support at 1.3296, and a fall through could take it to the next support level of 1.3280. The pair is expected to find its first resistance at 1.3338, and a rise through could take it to the next resistance level of 1.3364.
Trading trend in the Loonie today, is expected to be determined by Canada's manufacturing shipments for January and existing home sales for February, slated to release later in the day.
The currency pair is trading below its 20 Hr and 50 Hr moving averages.
Aussie Reverses Its Losses In The Asian Session
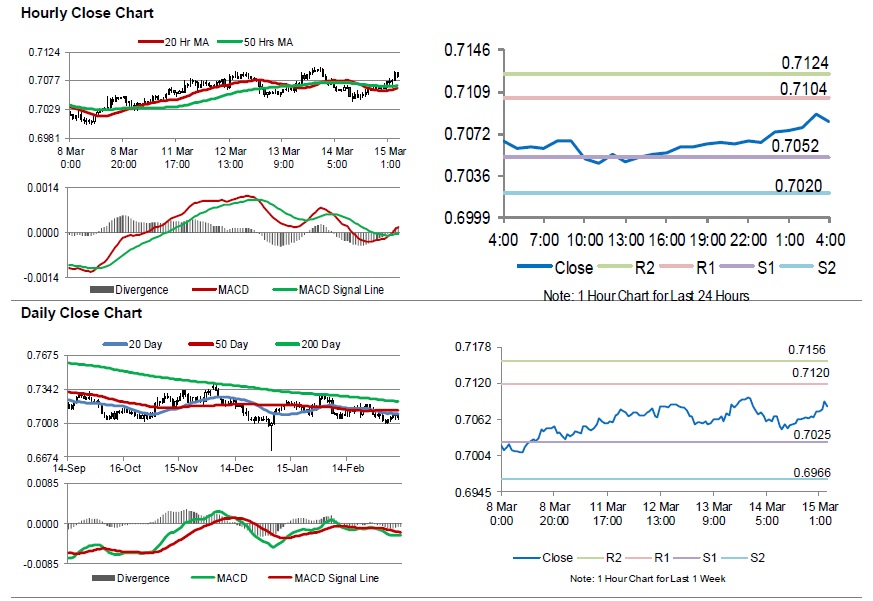
For the 24 hours to 23:00 GMT, the AUD declined 0.42% against the USD and closed at 0.7065.
LME Copper prices declined 1.8% or $120.0/MT to $6409.0/MT. Aluminium prices rose 0.03% or $0.5/MT to $1873.5/MT.
In the Asian session, at GMT0400, the pair is trading at 0.7083, with the AUD trading 0.25% higher against the USD from yesterday’s close.
Elsewhere in China, Australia’s largest trading partner, new home prices advanced 0.5% on a monthly basis in February, following a rise of 0.6% in the preceding month.
The pair is expected to find support at 0.7052, and a fall through could take it to the next support level of 0.7020. The pair is expected to find its first resistance at 0.7104, and a rise through could take it to the next resistance level of 0.7124.
Going ahead, investors would await Australia’s unemployment rate, the Westpac leading index and house price index, all set to release next week.
The currency pair is trading above its 20 Hr and 50 Hr moving averages.
Gold: Yellow Metal Reverses Its Losses In The Morning Session
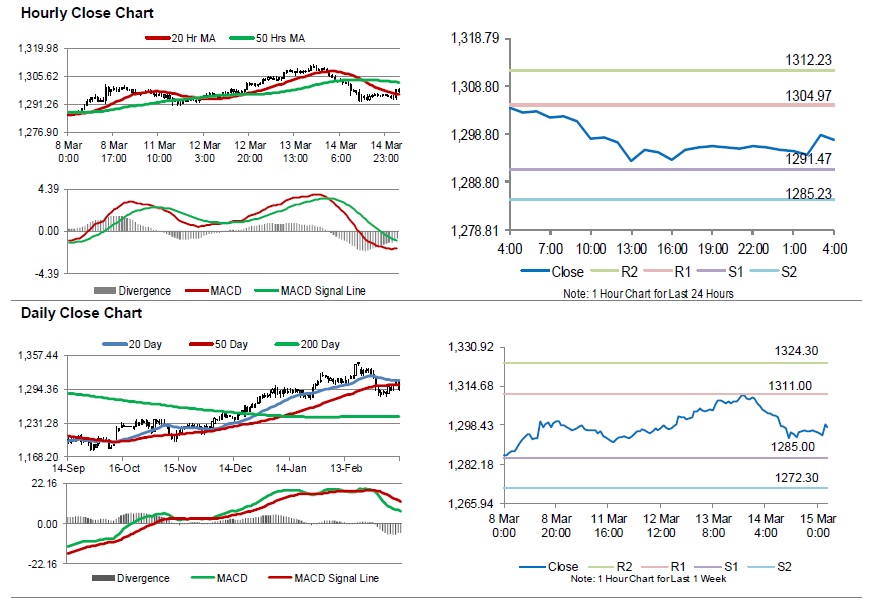
For the 24 hours to 23:00 GMT, Gold declined 1.05% against the USD and closed at USD1296.20 per ounce, amid broad strength in the US Dollar.
In the Asian session, at GMT0400, the pair is trading at 1297.70, with gold trading 0.12% higher against the USD from yesterday’s close.
The pair is expected to find support at 1291.47, and a fall through could take it to the next support level of 1285.23. The pair is expected to find its first resistance at 1304.97, and a rise through could take it to the next resistance level of 1312.23.
The yellow metal is trading in between its 20 Hr and 50 Hr moving averages.
Silver: White Metal Trading On A Stronger Footing This Morning
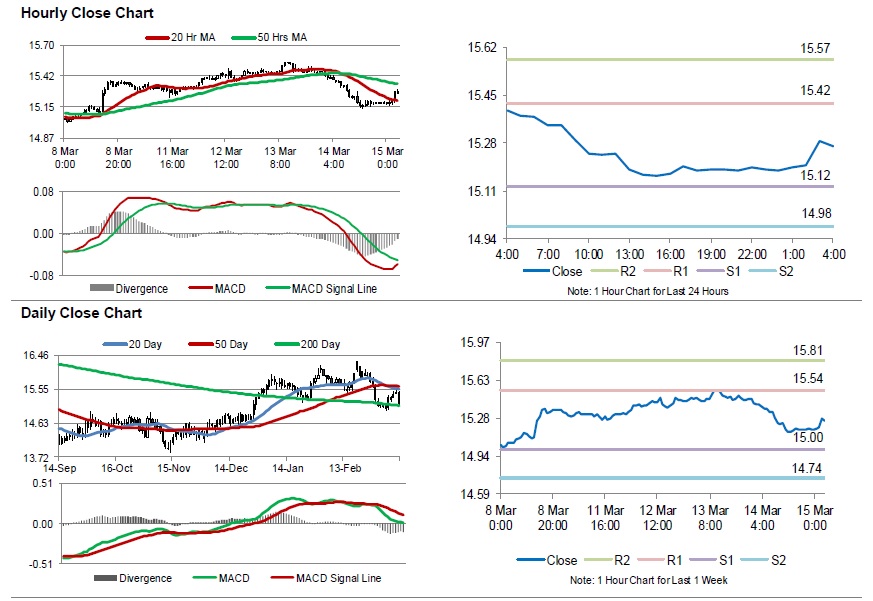
For the 24 hours to 23:00 GMT, Silver declined 1.81% against the USD and closed at USD15.19 per ounce, tracking losses in gold prices.
In the Asian session, at GMT0400, the pair is trading at 15.27, with silver trading 0.53% higher against the USD from yesterday’s close.
The pair is expected to find support at 15.12, and a fall through could take it to the next support level of 14.98. The pair is expected to find its first resistance at 15.42, and a rise through could take it to the next resistance level of 15.57.
The white metal is trading in between its 20 Hr and 50 Hr moving averages.
FOMC Preview: Fed to Maintain Dovish Tone and Announce Plan to End Balance Sheet Reduction
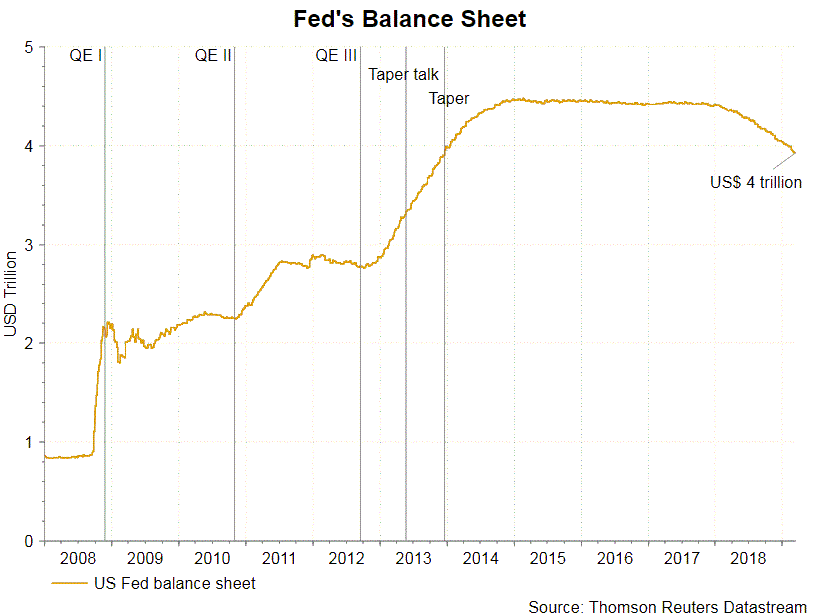
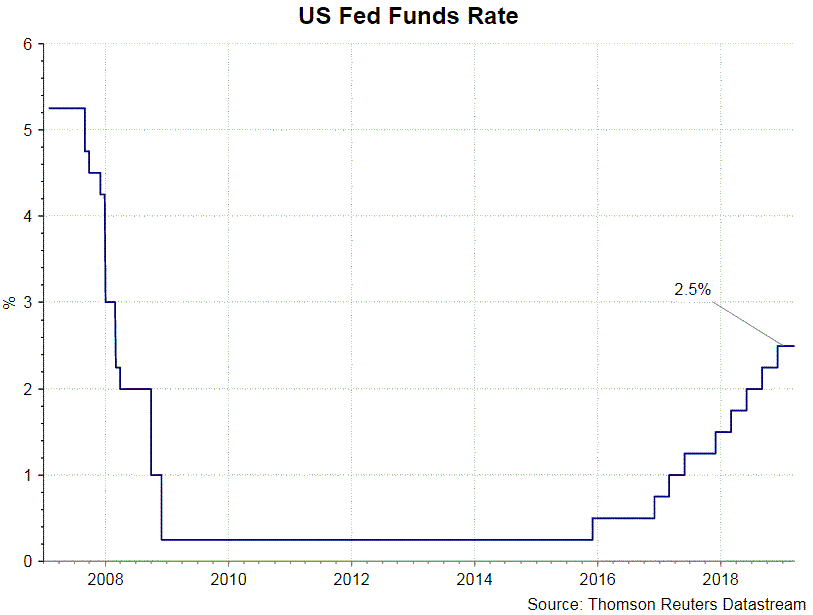
At the upcoming FOMC meeting, the members would vote to leave the Fed funds rate target at 2.25-2.5%. We expect reinforcement of the dovish message conveyed in January. The focus is on the plan to complete the reduction of its balance sheet, which peaked at US$ 4.5 trillion in 2015. Besides, the Fed would release its quarterly median dot plot and updated economic projections.
Economy Slowed Further since January Meeting
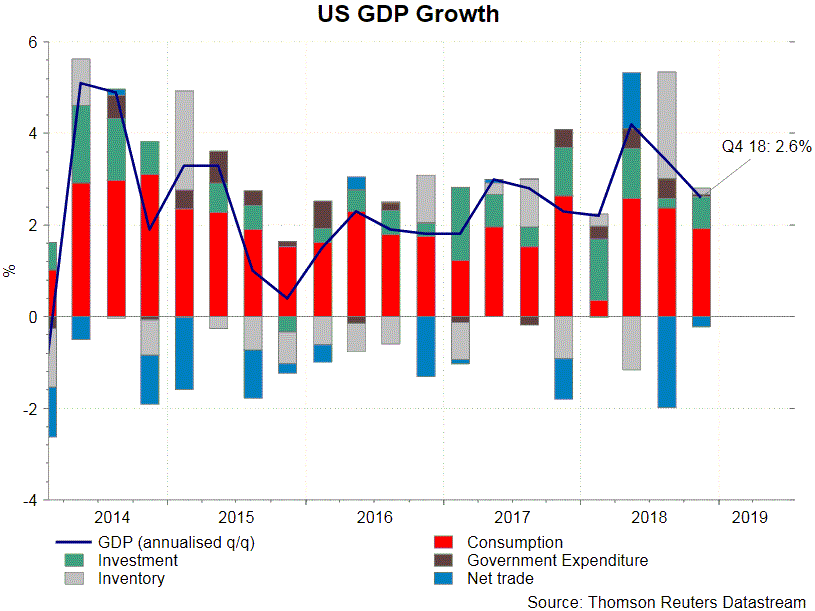
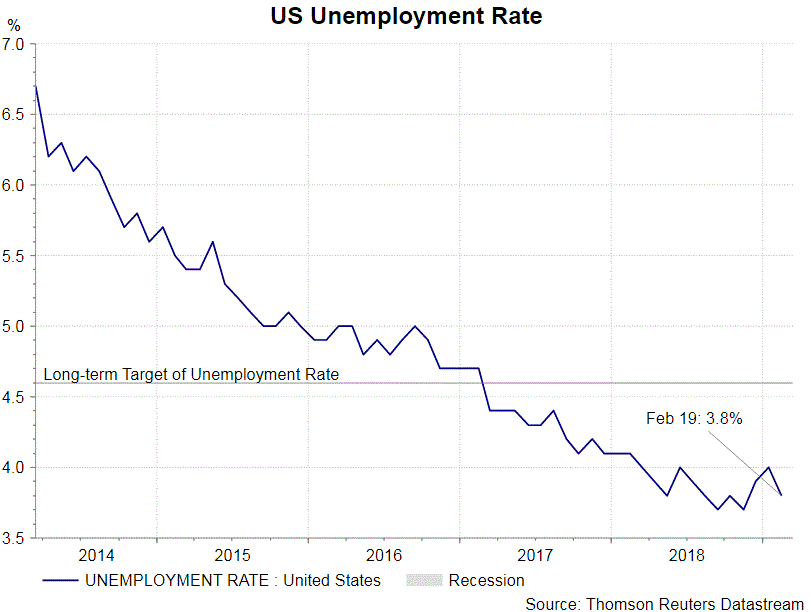
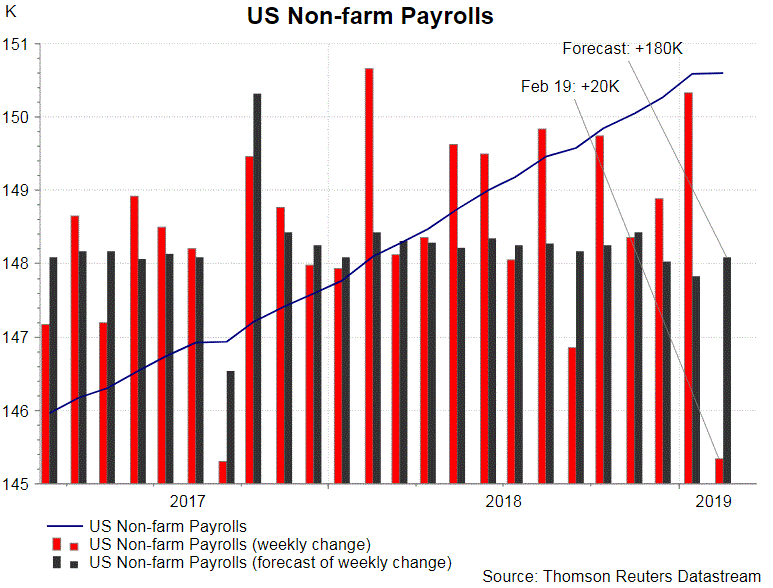
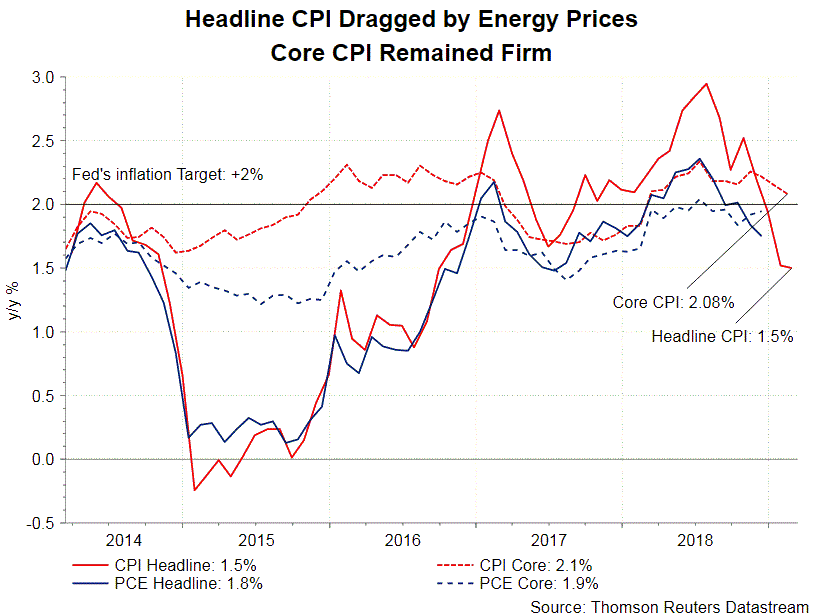
Economic developments since the January meeting have continued to slow, in line with the Fed’s dovish stance. GDP growth decelerated to an annualized +2.6% q/q in 4Q18. The slowdown was, however, less than expected, as supported by business investment. The latest data on the job market was disappointing. Non-farm payrolls increased +20K in February, sharply lower than consensus of +180K and January’s addition of +311K. The unemployment rate slipped to 3.8%. On inflation, headline CPI reached 2.5-year low of +1.5% y/y in February. Yet, core CPI, at +2.08%, stayed around the Fed’s target. The Fed’s preferred measures of inflation, core PCE, climbed higher to +1.94% y/y in December 2018.
End of Balance Sheet Reduction
Recall that the Fed noted in the January statement that it is “prepared to adjust any of the details for completing balance sheet normalization in light of economic and financial developments”. The dovish tone was reinforced in the minutes, which revealed that “almost all participants thought that it would be desirable to announce before too long a plan to stop reducing the Federal Reserve’s asset holdings later this year”. It is likely that the Fed would announce the plan to end balance sheet reduction next week.
Forward Guidance and Median Dot Plot
In January, the Fed called for “patience” in deciding “future adjustments” to the policy rate. We expect it to reinstate this stance in March. As an indicator of the Fed’s interest rate path, the median dot plot is closely-watched. After trimming the number of rate hikes in 2019 to two times (from three times in September) in December, the market is expecting the members to rule out any rate hike this year. In a speech late Friday in Stanford, California, Fed Chair Jerome Powell suggested that there would be a review on the role dot plot. As he noted, “returning to a world of little or no explicit forward guidance in the FOMC’s post-meeting statement presents a challenge, for the dot plot has, on occasion, been a source of confusion”. Yet, he added that there would not be changes in the 2% inflation target.
Economic Projections
Given the moderation in both the global and domestic growth outlook, the Fed would revise lower its GDP growth and inflation projections. However, we expect the downgrades would be less significant than those by ECB. After all, US growth has stay about trend.
Crude Oil: Oil Trading Higher, Ahead Of Baker Hughes Weekly Rig Count Data
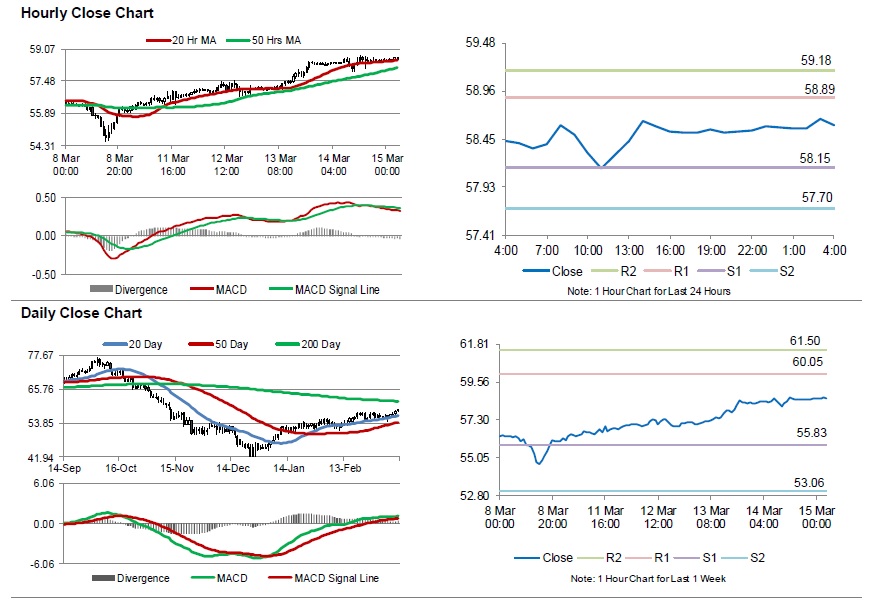
For the 24 hours to 23:00 GMT, Crude Oil rose 0.39% against the USD and closed at USD58.58 per barrel, after OPEC’s monthly report revealed a slowdown in crude output cuts by the members and delay in US-China trade discussions.
In the Asian session, at GMT0400, the pair is trading at 58.59, with oil trading a tad higher against the USD from yesterday’s close.
The pair is expected to find support at 58.15, and a fall through could take it to the next support level of 57.70. The pair is expected to find its first resistance at 58.89, and a rise through could take it to the next resistance level of 59.18.
Crude oil is showing convergence with its 20 Hr moving average and trading above its 50 Hr moving average.
Elliott Wave View: Nasdaq Correction In Progress
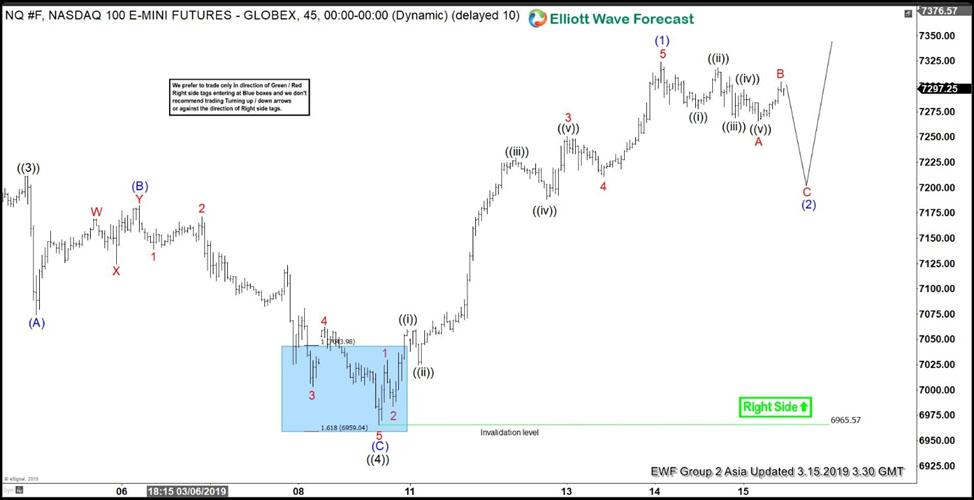
Rally in Nasdaq (NQ_F) from December 26, 2018 low remains in progress as an impulse Elliott Wave structure. An impulse structure consists of a 5 waves move. Wave ((4)) of this impulse move has ended at 6965.57. As the chart below shows, after forming wave ((4)) low, Nasdaq has rallied higher and broken above March 4 high at 7211.5, confirming that wave ((5)) has started. Up from 6965.57, the rally ended wave (1) at 7324.25 as an impulse. Internal of wave (1) subdivides into 5 waves where wave 1 ended at 7029.5, and wave 2 ended at 6983.5. Wave 3 ended at 7250.5 ,wave 4 ended at 7211, and wave 5 of (1) ended at 7324.25.
Near term, Index is correcting cycle from March 8 low within wave (2) before the rally resumes. Wave (2) pullback takes the form of a zigzag Elliott Wave structure where wave A of this zigzag ended at 7265.7. While the Index stays below 7324.25, it has scope to do 1 more leg lower to finish wave C of (2). As far as pivot at 6965.57 low stays intact, expect the Index to find buyers in 3, 7, or 11 swing for further upside. We don’t like selling the Index.
1 Hour Nasdaq (NQ_F) Elliott Wave Chart